-
-
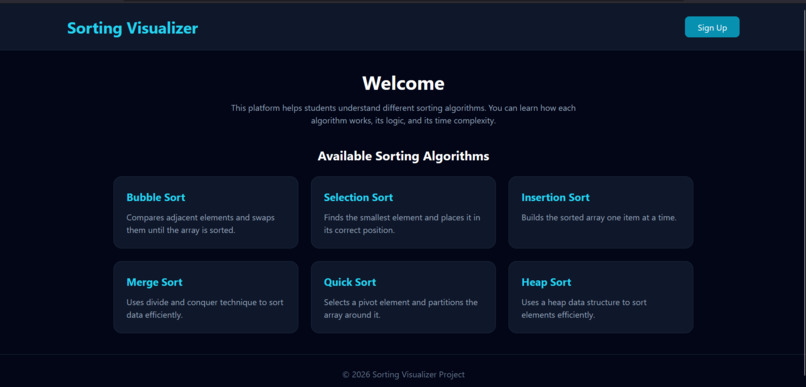
Front Page
-

Sign up
-
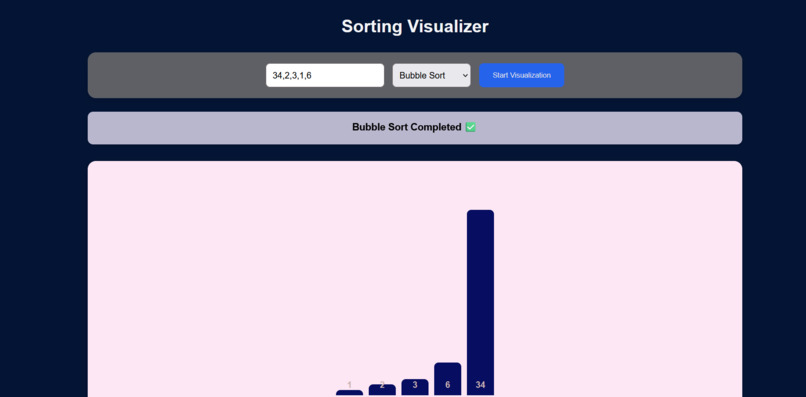
Visualizer
-

Dashboard
-
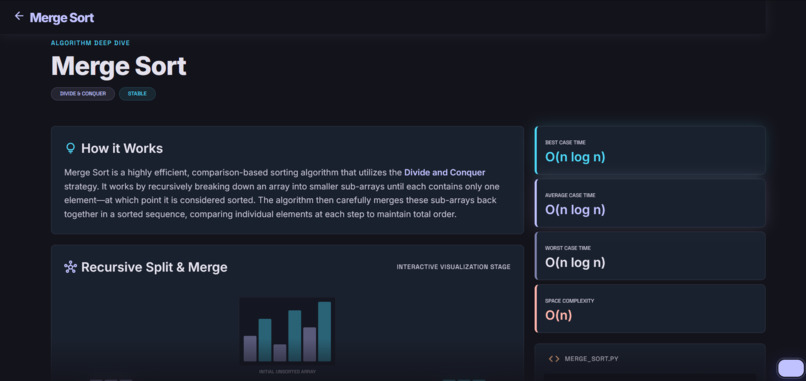
Merge sort
-
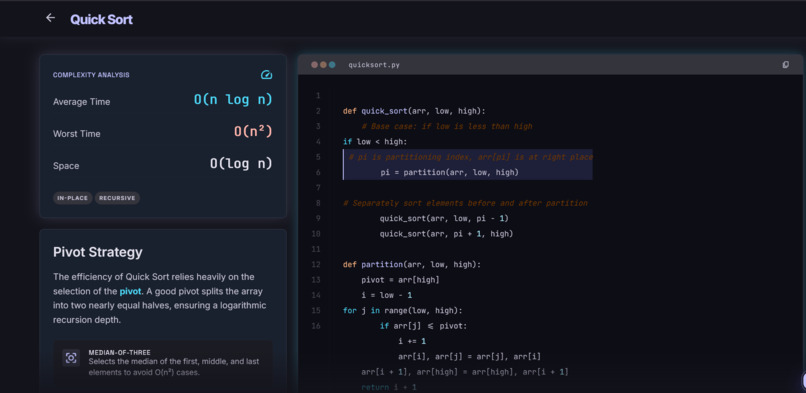
Quick sort
-
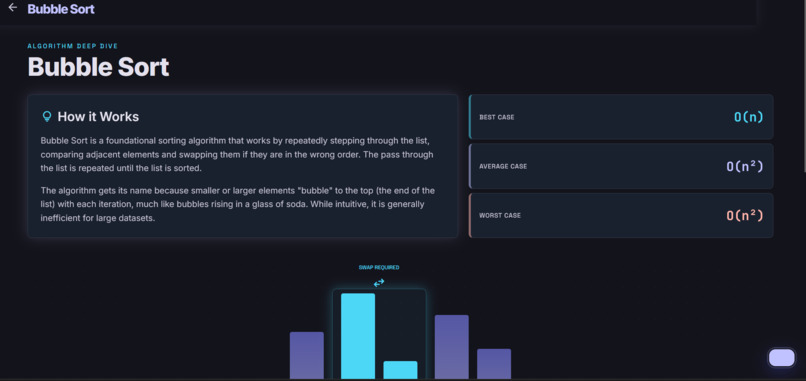
Bubble sort
-
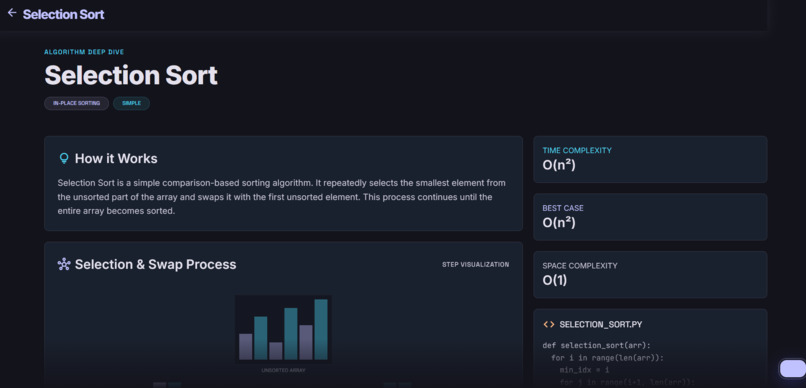
Selection sort
-
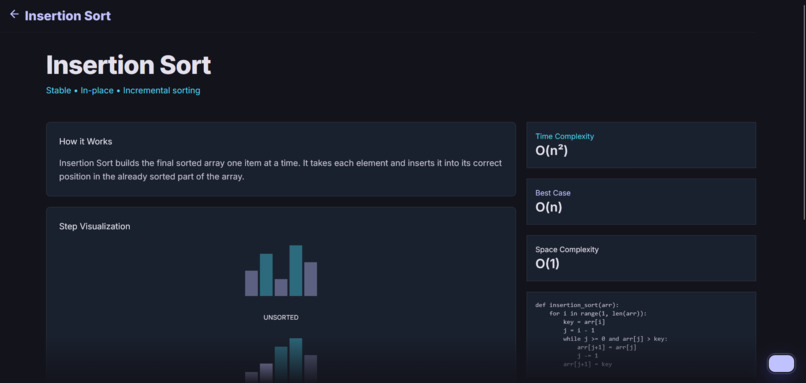
Insertion sort
-
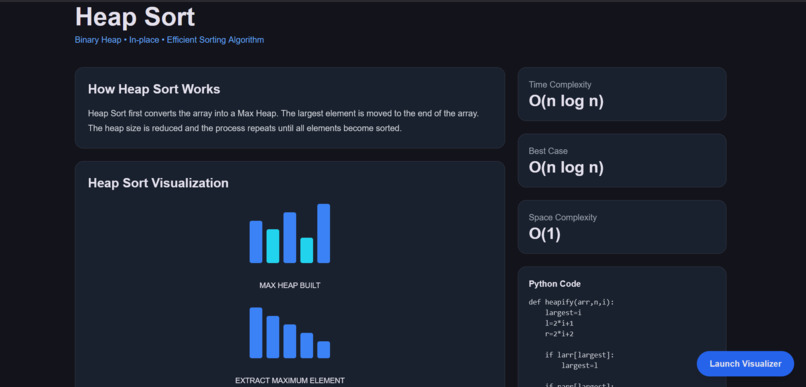
Heap sort
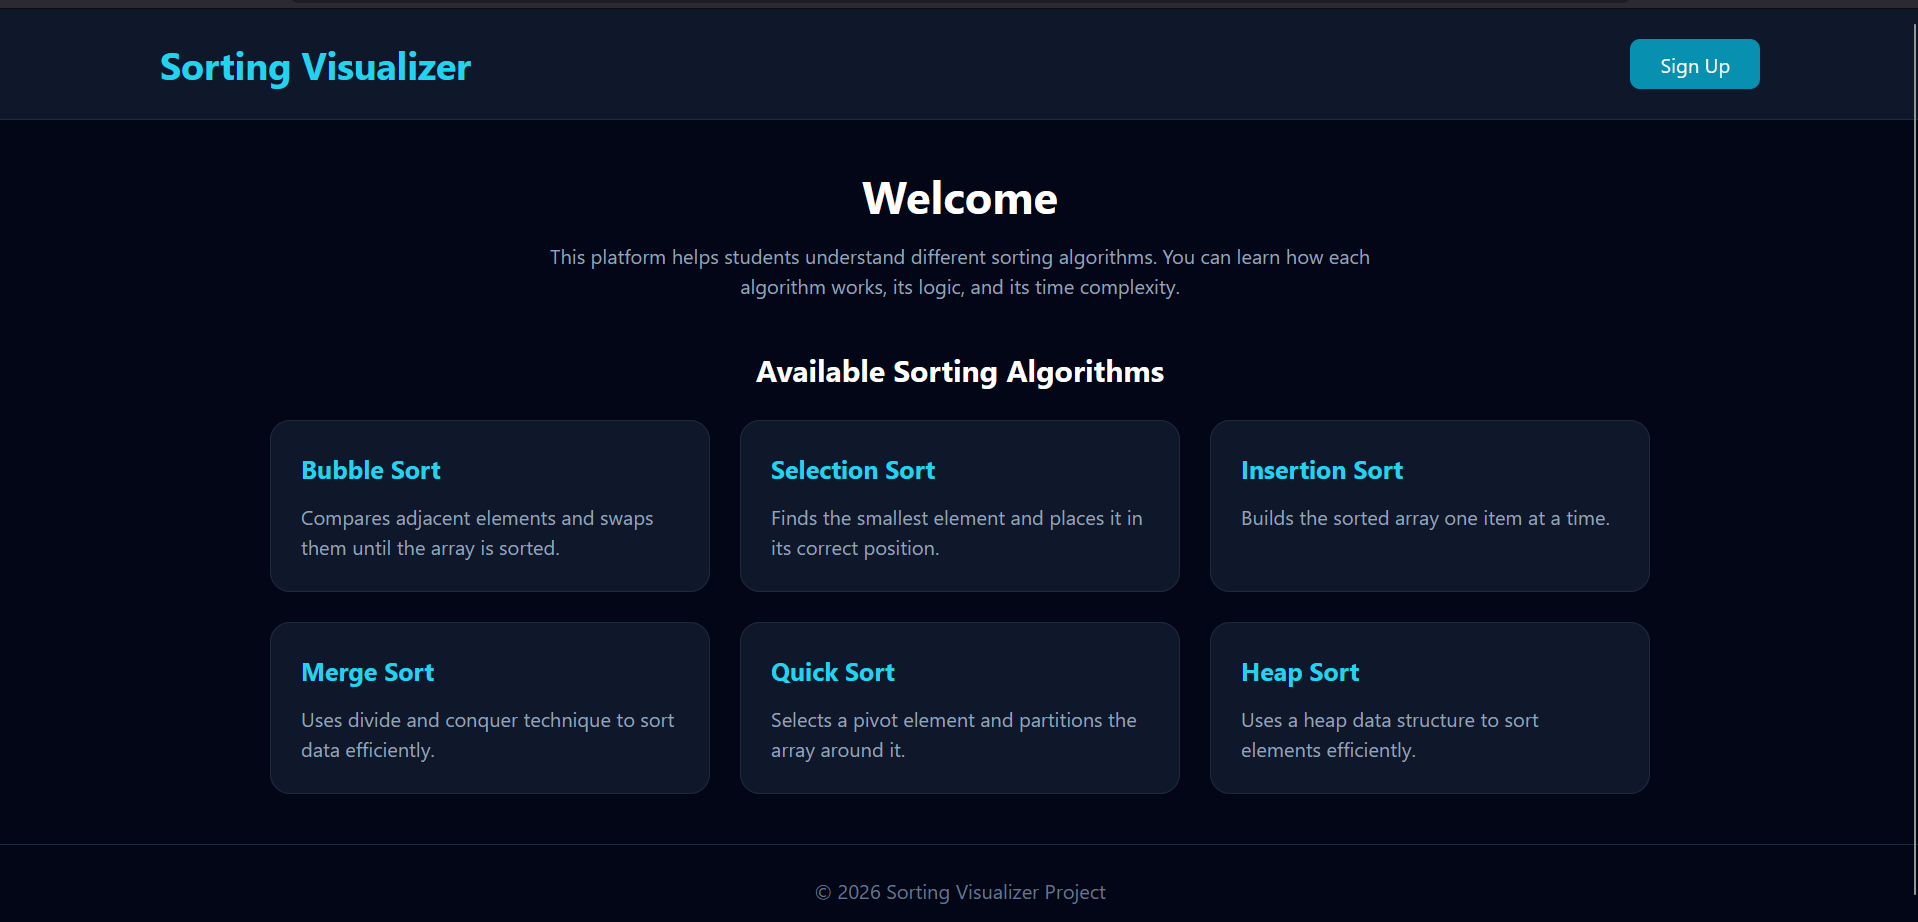

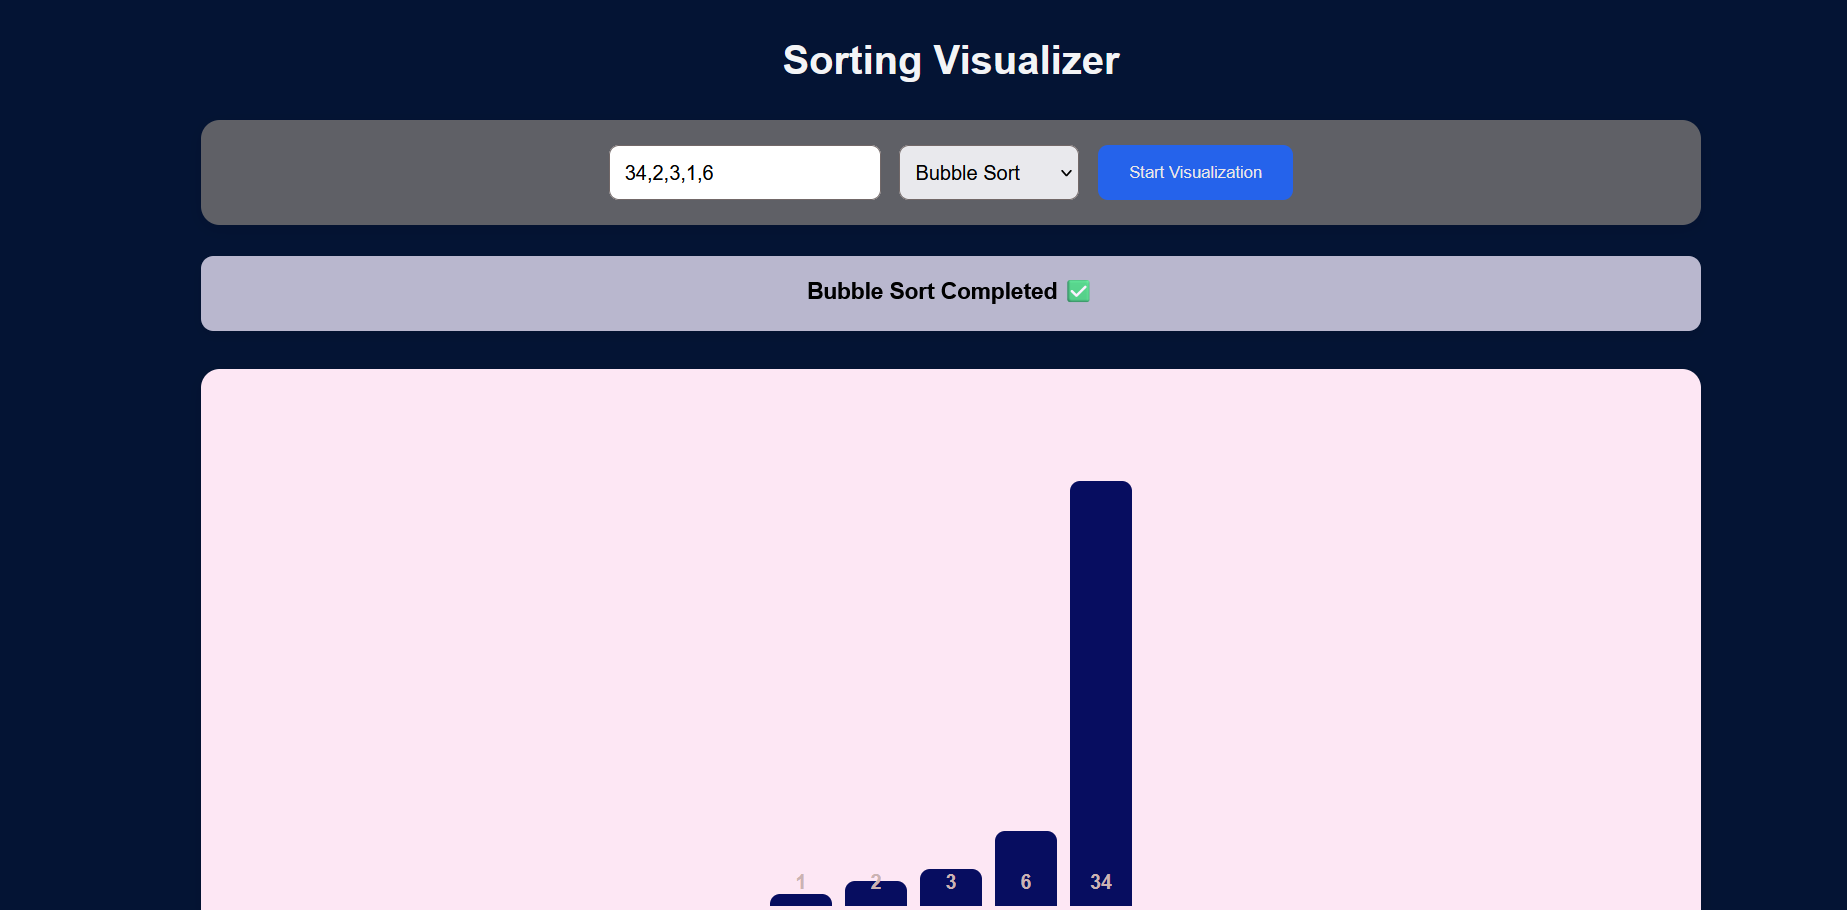
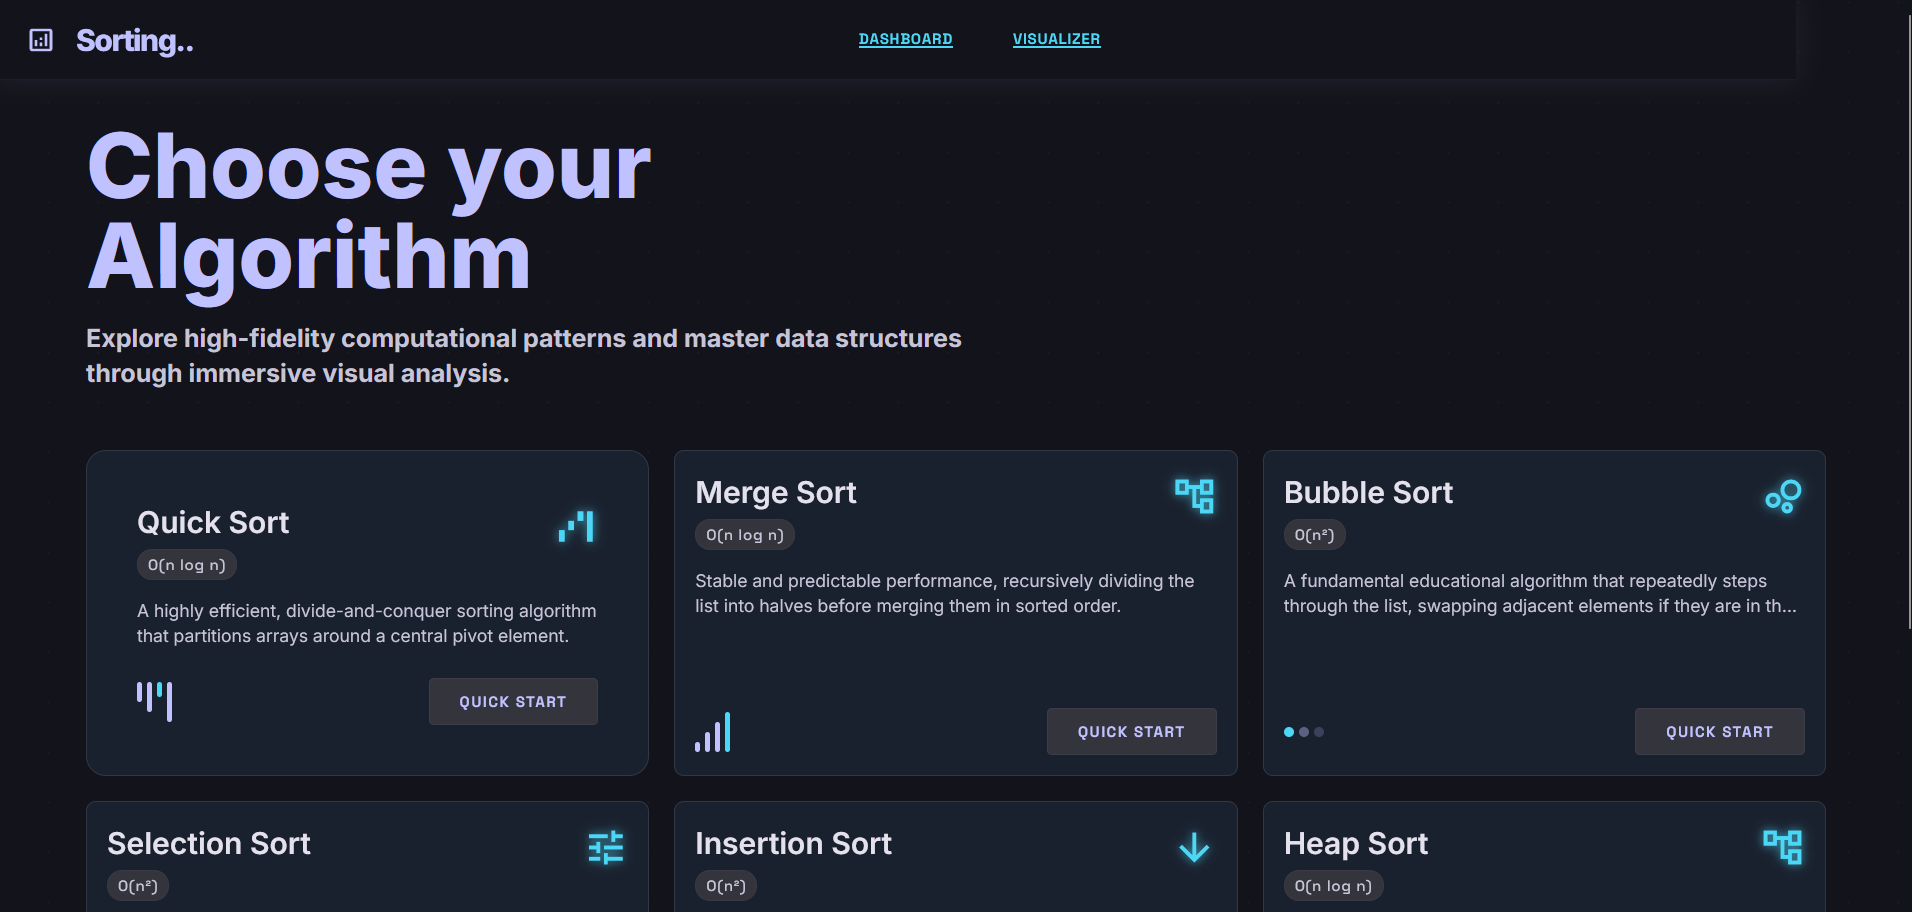
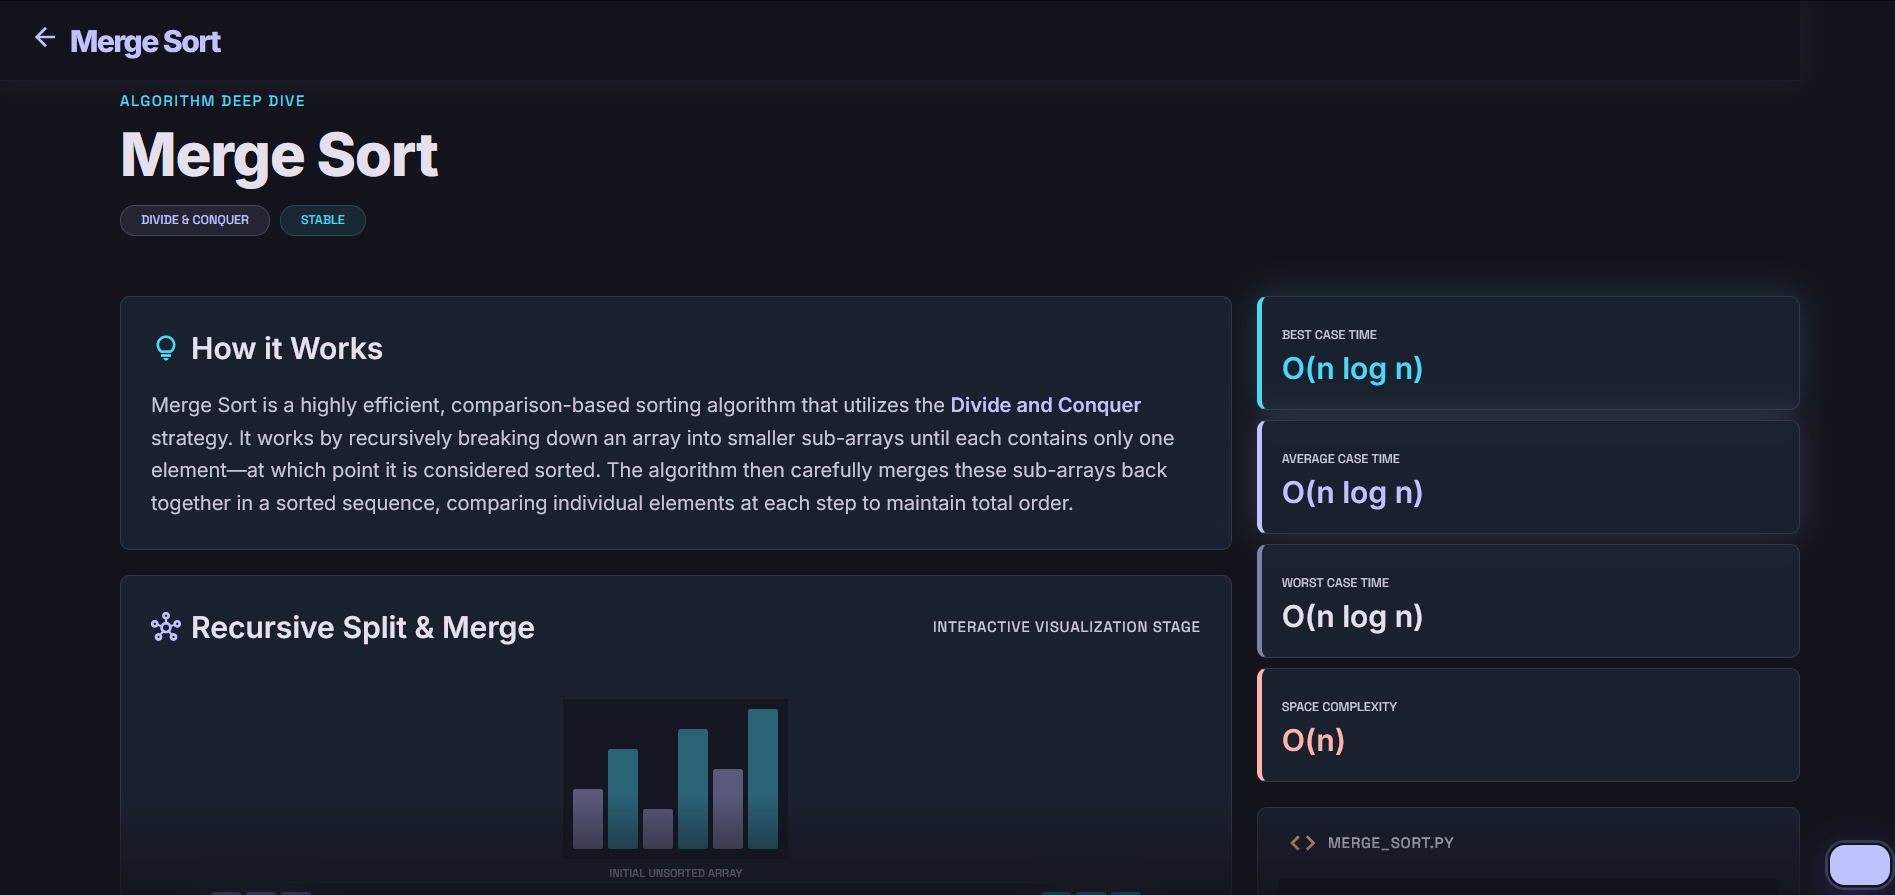
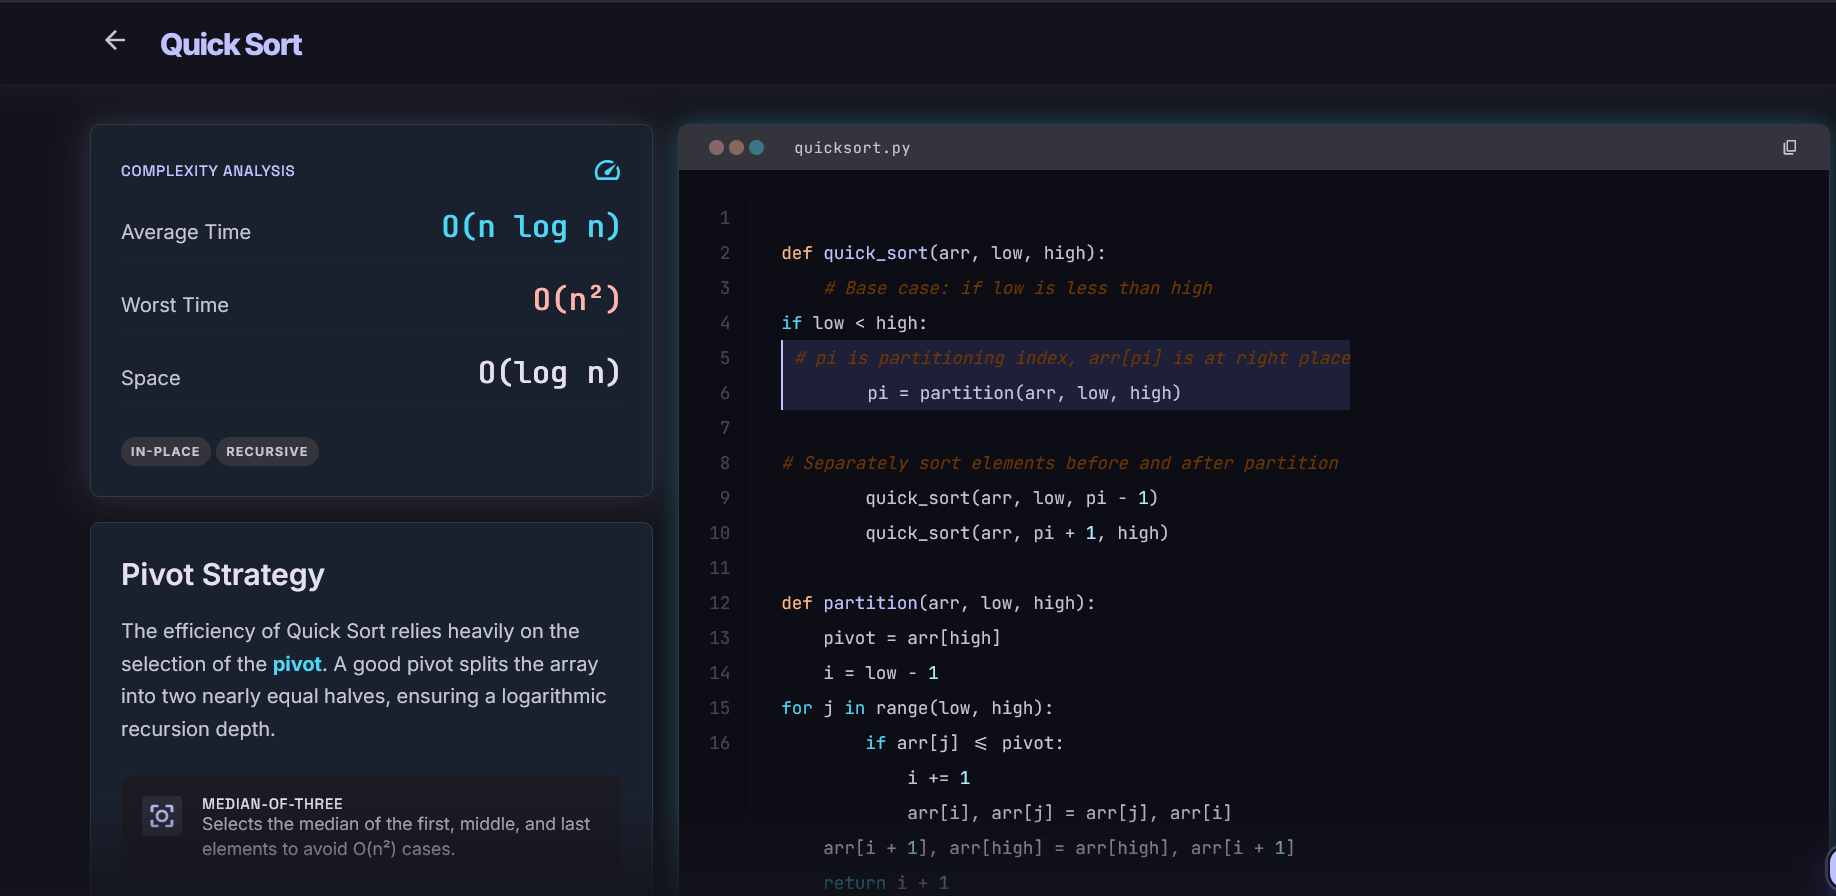
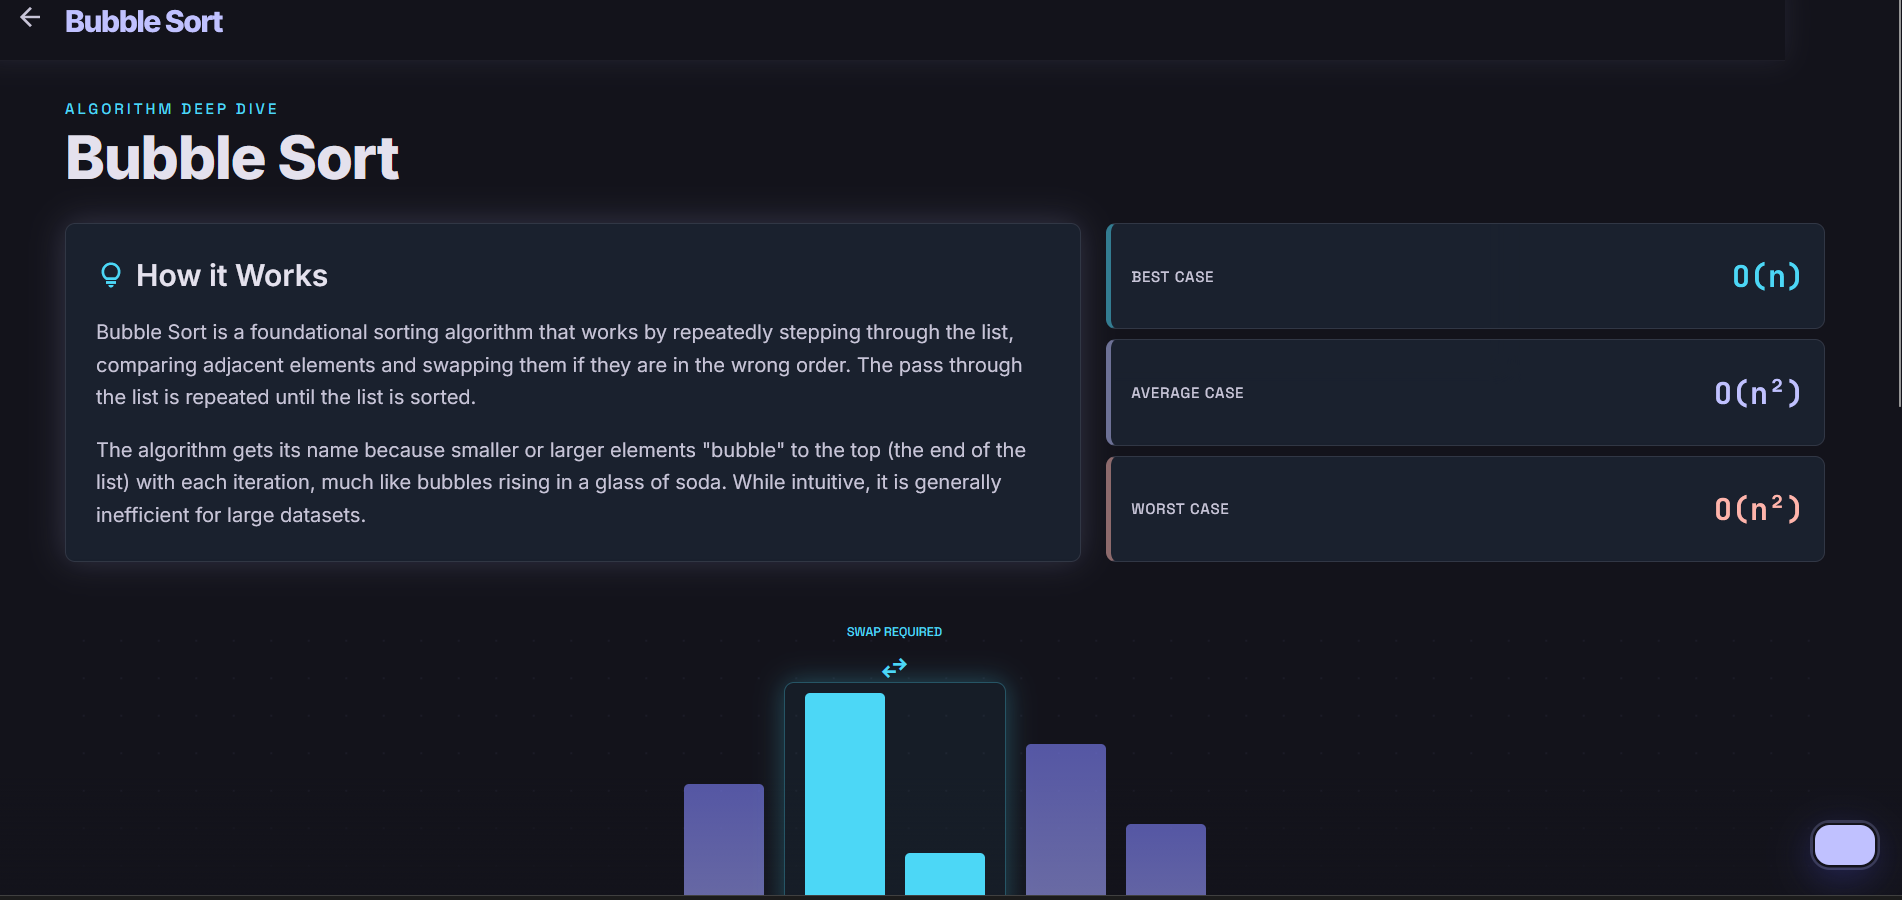
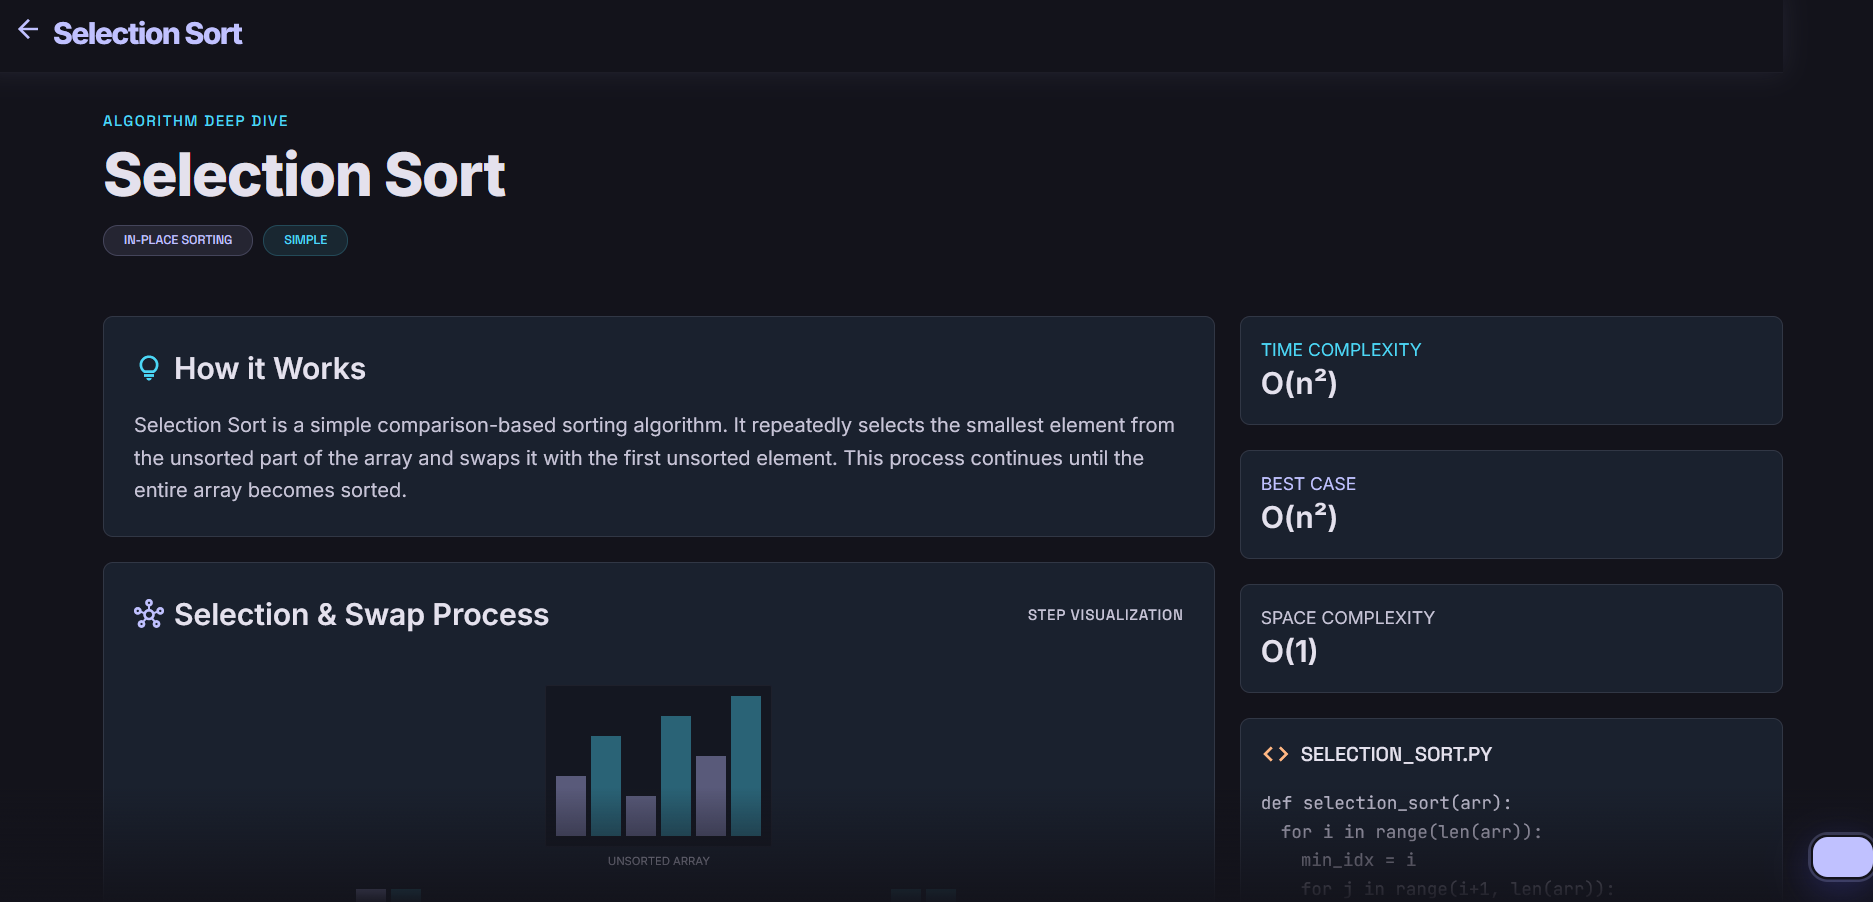
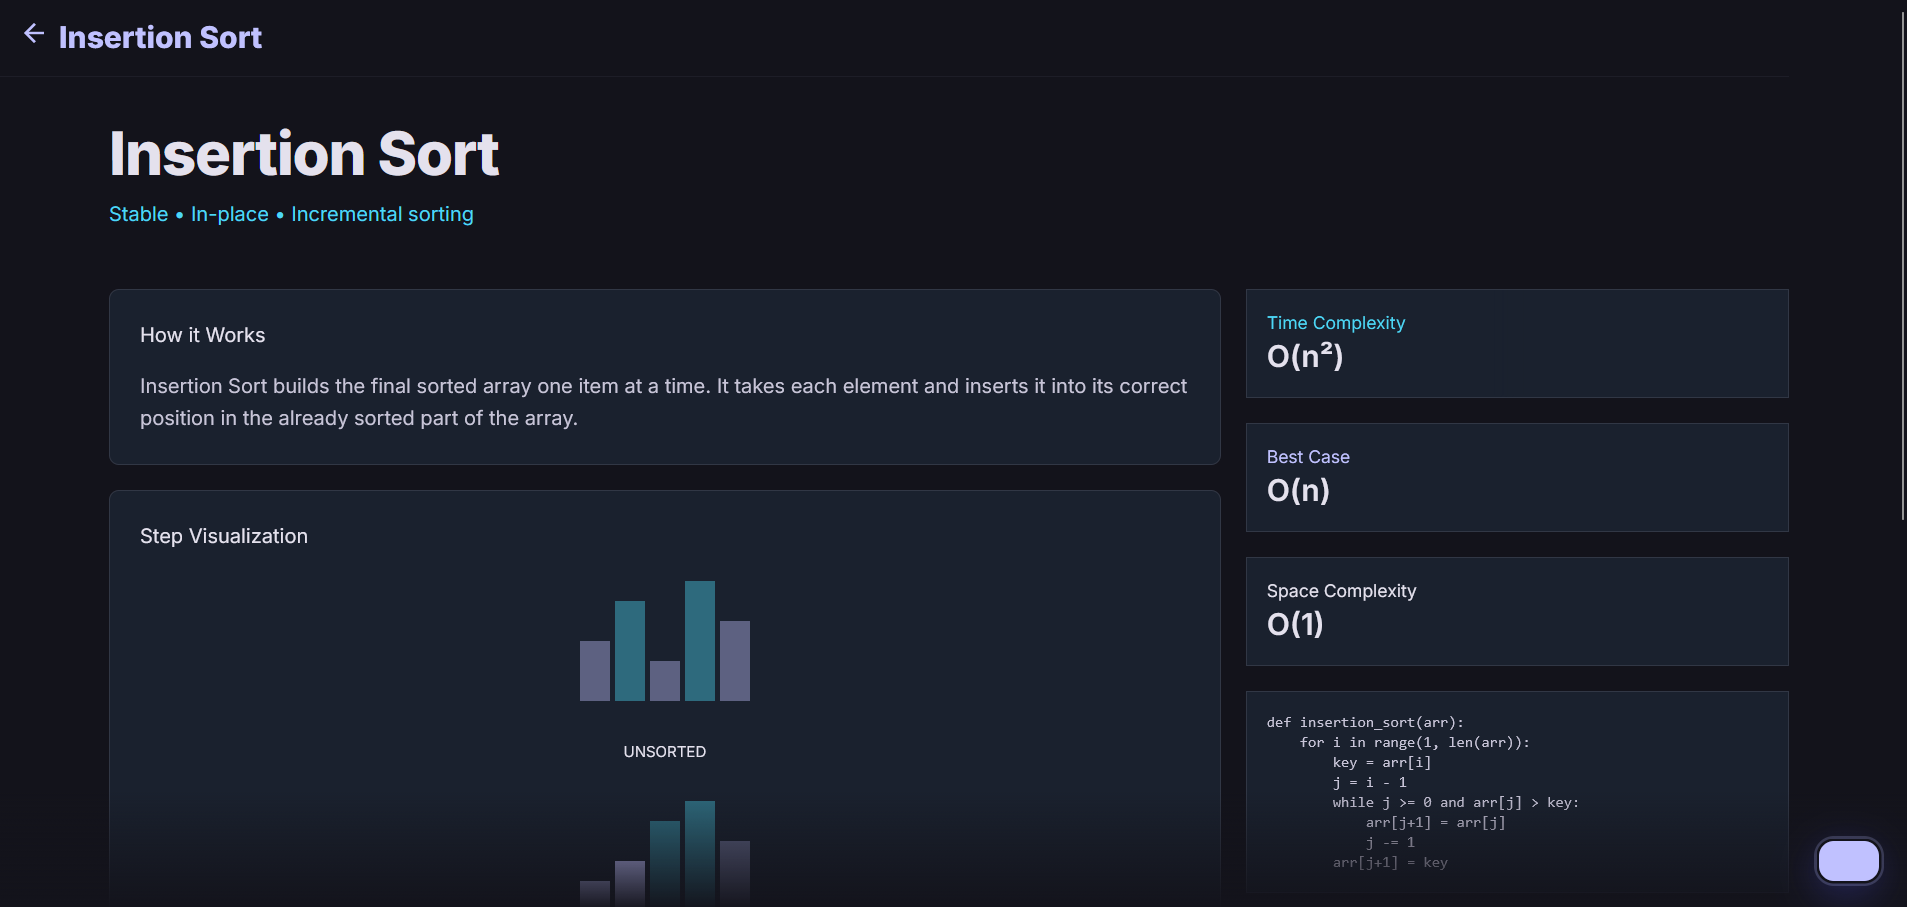
Real World DSA Visualizer
Inspiration:- Data structures and algorithms are the backbone of computer science, but many students struggle with them because they are abstract. Reading code or looking at static textbook diagrams doesn't show what actually happens inside a sorting loop or a tree traversal. We wanted a tool that lets learners see each step as it happens, so concepts click faster.
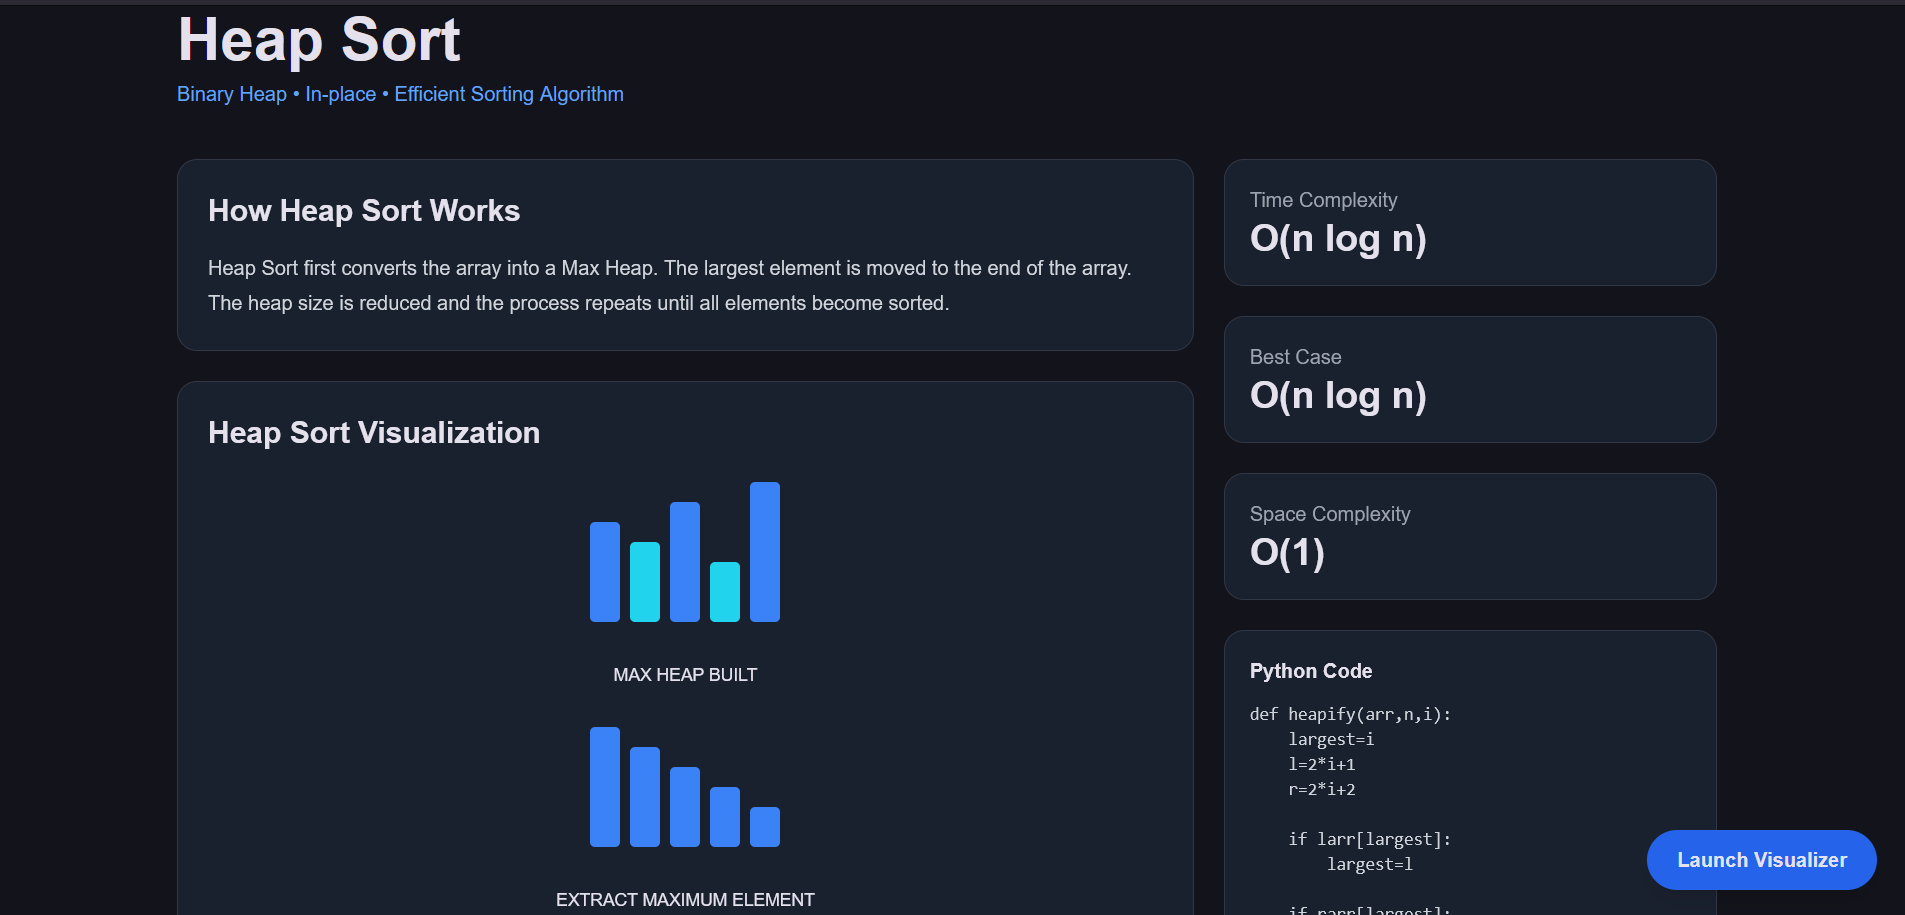
What it does:- Real World DSA Visualizer is a web platform that animates data structures and algorithms in real time. Users can: Watch sorting, searching, linked list, stack, queue, tree, and graph operations run step by step. Play, pause, step through, and change the speed of the animation. Enter their own data and see how the algorithm handles it. Follow highlighted comparisons, swaps, and pointer movements to understand the logic behind each step.
How we built it:- We built it as a team of 3 using HTML, CSS, and JavaScript for the interactive frontend and animations, with PHP and MySQL for the backend and data storage. We split the work across frontend, backend, and database, and used Git for collaboration and version control.
Challenges we ran into:- Keeping animations smooth and in sync with the algorithm's actual logic. Making the speed and step controls work reliably in the middle of an animation. Designing a layout that stays clear on different screen sizes. Coordinating code and merging changes across a team of 3.
Accomplishments that we're proud of:- A working visualizer that turns complex algorithms into easy-to-follow animations. A full-stack system with a connected frontend, backend, and database. Delivering it as a team, and a project we can use as a learning aid ourselves.
What we learned:- How to turn algorithm logic into step-by-step visual output. Full-stack development with JavaScript, PHP, and MySQL. Team collaboration with Git, including task splitting and conflict resolution. A deeper understanding of the DSA concepts themselves, since we had to know them well to animate them.
What's next for Real World DSA Visualizer:- More algorithms and data structures, such as dynamic programming and advanced graph algorithms. Code view synced with the animation, so users see which line is running. User accounts to track learning progress. Practice questions and quizzes alongside each visualization. Complexity analysis shown live (time and space).

Log in or sign up for Devpost to join the conversation.