-
-
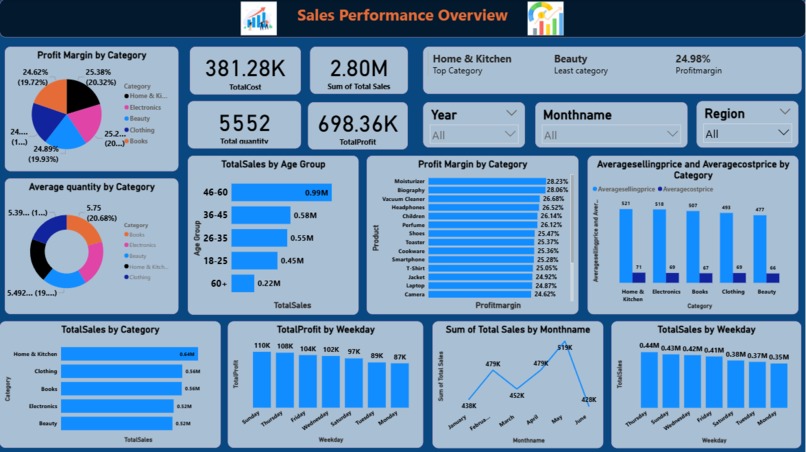
Dashboard Image

Inspiration
Many e-commerce businesses collect large volumes of sales data but struggle to convert it into meaningful insights. The inspiration behind this project was to bridge the gap between raw transactional data and actionable business intelligence by building an interactive dashboard that clearly explains what is happening, why it is happening, and what actions to take next.
What it does
The E-Commerce Sales Performance Analytics Dashboard provides a centralized view of business performance by:
Tracking key sales KPIs such as Total Revenue, Profit, Profit Margin, and Orders
Analysing monthly and seasonal sales trends
Identifying top-performing and underperforming products and categories
Visualizing customer demographics and purchasing patterns
Enabling date and quantity-based filtering
Forecasting future sales trends to support strategic planning
How we built it
The dashboard was built using an end-to-end analytics workflow:
Data Preparation
Cleaned and structured raw sales data in Excel
Handled missing values, duplicates, and data inconsistencies
Prepared data using Power Query
Data Modelling & DAX
Created relationships between sales and customer data
Developed DAX measures for KPIs, time intelligence, and profit calculations
Visualization in Power BI
Designed interactive dashboards with KPI cards, line charts, bar charts, and slicers
Implemented filters and forecasting using Power BI analytics features
Challenges we ran into
Handling inconsistent date formats and missing values in raw data
Designing a dashboard that balances visual clarity with analytical depth
Ensuring correct time-based calculations for monthly and trend analysis
Implementing accurate forecasting with limited historical data
Accomplishments that we're proud of
Built a fully interactive, end-to-end Power BI dashboard
Successfully implemented sales forecasting and dynamic filters
Transformed raw e-commerce data into clear business insights
Designed a professional, recruiter-ready analytics project
Created a reusable dashboard framework for similar business scenarios
What we learned
The importance of data cleaning before visualization
Practical application of DAX measures and time intelligence
How visualization design impacts decision-making
Translating business questions into analytics solutions
Building dashboards with a storytelling approach
What's next for E-Commerce Sales Performance Analytics Dashboard
Integrate real-time data sources
Add advanced customer segmentation (RFM analysis)
Implement predictive models for demand forecasting
Enhance performance with Power BI Service automation
Expand the dashboard to include marketing and inventory analytics
Built With
- dax
- excel
- powerbi
- powerquery

Log in or sign up for Devpost to join the conversation.