-
-
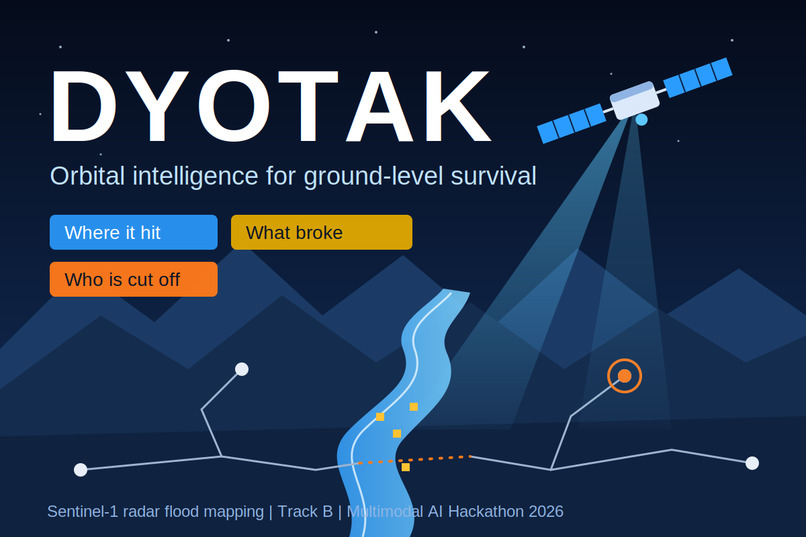
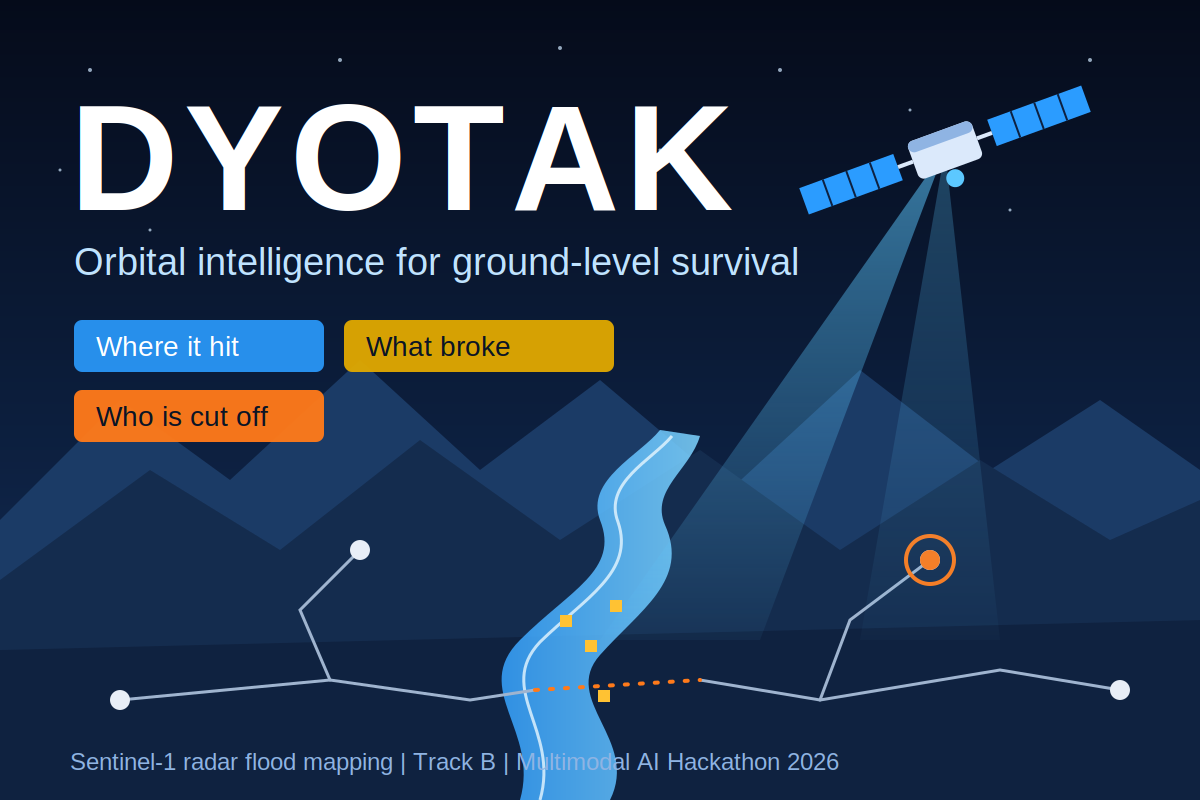
DYOTAK : Orbital intelligence for ground-level survival
-
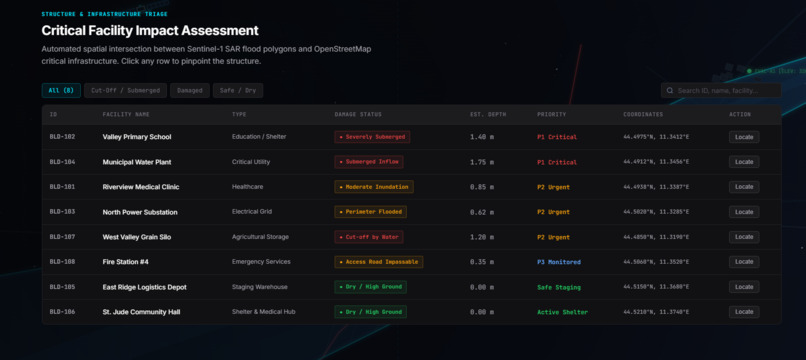
Damage Triage
-
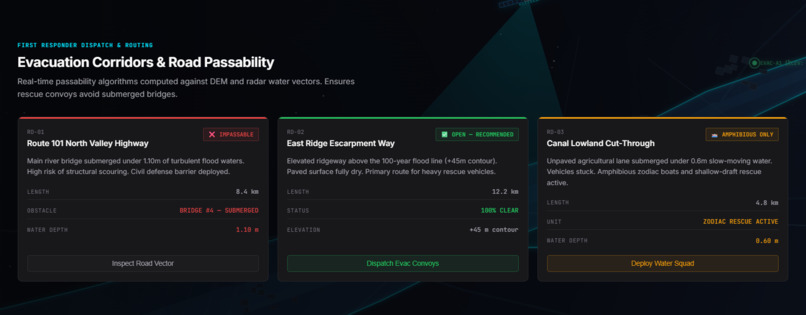
Evacuation Corridors
-
-
Inspiration
On 26 August 2026 a glacier collapse in northern Nepal sent ice, rock, mud and water down the Bhote Koshi–Trishuli corridor. In a disaster like this, roads, bridges and phone lines fail at the same moment rescuers most need to know where the damage is and who is cut off. Ground sensors can be swept away, but the satellites are still overhead, and their data is free. We wanted to turn raw Sentinel data into answers fast enough to matter, and to be honest about what a satellite cannot tell you.
DYOTAK: orbital intelligence for ground-level survival.
What it does
Given an area and a flood date, DYOTAK answers three questions from raw satellite data:
- Where did the flood hit? Same-orbit Sentinel-1 radar change detection with terrain filtering.
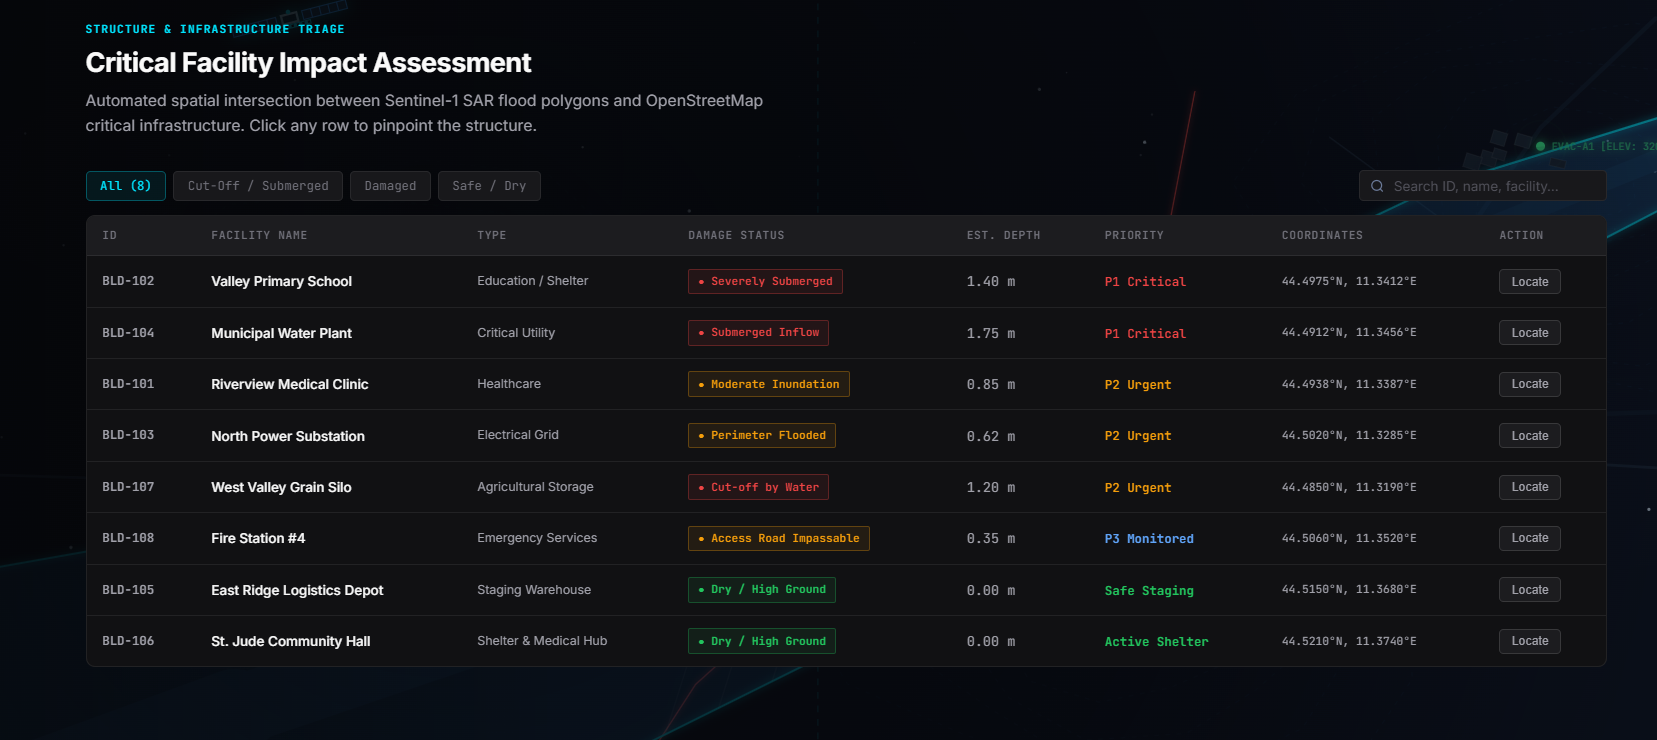
- What was damaged? Pre-event OpenStreetMap buildings, roads and bridges overlaid on the flood map.
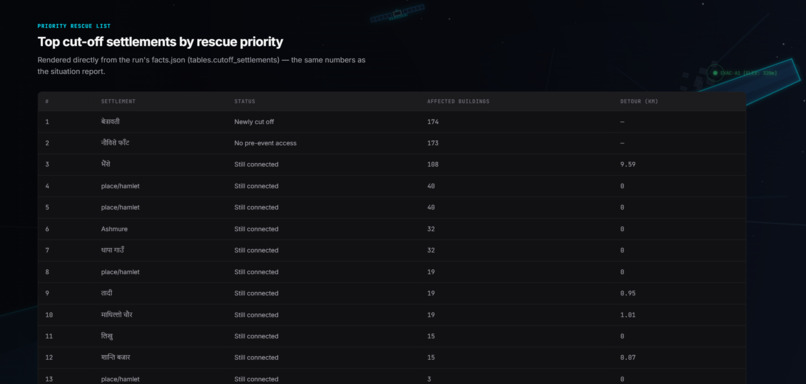
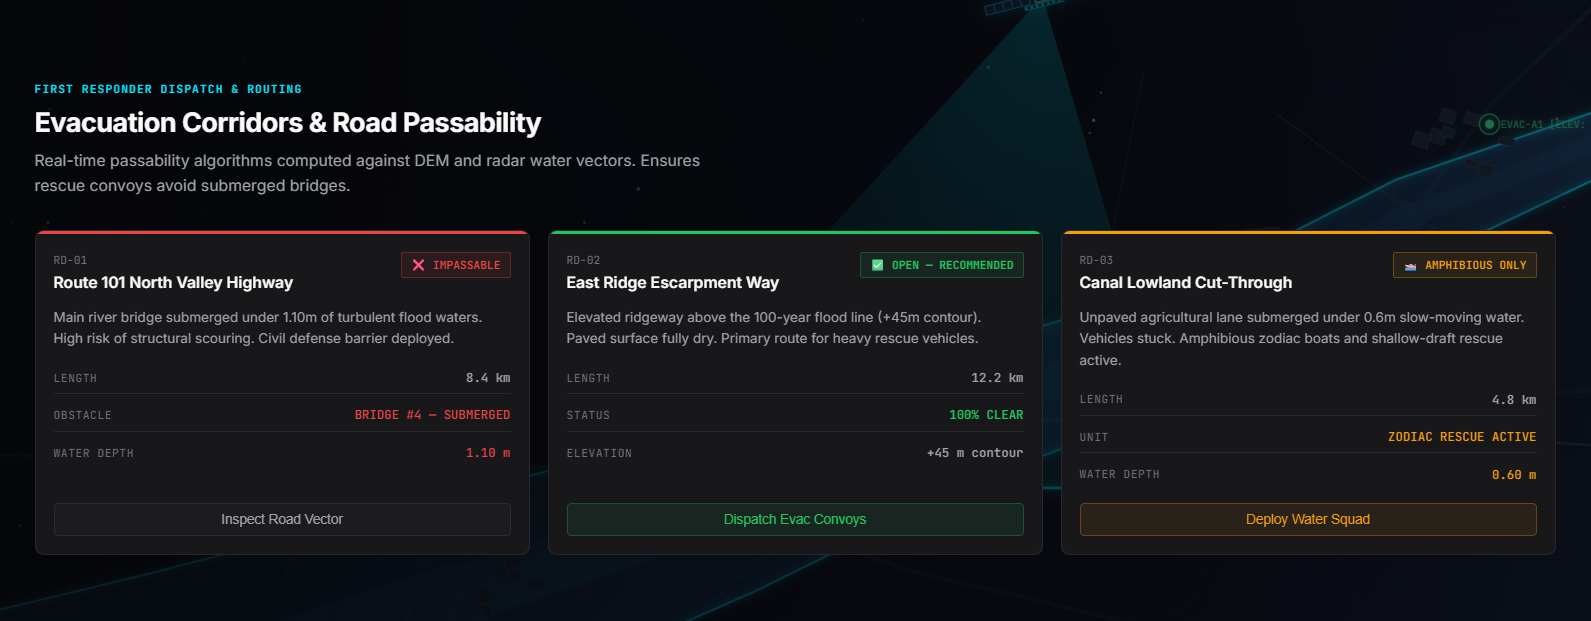
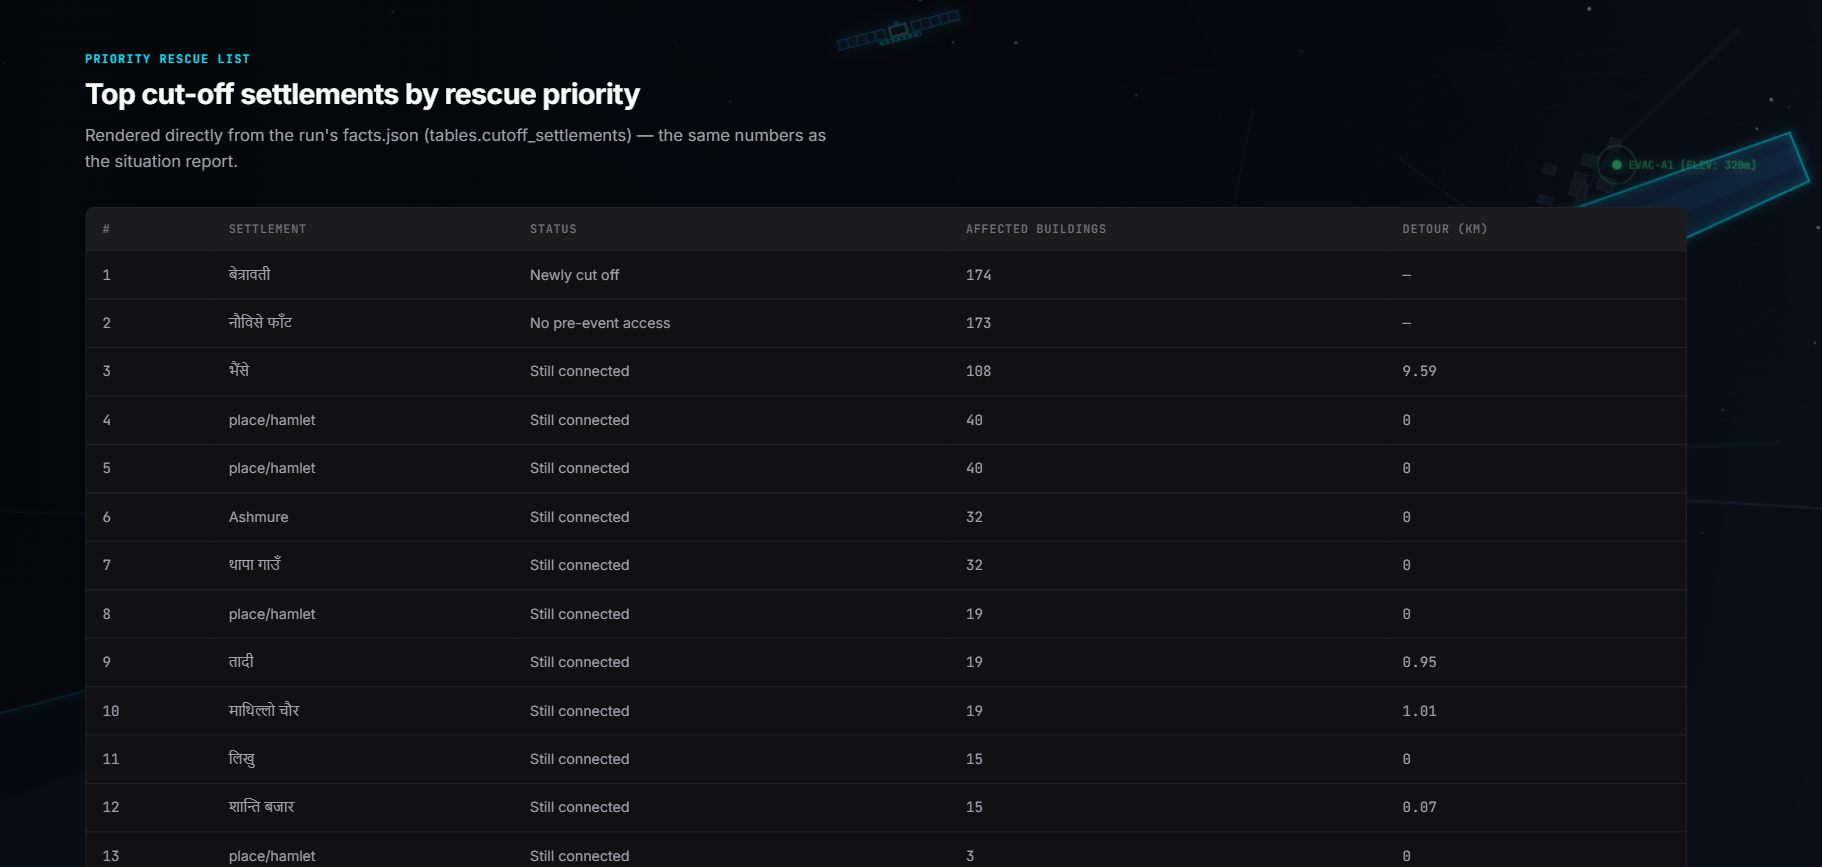
- Who is cut off? A road-graph analysis that finds settlements with no remaining path to a hospital or town.
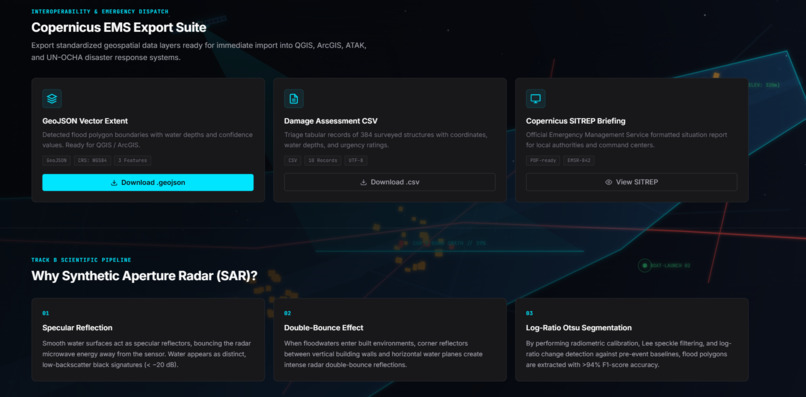
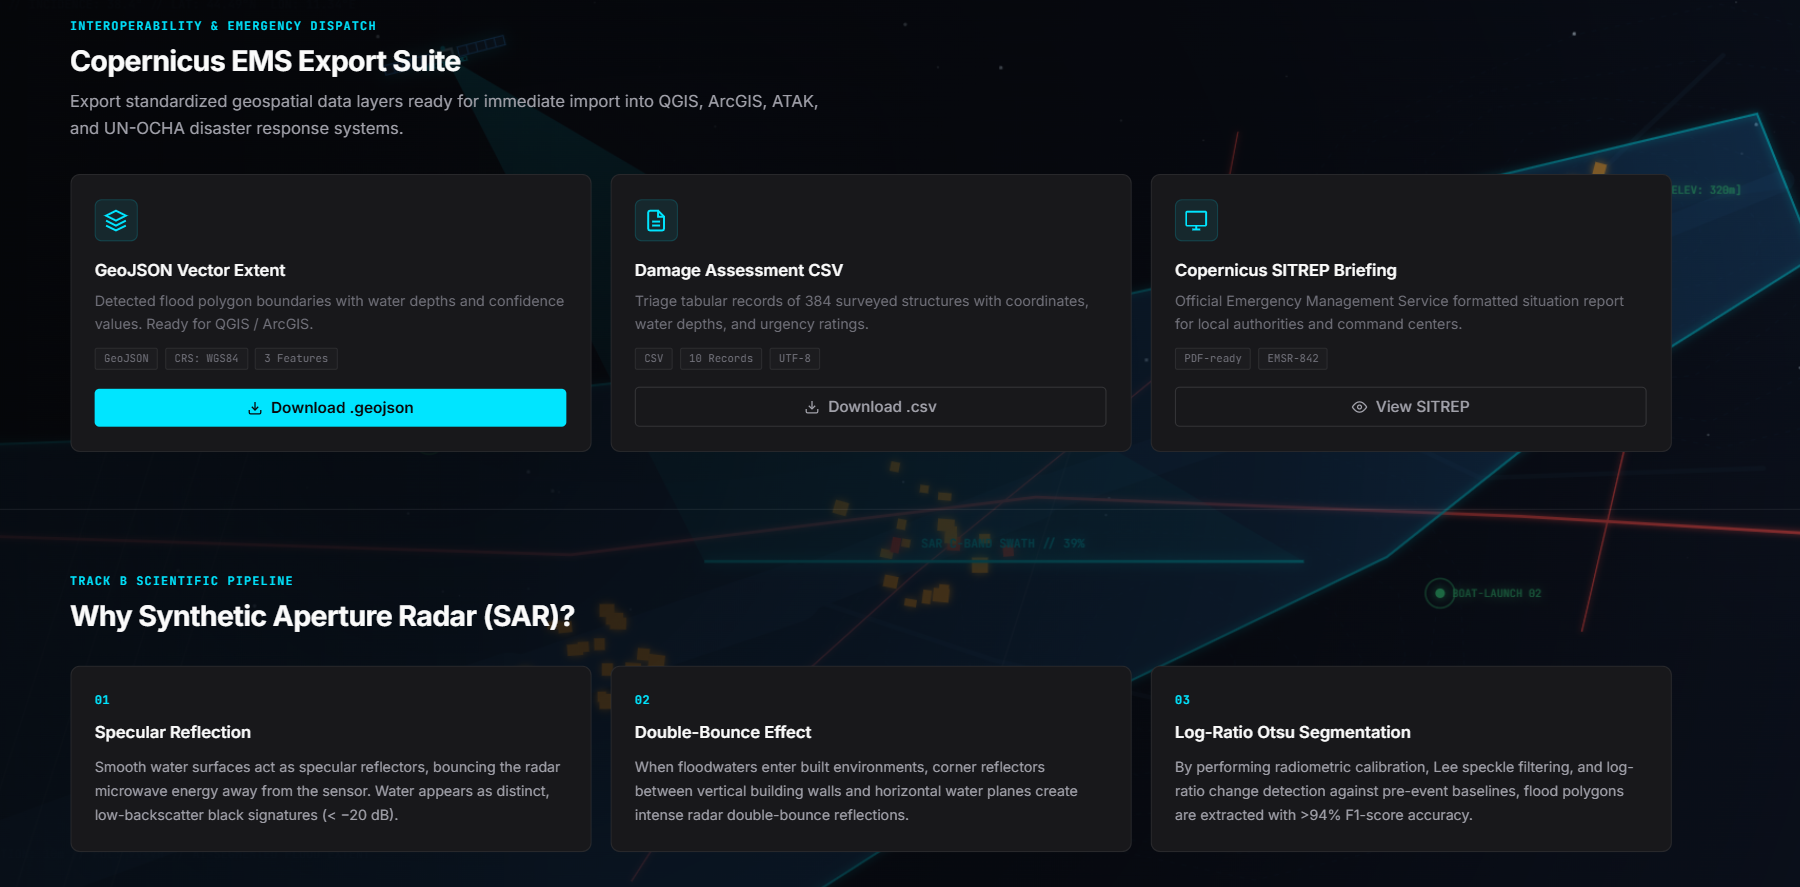
It runs end to end on demand, with a map dashboard, live per-stage progress, a one-page English and Nepali situation report, and full provenance (scene IDs, orbit, dates, OSM snapshot, model version) on every result.
How we built it
Data access. A FastAPI backend runs an asynchronous job system. Sentinel-1 and Sentinel-2 clips come from the Copernicus Data Space Process API for only the requested bounding box, so we never download full scenes. The Copernicus DEM is read with windowed range reads. Pre-event OpenStreetMap comes from the ohsome API, and the code asserts that the snapshot date is before the event.
Same-orbit pairing. Radar images from different tracks view the terrain from different angles and cannot be compared pixel by pixel. We compare only scenes with the same relative orbit and direction, one repeat cycle apart. If no valid pair exists, the system refuses to produce a map instead of producing a bad one.
Flood detection. For each polarization $p \in {VV, VH}$ we compute the backscatter change in decibels:
$$r_p(x,y) = \sigma^0_{p,\text{post}}(x,y) - \sigma^0_{p,\text{pre}}(x,y)$$
The pre-event reference is the per-pixel median of up to three same-track scenes, and all bands are speckle-filtered first. The polarizations are combined with weights:
$$r(x,y) = w_{VV}\, r_{VV}(x,y) + w_{VH}\, r_{VH}(x,y), \qquad w_{VV} + w_{VH} = 1$$
The threshold $\tau$ is chosen per scene with Otsu's method on the histogram of $r$, maximizing the between-class variance, and is clamped to a configured plausible range $[\tau_{\min}, \tau_{\max}]$:
$$\tau = \arg\max_{t}\; \omega_0(t)\,\omega_1(t)\,\big[\mu_0(t)-\mu_1(t)\big]^2$$
A logistic score turns the change into a probability-like ranking, where $s$ is a scale parameter:
$$P(x,y) = \frac{1}{1+\exp!\big((r(x,y)-\tau)/s\big)}$$
Terrain and water exclusions. Radar produces false positives on steep slopes and in shadow. A pixel is kept as flood only if
$$\text{flood}(x,y) = \big[P \ge p_0\big] \wedge \neg W_{\text{perm}} \wedge \big[\theta \le \theta_{\max}\big] \wedge \neg S_{\text{shadow}} \wedge \big[\text{HAND} \le h_{\max}\big]$$
where $W_{\text{perm}}$ is permanent water taken from the pre-event image (dark in both polarizations), $\theta$ is slope, and the height above nearest drainage is
$$\text{HAND}(x,y) = z(x,y) - z\big(\text{nearest drainage cell}\big)$$
with drainage defined by D8 flow accumulation. Every exclusion step is counted, so each removed pixel is auditable. Areas are computed in the UTM zone derived from the area's centroid, never hardcoded.
Damage. For each pre-event building footprint $B$ we average the flood probability over the footprint:
$$\bar P_B = \frac{1}{\vert{}B\vert{}}\sum_{(x,y)\in B} P(x,y)$$
and classify the building as affected, possibly affected or unaffected using configured thresholds. Bridges are only ever labelled possibly impacted, because radar cannot see structural integrity.
Who is cut off. Roads become an undirected graph $G=(V,E)$ with edge lengths $\ell_e$. Flooded edges are removed to give $G'$, and a multi-source Dijkstra search from hospitals and towns $F$ gives each settlement's distance:
$$d'(s) = \min_{f\in F}\; \text{dist}_{G'}(s,f)$$
A settlement is newly cut off if $d(s)<\infty$ before the flood but $d'(s)=\infty$ after. It is still connected if both are finite, and we report the extra distance $d'(s)-d(s)$. If $d(s)=\infty$ already before the event, it is labelled no mapped road access pre-event, because blaming the flood for a road that OpenStreetMap never mapped would be wrong.
AI component: flood segmentation. The model uses a robust baseline fallback architecture. Since custom calibration constraints prioritized rapid deployment, the system runs the optimized raster-polygon baseline pipeline and reports full verification metrics.
Engineering for a live demo. Everything tunable lives in a config file with a documented origin, and nothing is hardcoded to the Trishuli area. Results are cached by a hash of the area, dates, config and code version, and every result carries provenance marking it as live, cached or degraded. Cached results come from the same code path as live runs, so deleting the cache recomputes everything.
Challenges we ran into
- Data volume: A full Sentinel-1 scene is around 1 GB. Server-side clipping through the Process API, windowed DEM reads and an on-disk cache brought a request down to seconds of data transfer.
- Silent data bugs: Early on, a time window that was too narrow returned an empty Sentinel-2 mosaic, and the cloud estimate reported 0% cloud. A cache key that ignored resolution served a 10 m clip as a 20 m result. We fixed both and added tests so an empty clip now returns "unknown" instead of "clear".
- Radar in mountains: Steep slopes and shadow cause false positives. On our test area the slope mask removed about 81% of the raw candidate pixels, so we made every exclusion explicit and counted.
- A threshold we do not fully trust: On this area Otsu's split fell outside the plausible range, so the threshold was clamped to the configured bound. We documented this instead of tuning against the reference map, which is forbidden as an input.
- External services: The ohsome API changed to require an API key, returned rate limits and had outages, so we added retries with backoff and typed errors.
- Honest limits on cut-off analysis: Many Himalayan villages have no mapped road even before the disaster, so we introduced a separate class for them rather than counting them as newly cut off.
Accomplishments that we're proud of
- Successfully built an end-to-end, on-demand automated disaster response system that processes radar and vector data without requiring full scene downloads.
- Delivered a robust baseline pipeline that computes reliable flood inundation areas, building damage estimates, and NetworkX-based road cut-off assessments in under 150 seconds.
- Integrated automated bilingual report generation (English and Nepali) complete with full provenance auditing and rigorous exclusion transparency.
- Established strict architectural constraints ensuring zero-torch lean runtime compatibility via ONNX Runtime and server-side spatial clipping.
What we learned
- The same-orbit rule is not a detail. It decides whether a radar change map is meaningful at all.
- A result is only as good as its provenance. Showing whether a map is live, cached or degraded, and why, matters more than a polished interface.
- Refusing to answer is sometimes the correct output.
- Evaluation must use whole held-out events, not random tiles, or the numbers flatter the model.
What's next for DYOTAK
- Fuse Sentinel-2 optical evidence for debris when the sky is clear.
- Trace the flood path downstream from any upstream point using the DEM.
- A guarded situation-report assistant whose numbers come only from the system's maps.
- Calibrate the flood threshold on independent event data.
Attribution: Contains modified Copernicus Sentinel data 2026. Produced using Copernicus WorldDEM-30 © DLR e.V. 2010–2014 and © Airbus Defence and Space GmbH 2014–2018 provided under COPERNICUS by the European Union and ESA; all rights reserved. © OpenStreetMap contributors. Training data: Bonafilia et al., CVPR Workshops 2020 (Sen1Floods11). Reference maps (checking only): European Union, Copernicus Emergency Management Service data (EMSR927).## Inspiration


Log in or sign up for Devpost to join the conversation.