-
-
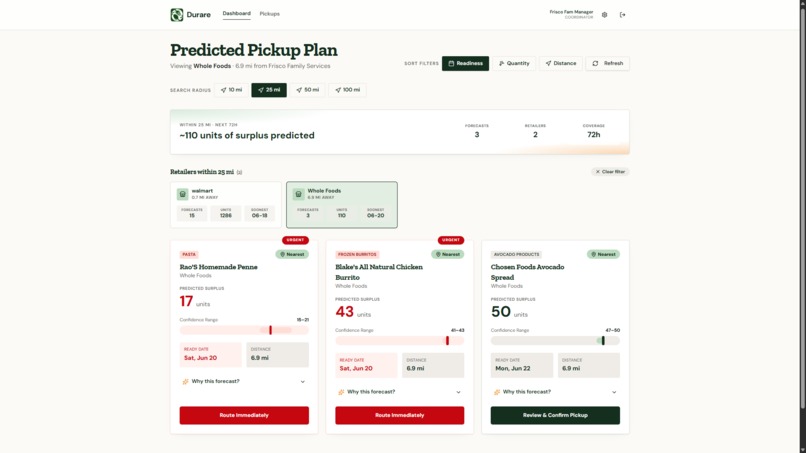
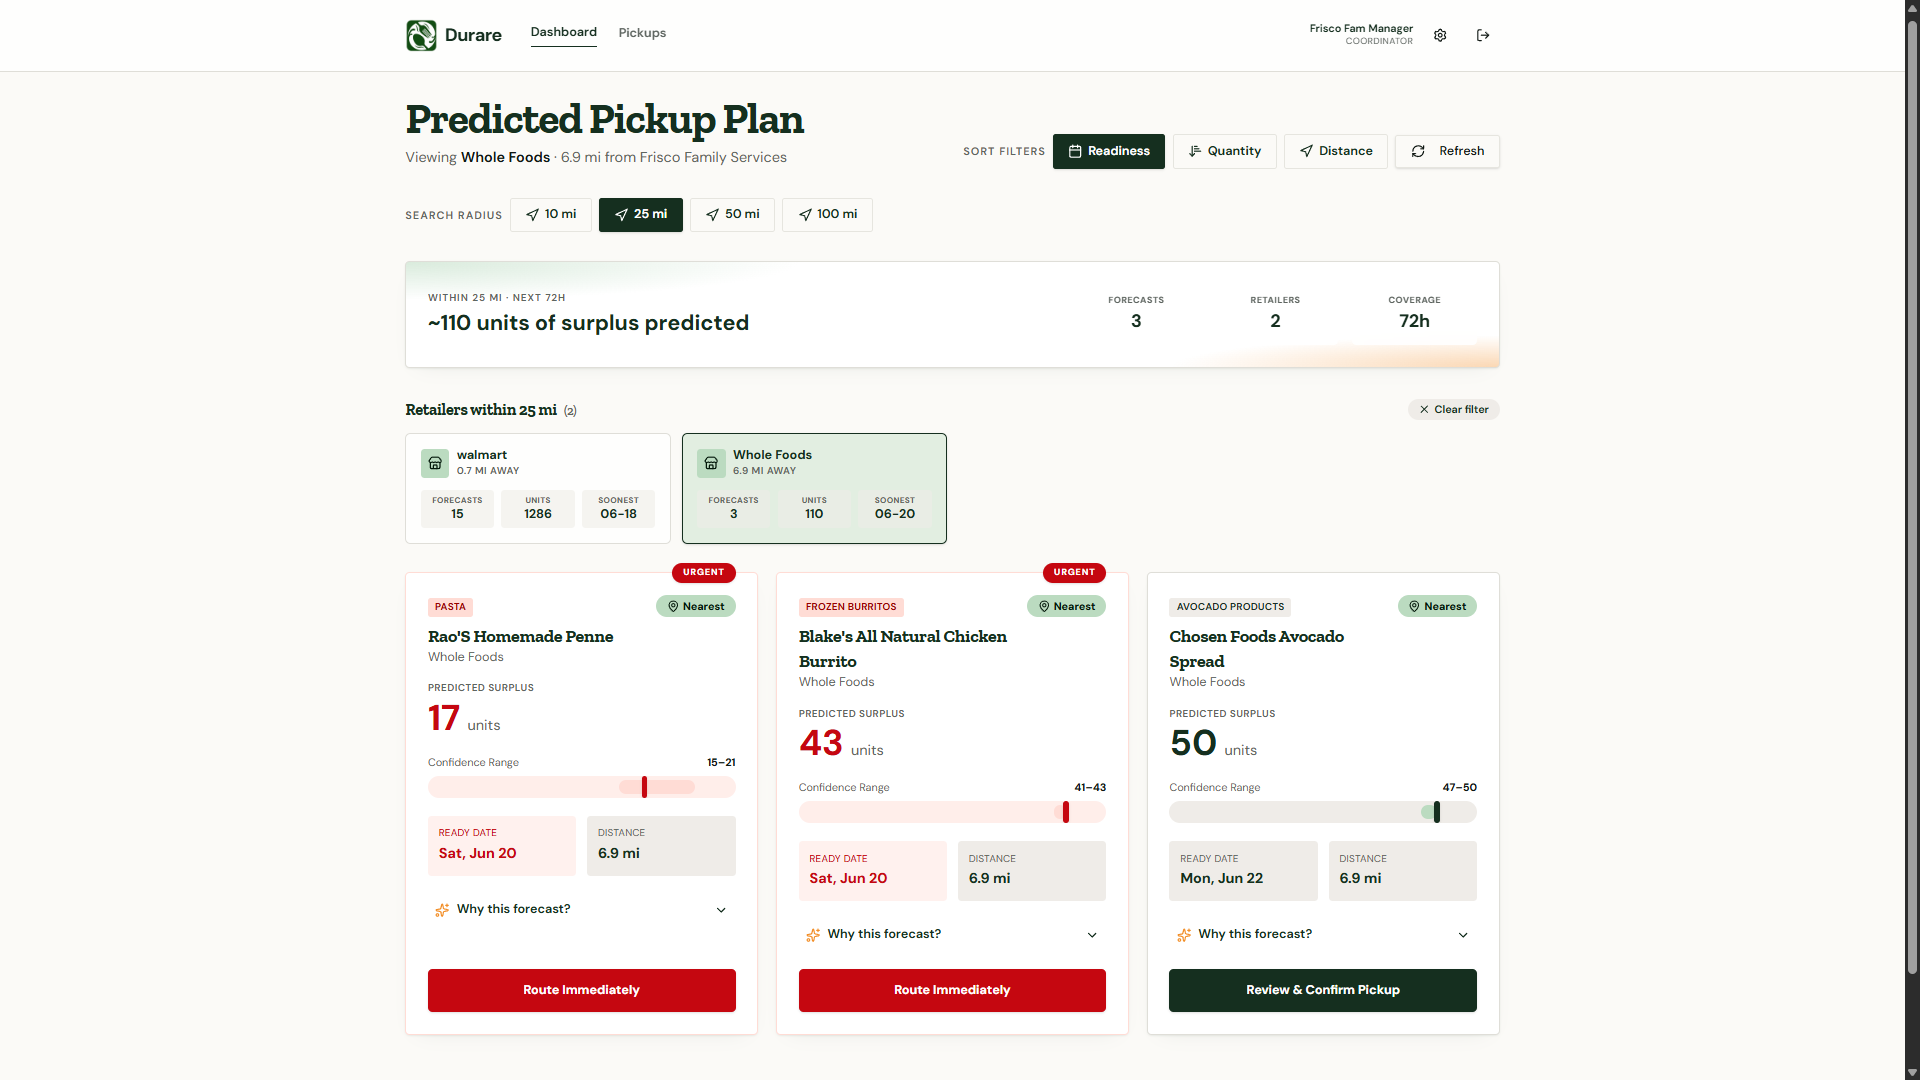
Food Bank Pick Up Prediction
-
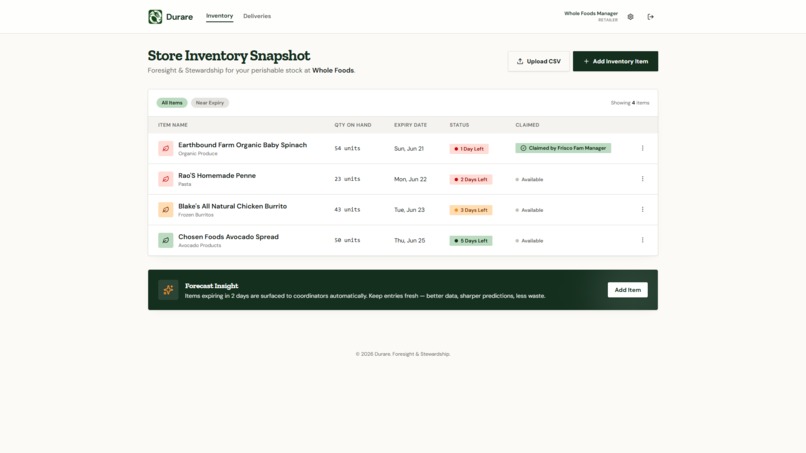
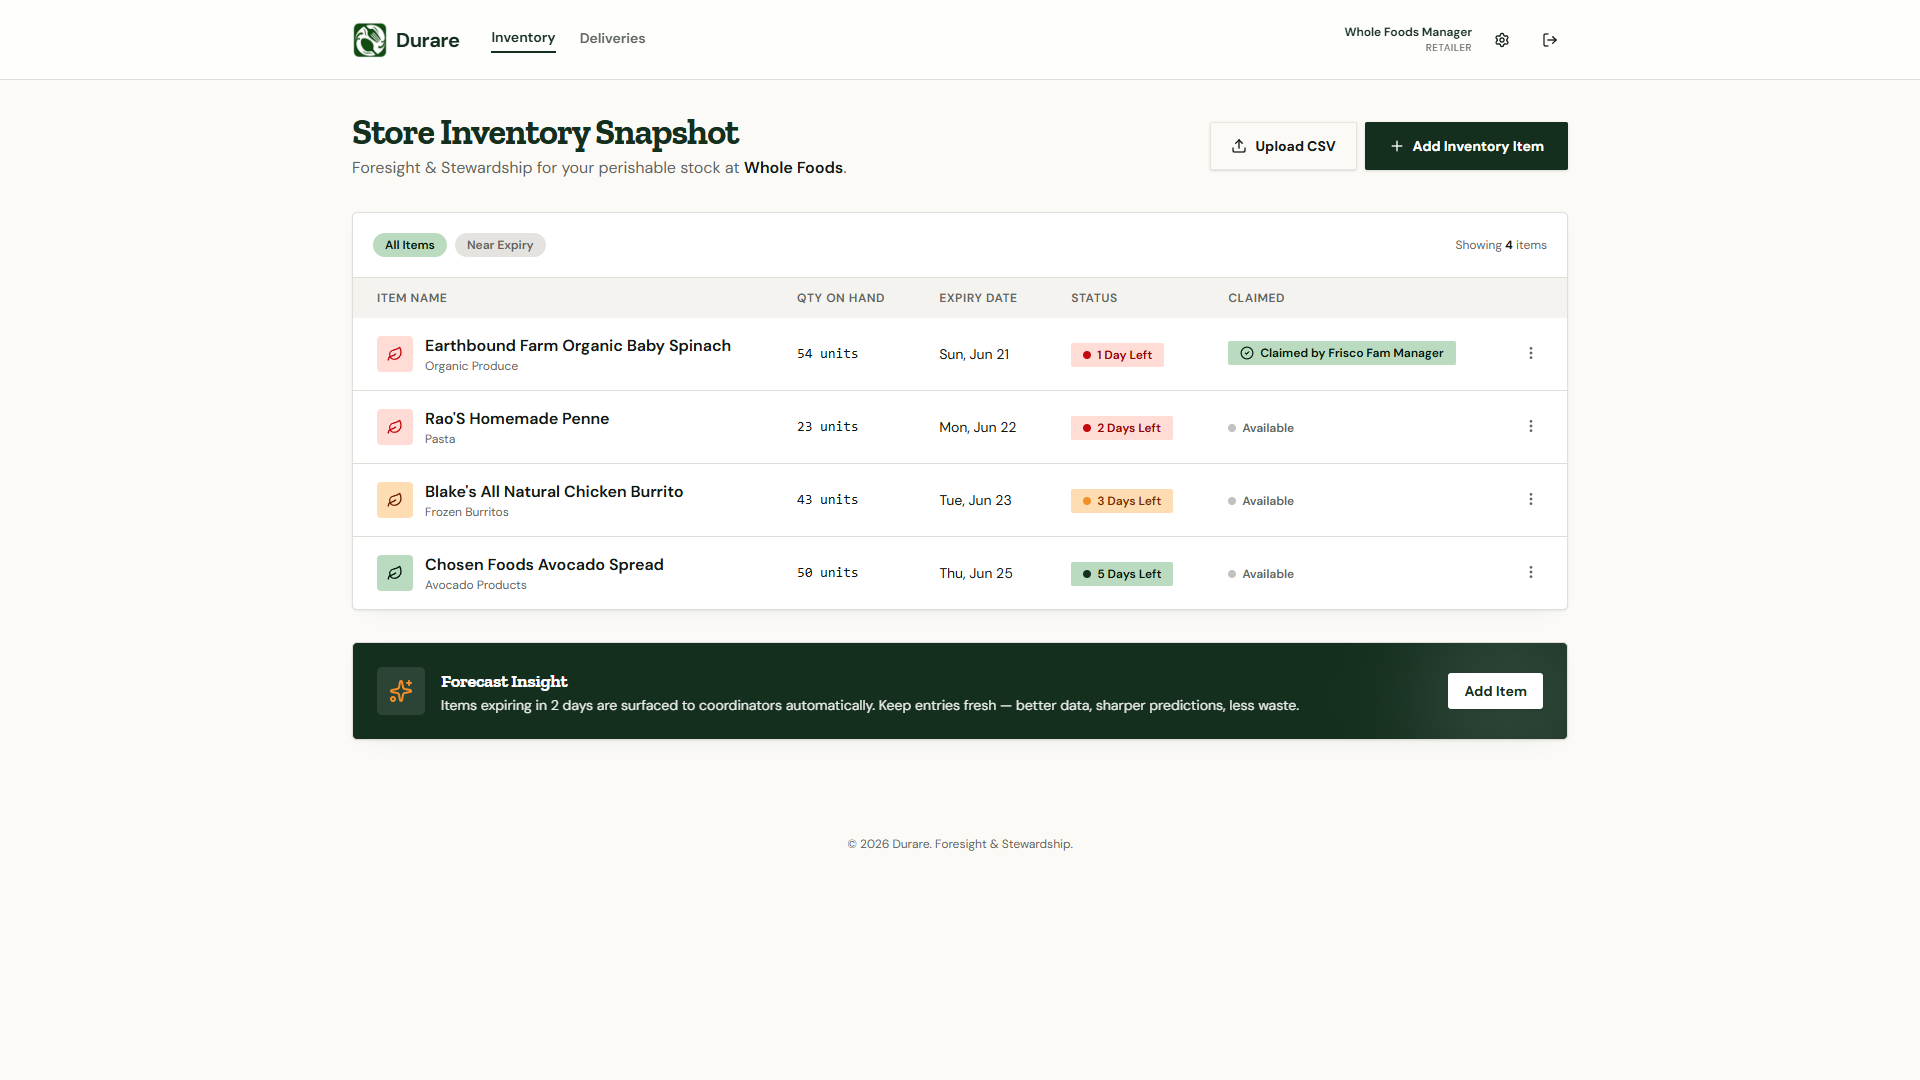
Retailer Inventory Page
-
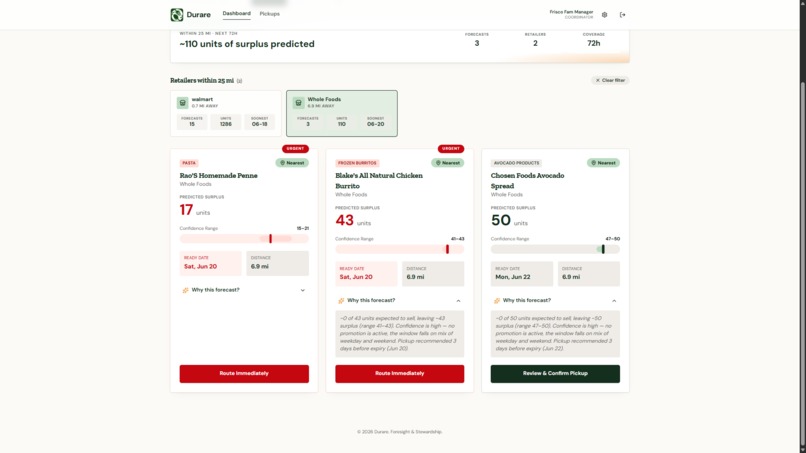
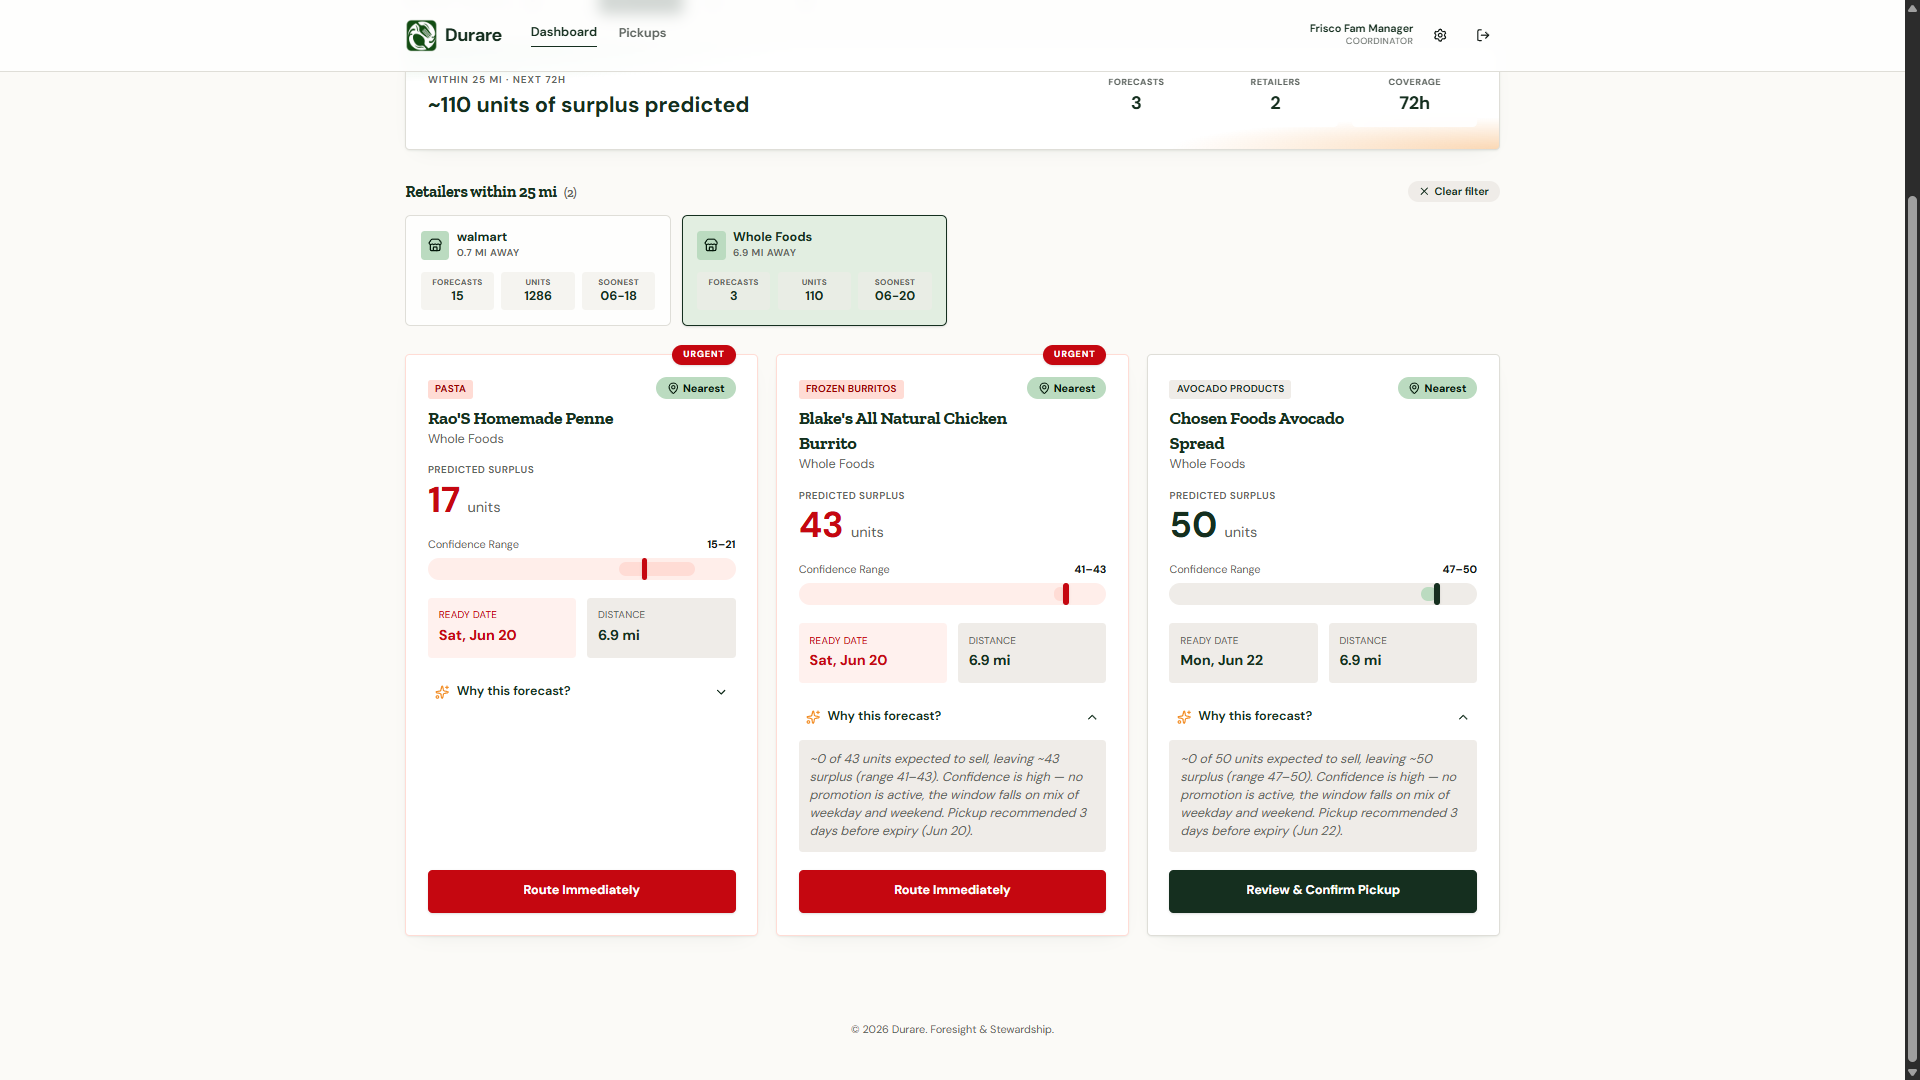
Coordinator Pick Up Predictions + Reasonings
-
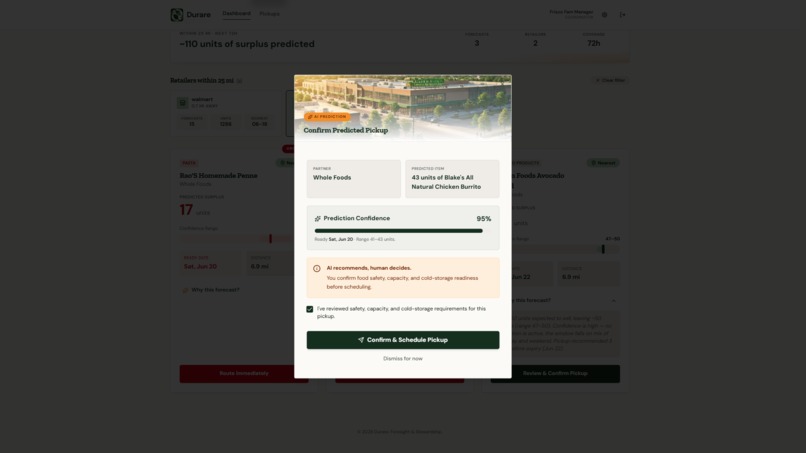
Coordinator Pick Ups Page
-
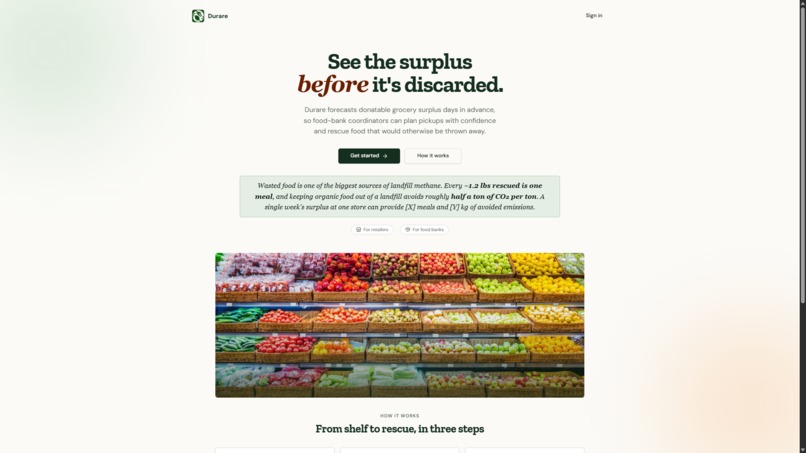
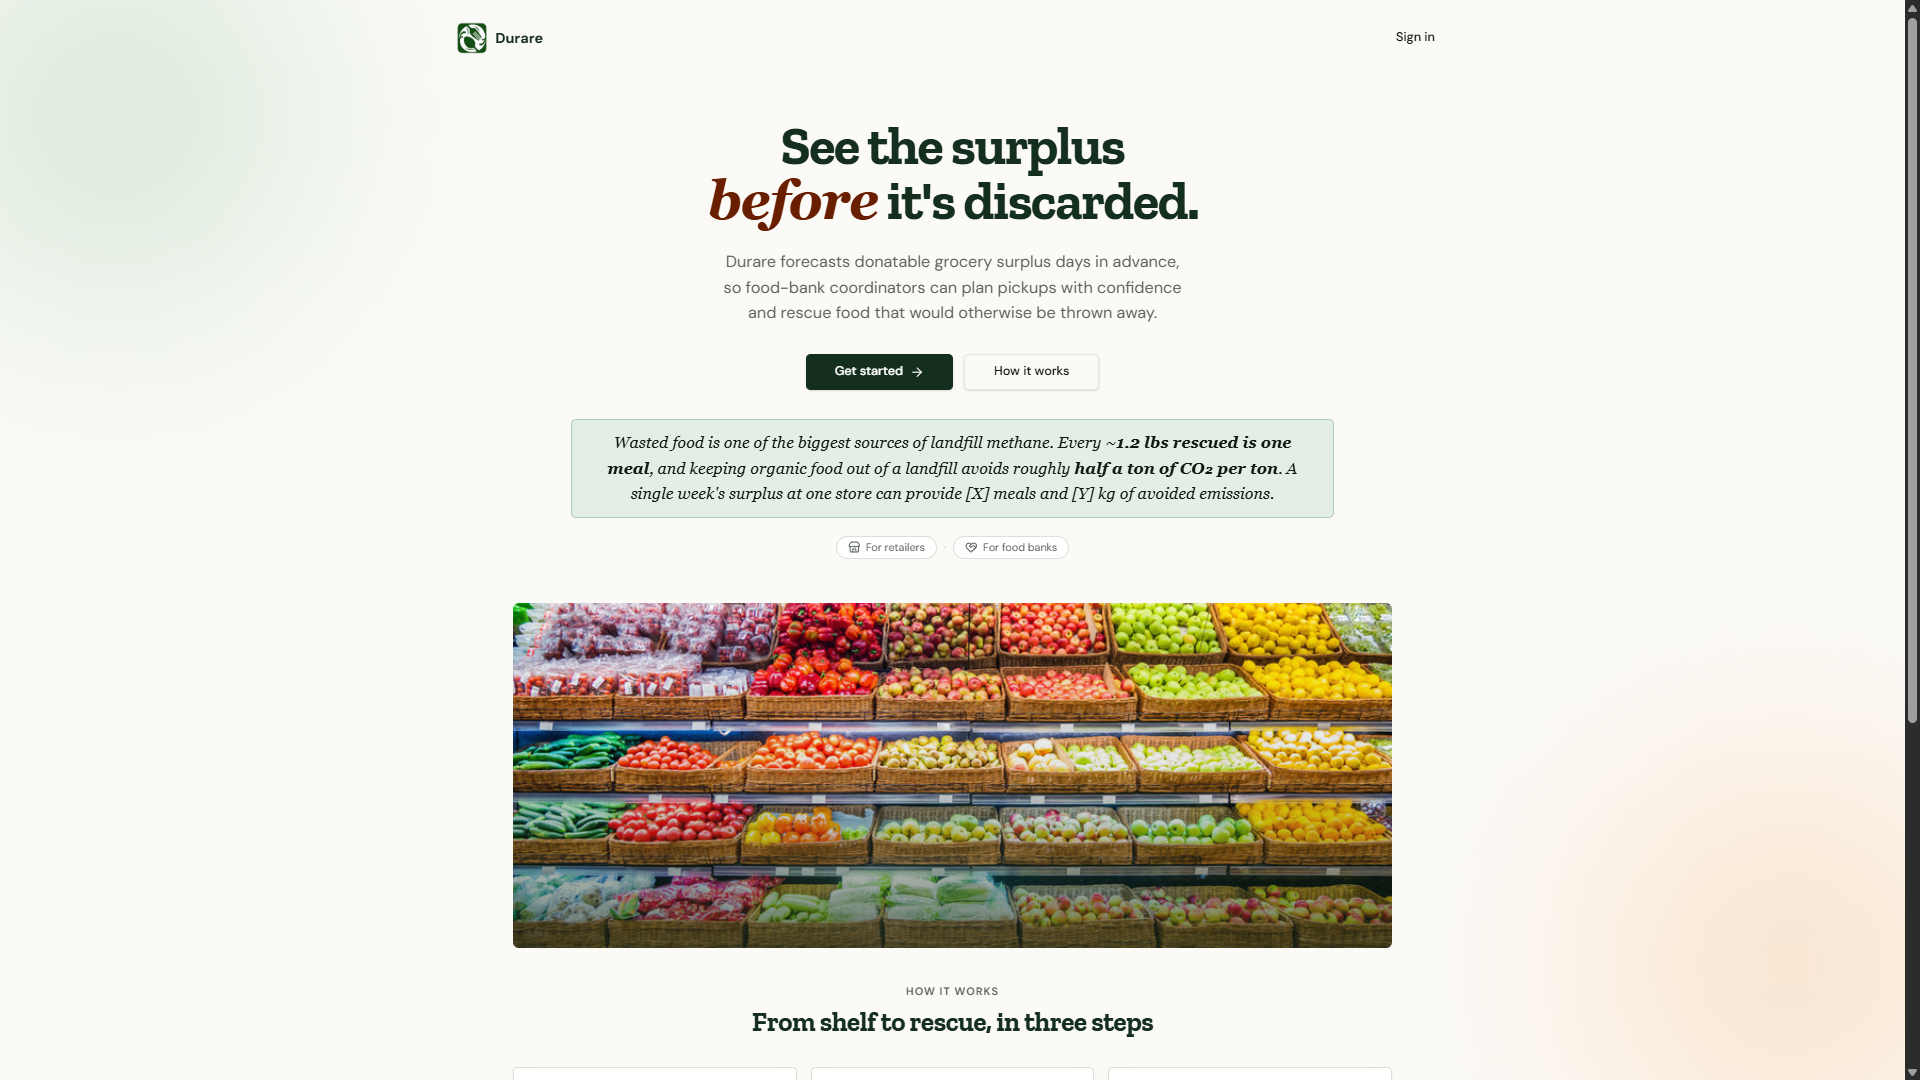
Landing Page
-
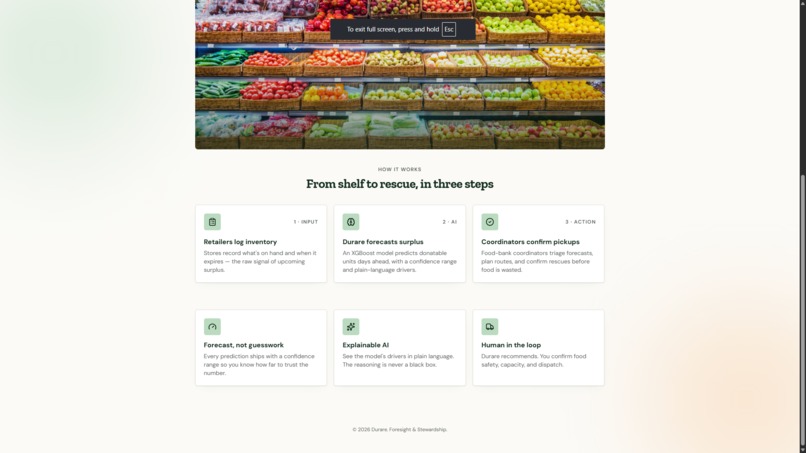
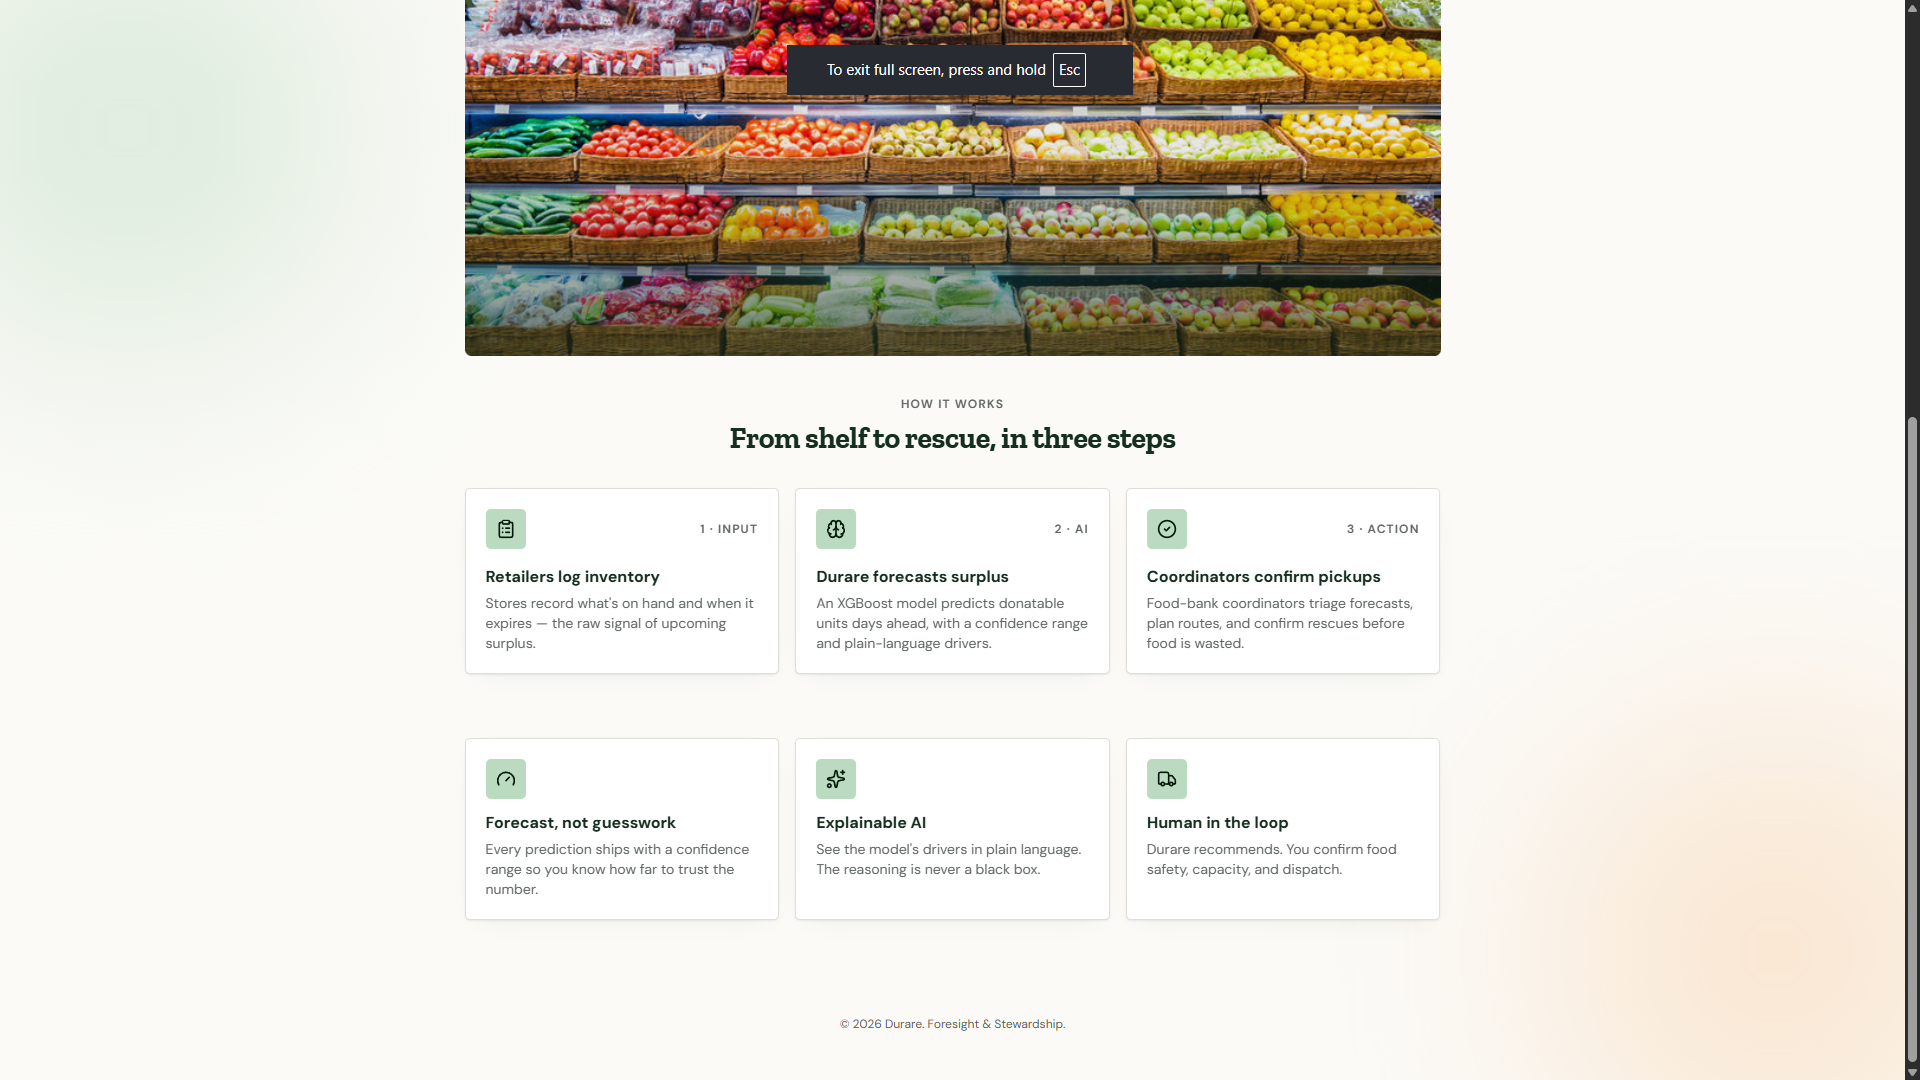
How It Works Landing Page Simple Explanation
-

Sign In Page
-
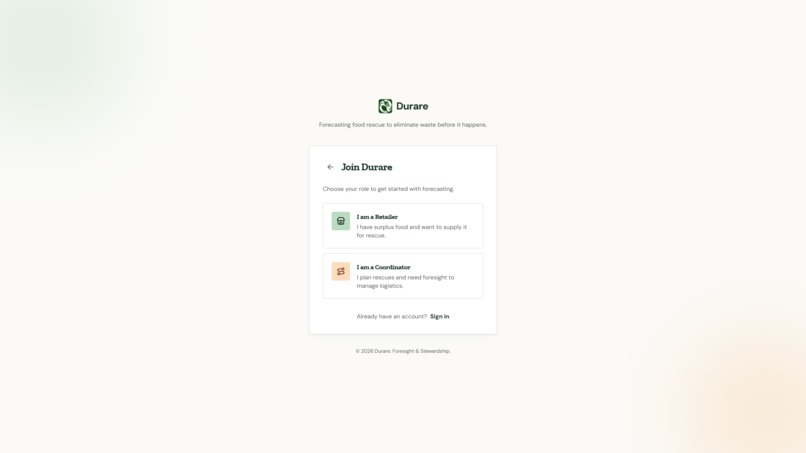
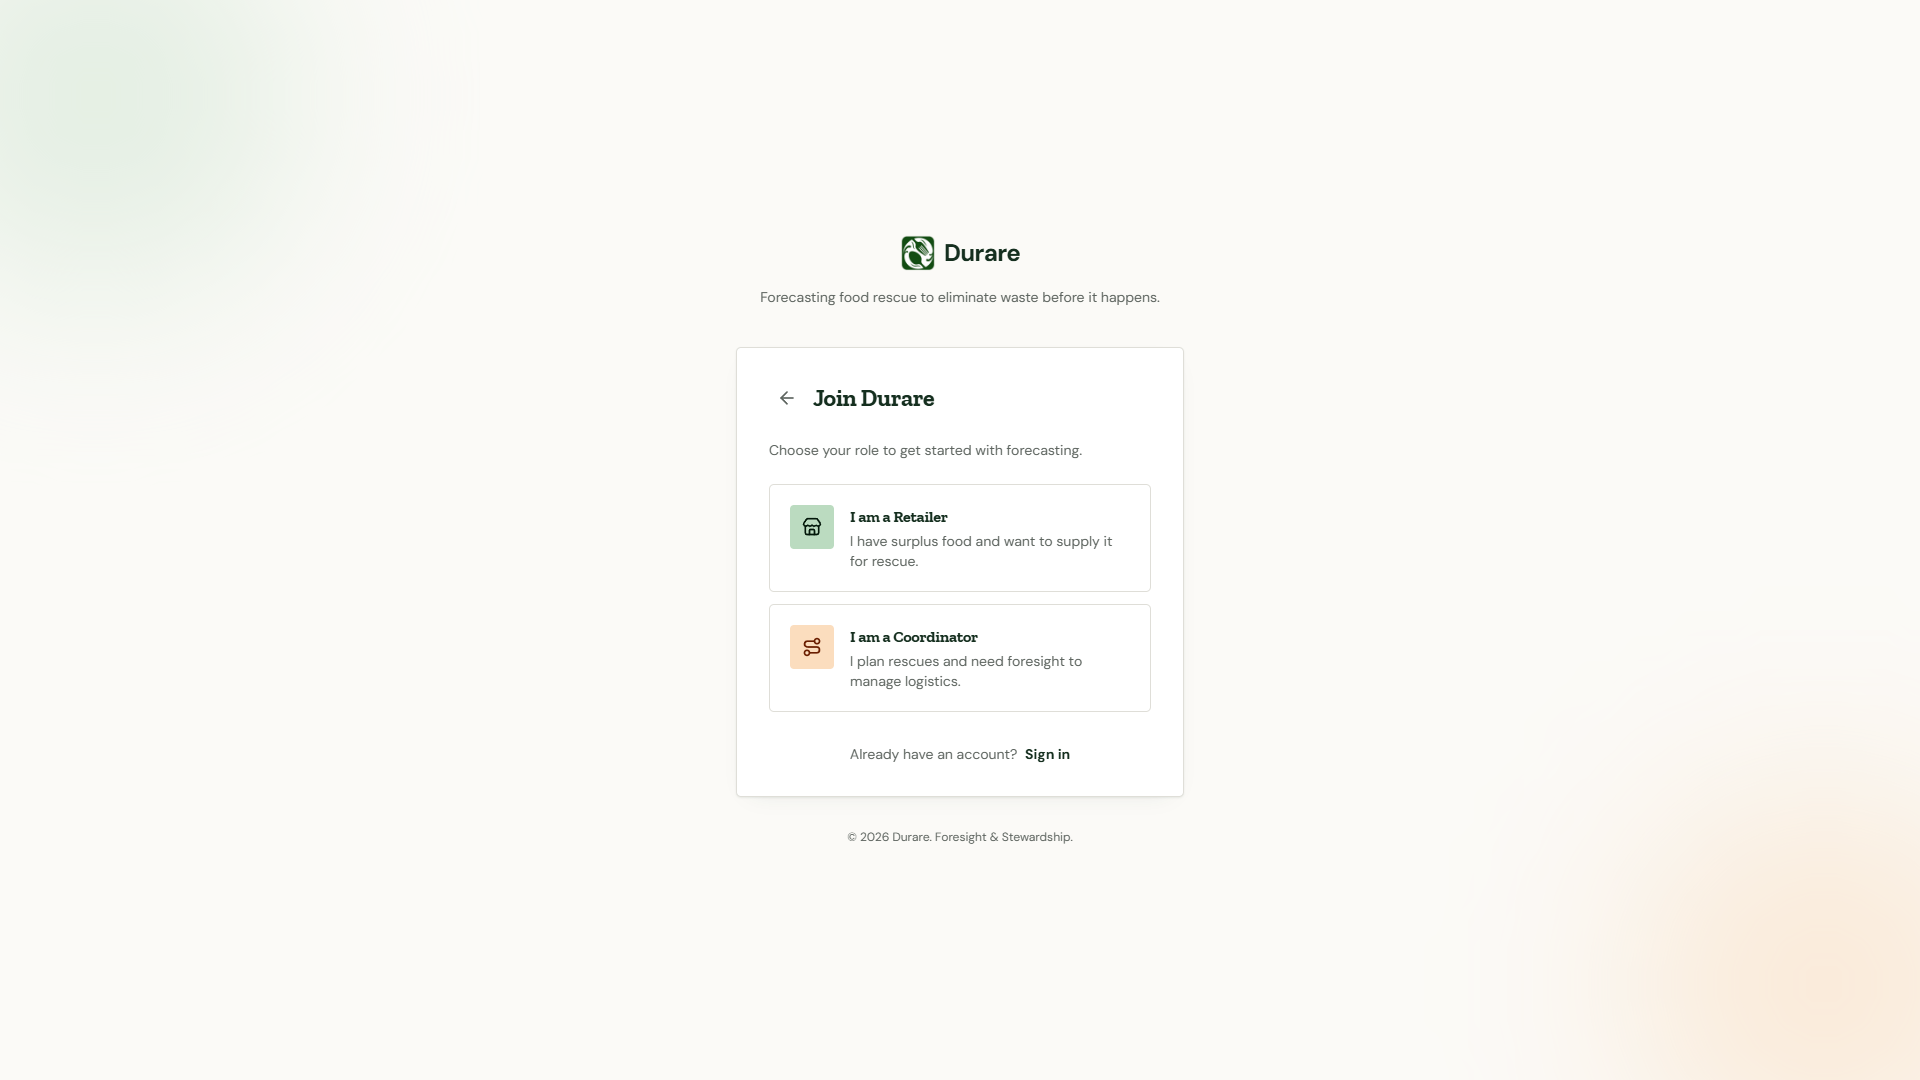
Sign-Up Page
-
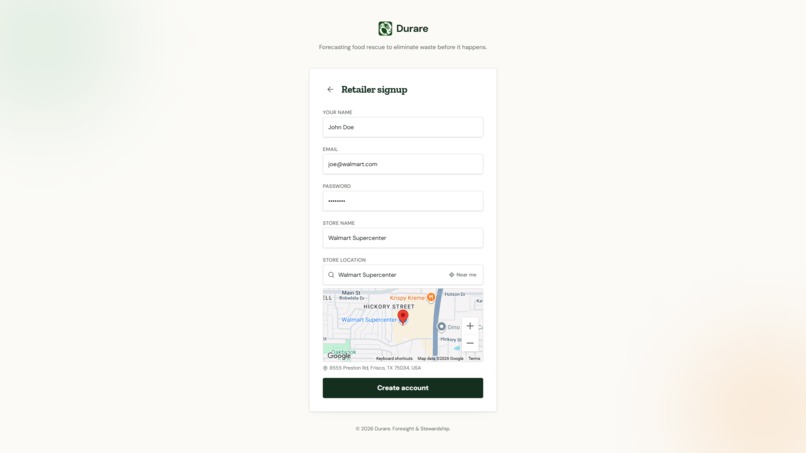
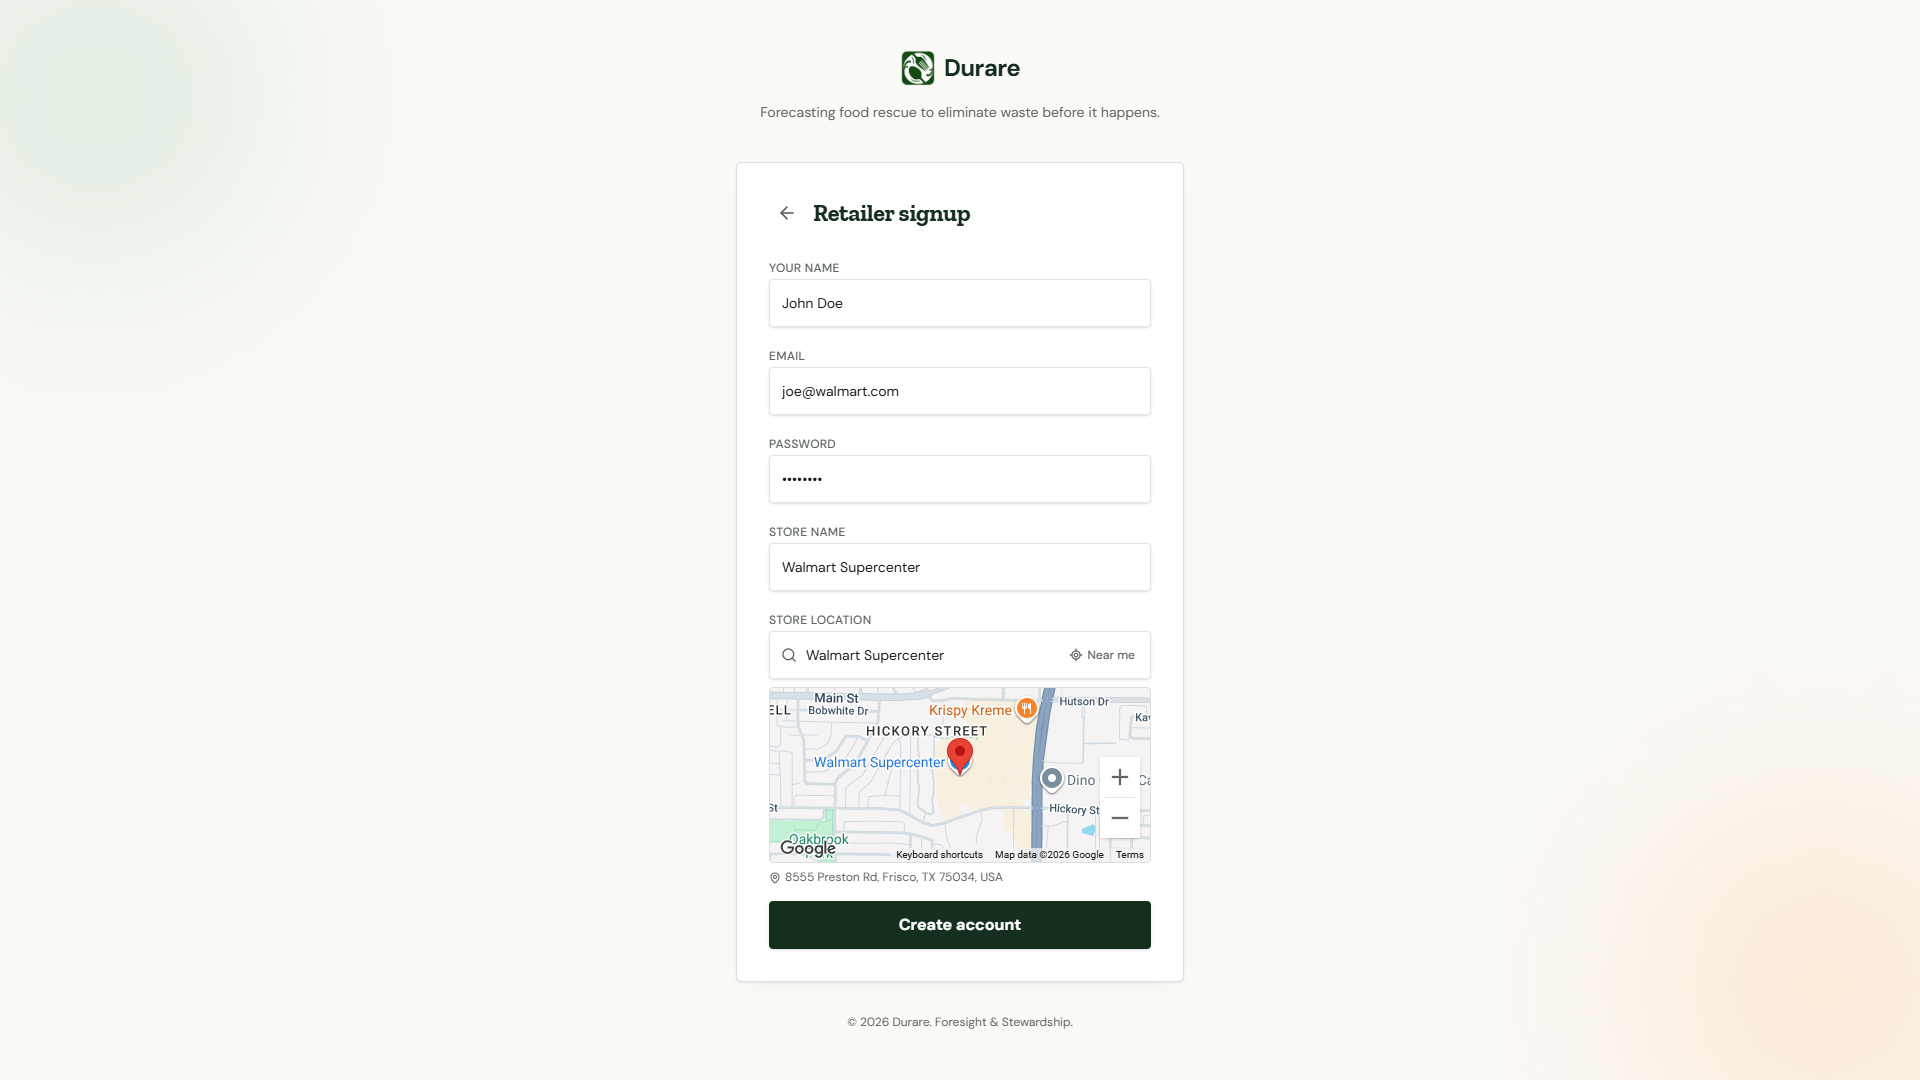
Retailer Sign Up
-
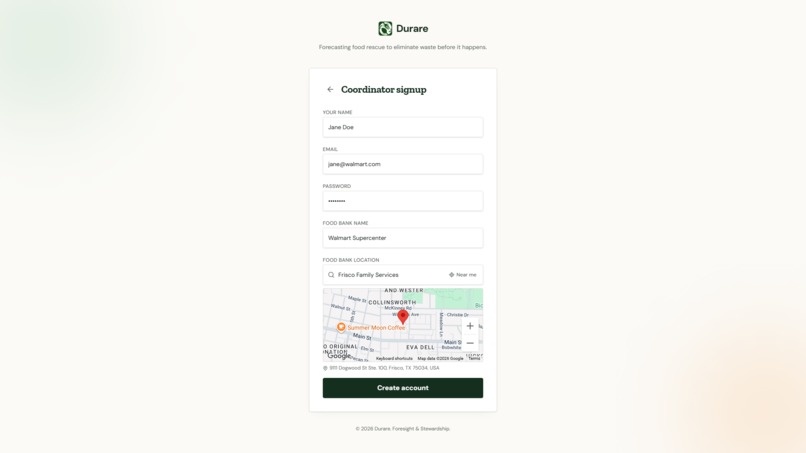
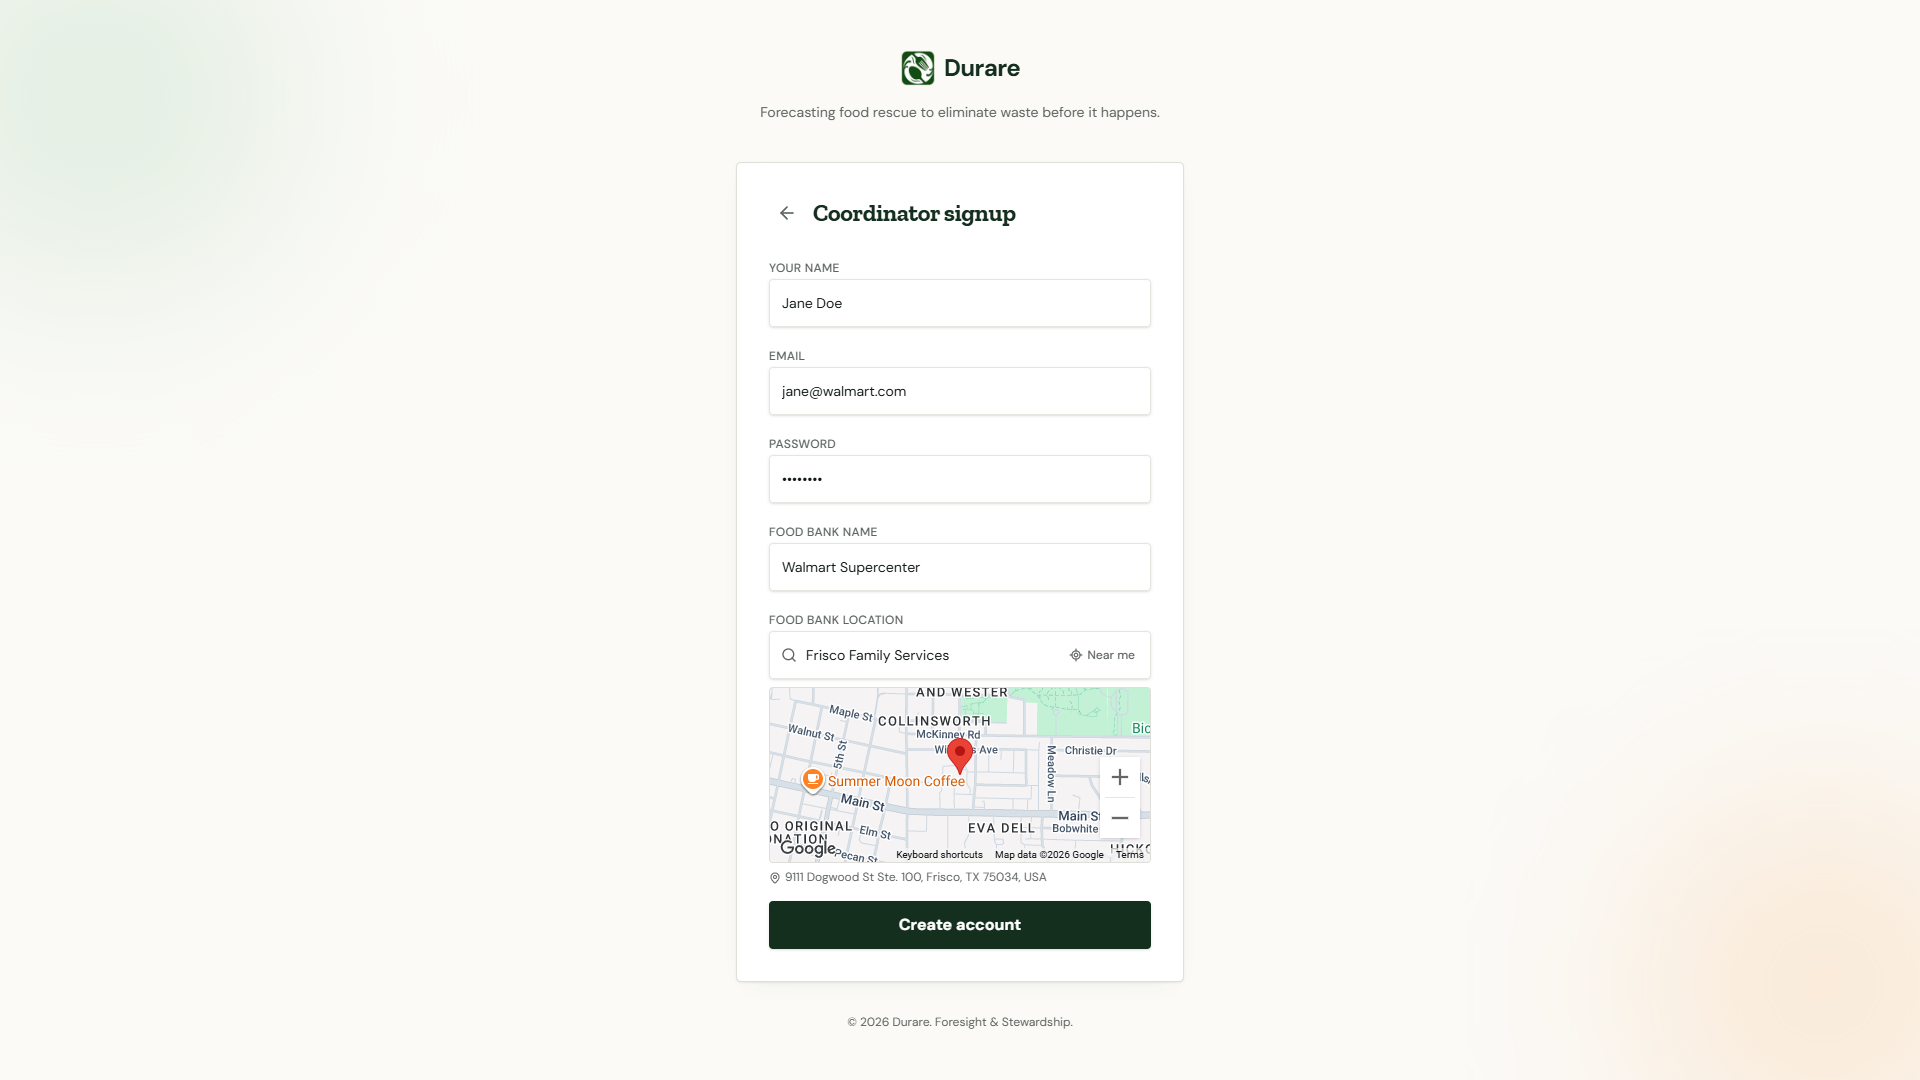
Coordinator Signup
-
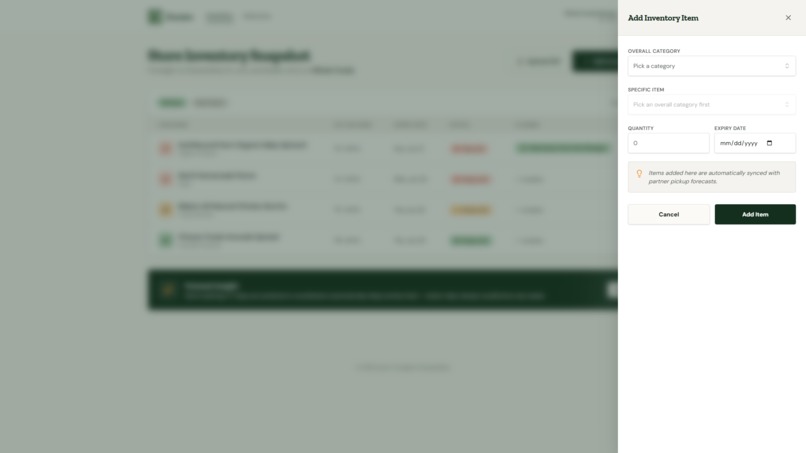
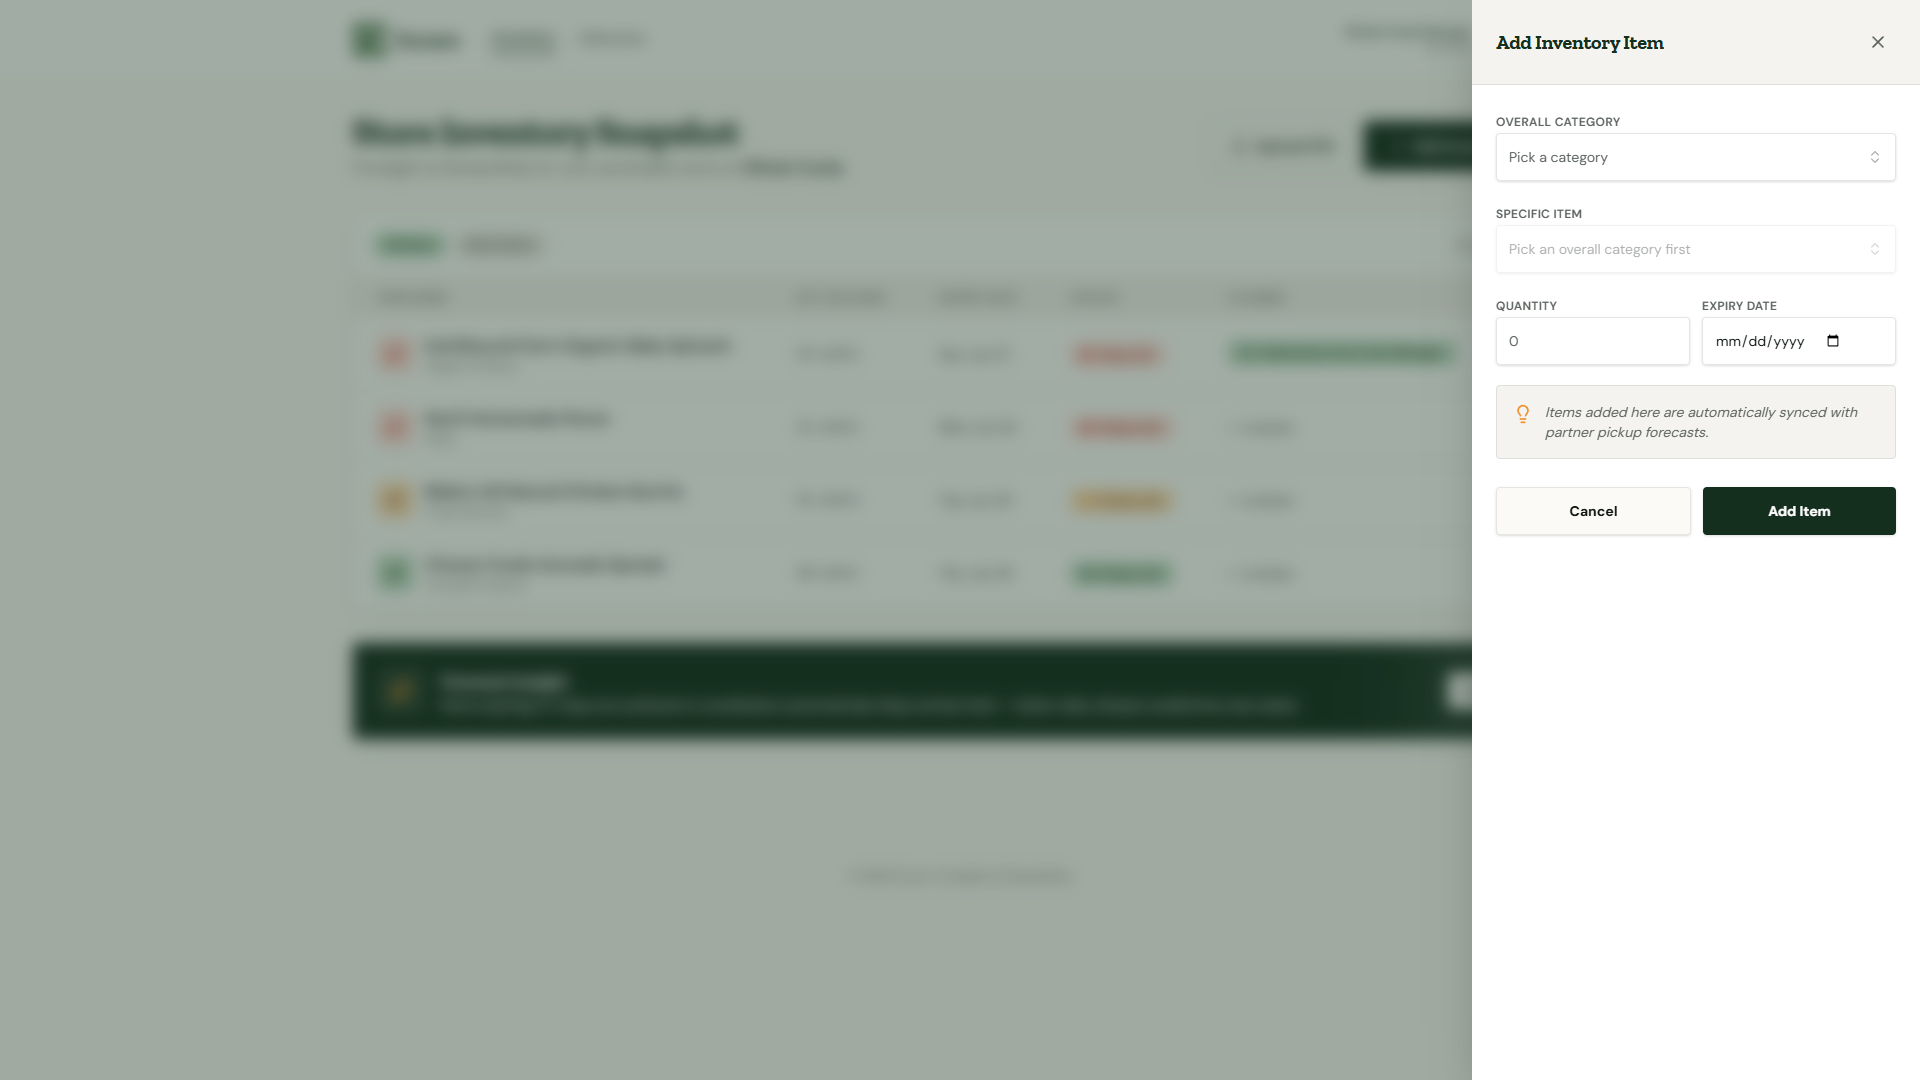
Retailer Add Inventory Item
-
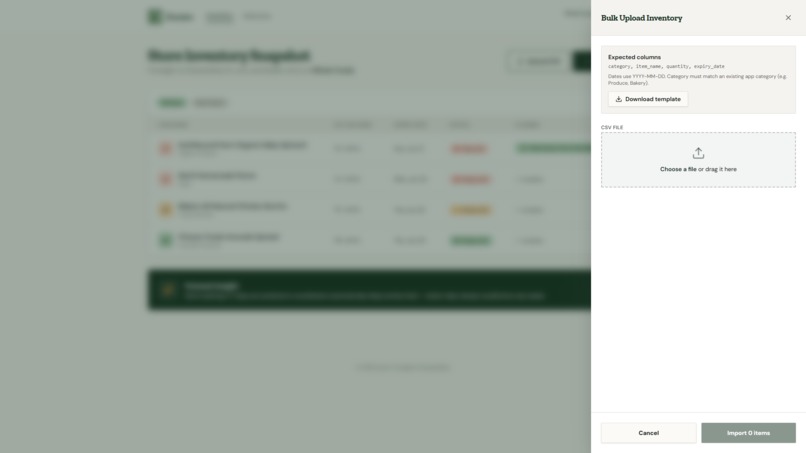
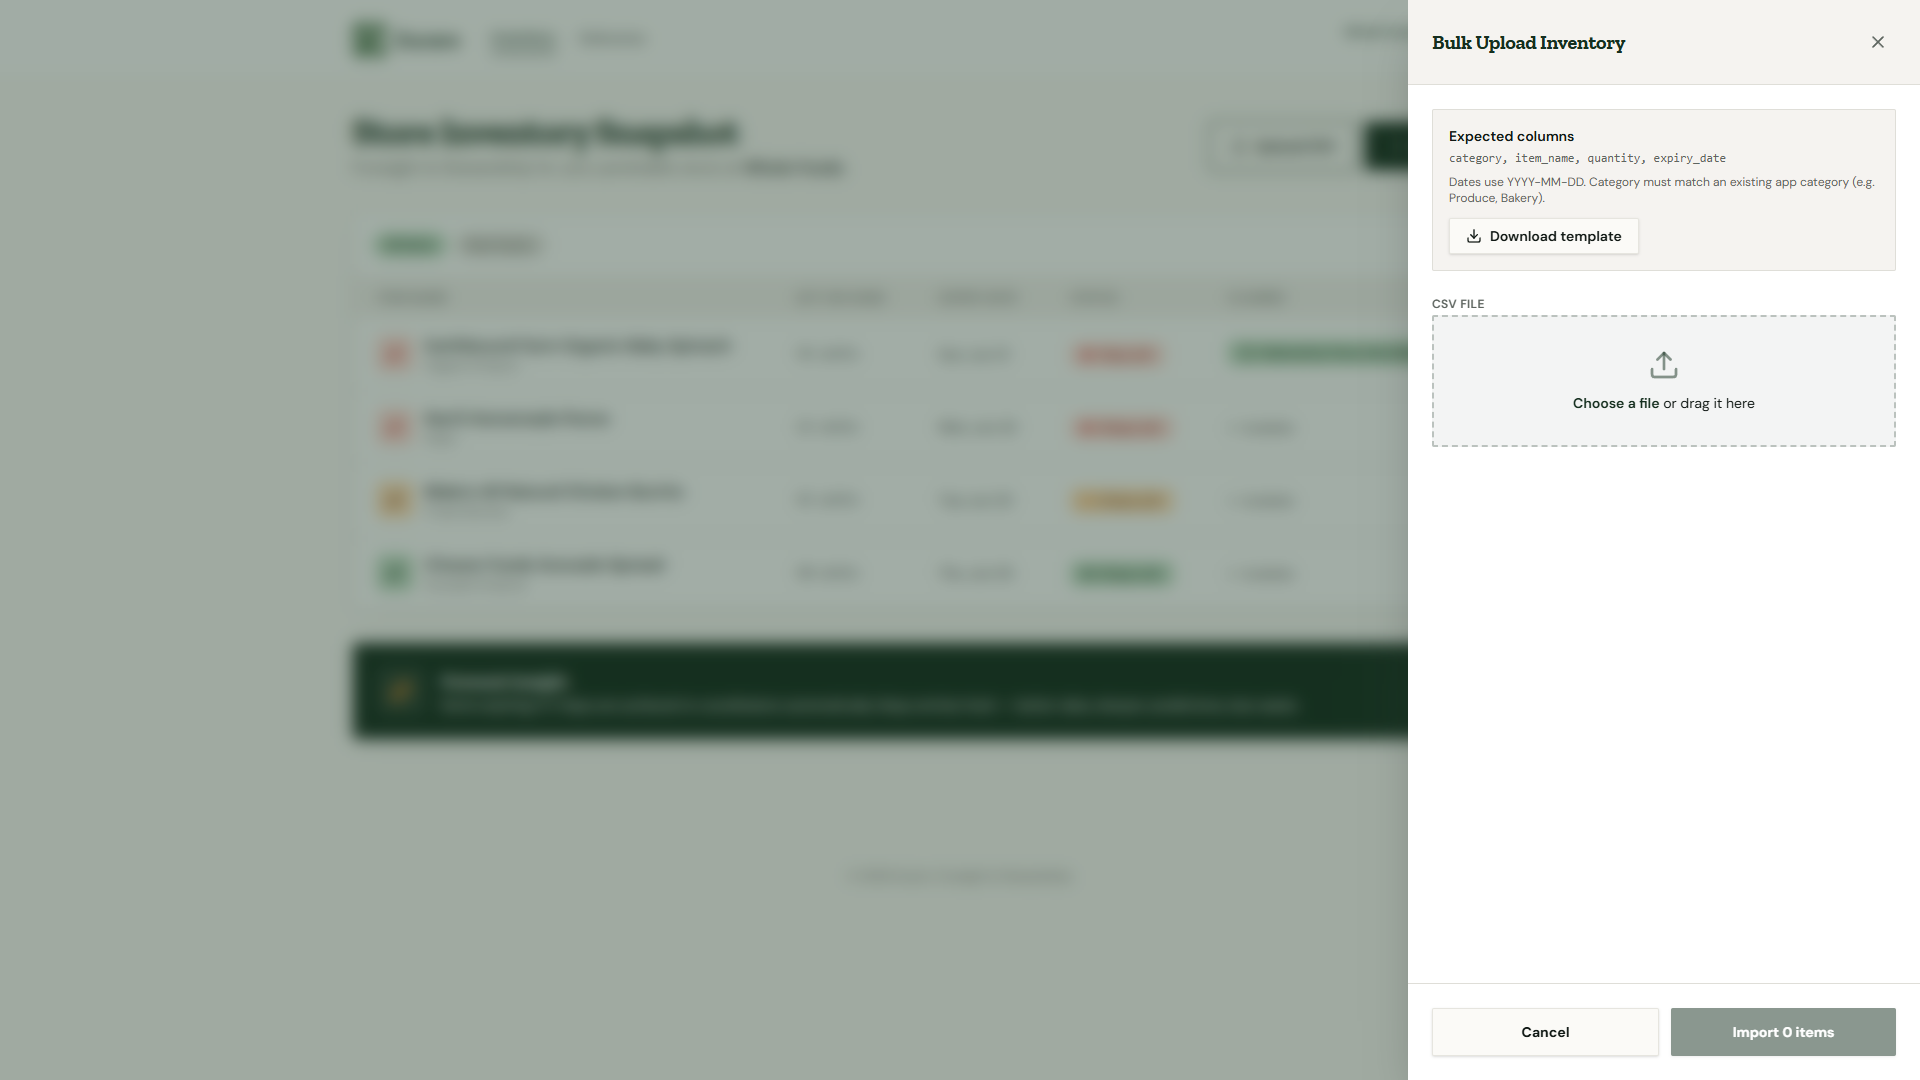
Retailer CSV Bulk Upload
-
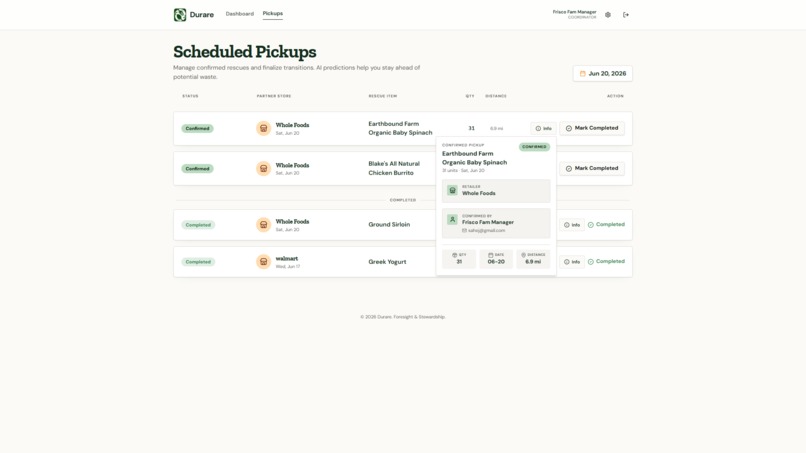
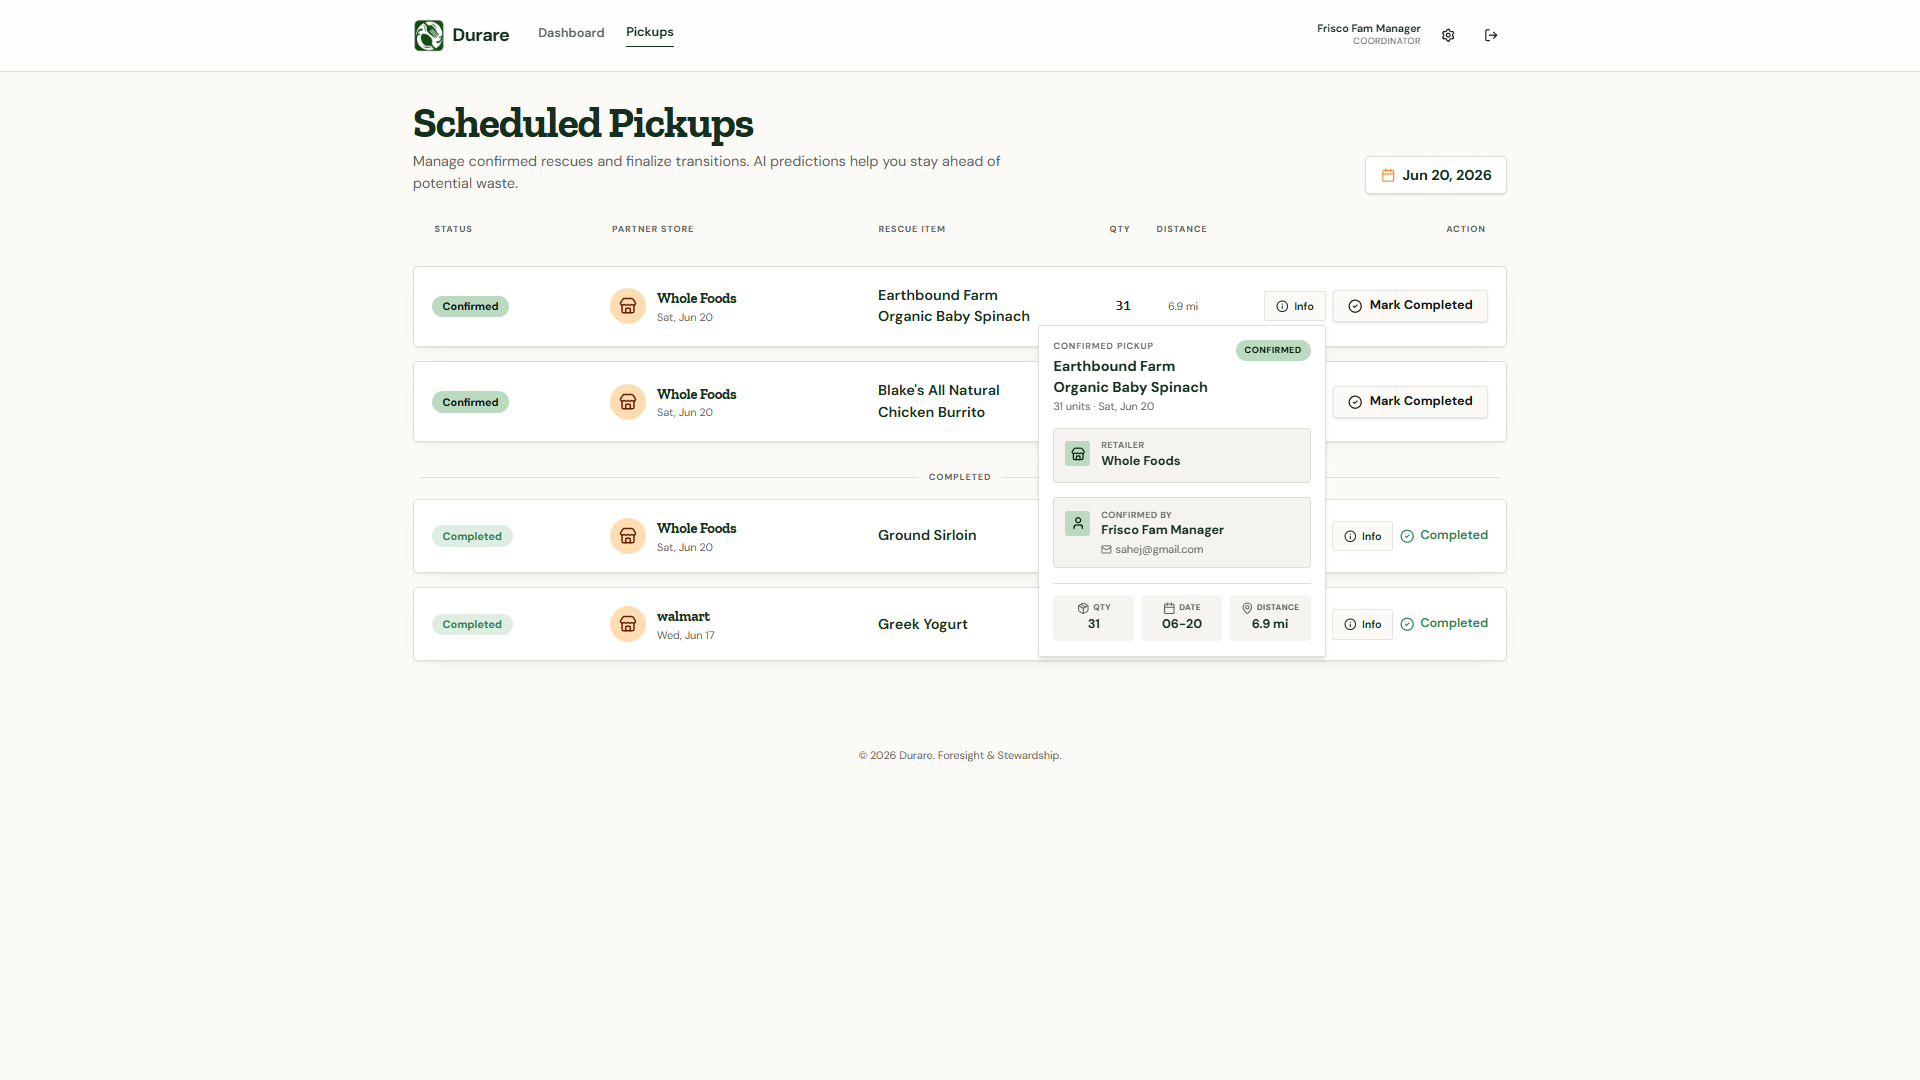
Coordinator Pick Ups Page

Inspiration
Roughly a third of all food produced is never eaten (wri.org), and grocery retail is a major source of edible food going to waste. When that food reaches a landfill, it doesn't just disappear. It rots and releases methane, a greenhouse gas far more potent than CO2 in the near term. That makes food waste one of the most fixable climate problems there is, since every pound rescued is both a meal delivered and emissions avoided. By the standard conversion, every ~1.2 lbs rescued is one meal, and keeping organic food out of a landfill avoids roughly half a ton of CO2 per ton. So, a single week's surplus at one store can be as simple as [X] meals provided and [Y] kg of emissions avoided.
We didn't have to look far to see it. In our own community of Frisco, Texas, stores like Walmart and Whole Foods discard perishables every single day, while just a few miles away, Frisco Family Services, a local food bank with trucks, cold storage, and volunteers, has everything needed to rescue that food. The missing piece is the foresight and collaboration to make change.
Durare's core insight: food waste is predictable. A crate of strawberries expiring Friday is a forecastable event, yet retailers discard it with no coordination for the families it could benefit, and its environmental detriment. We wanted to shift that conversation forward in time, giving coordinators advance visibility into incoming surplus so they can plan, act, and redirect food before it's wasted.
What it does
Durare is a two-sided web app that connects grocery retailers with local food banks and forecasts donatable surplus before it's thrown away.
On the supply side, retailers (in our demo, our local Walmart and Whole Foods) log their perishable inventory (item, quantity, and expiry date) manually or by CSV upload for mass inventory logging. On the receiving side, a food-bank coordinator (Frisco Family Services) sees a live, ranked feed of forecasts for the availability of foods that will likely go to waste.
The core is the prediction itself; Durare does not simply count down expiration dates. Instead, a trained model forecasts “sell-through”: for each item, how many units are likely to actually sell before they expire based on the location as well as many other factors, and therefore how much will be left over as surplus. Every forecast arrives with the four things a coordinator needs to act on:
- a predicted surplus quantity
- a confidence range: a visible low-to-high band, not a single false-precise number
- a plain-language explanation of why the model expects what it does
- a recommended pickup date plus the distance to the store for human consideration
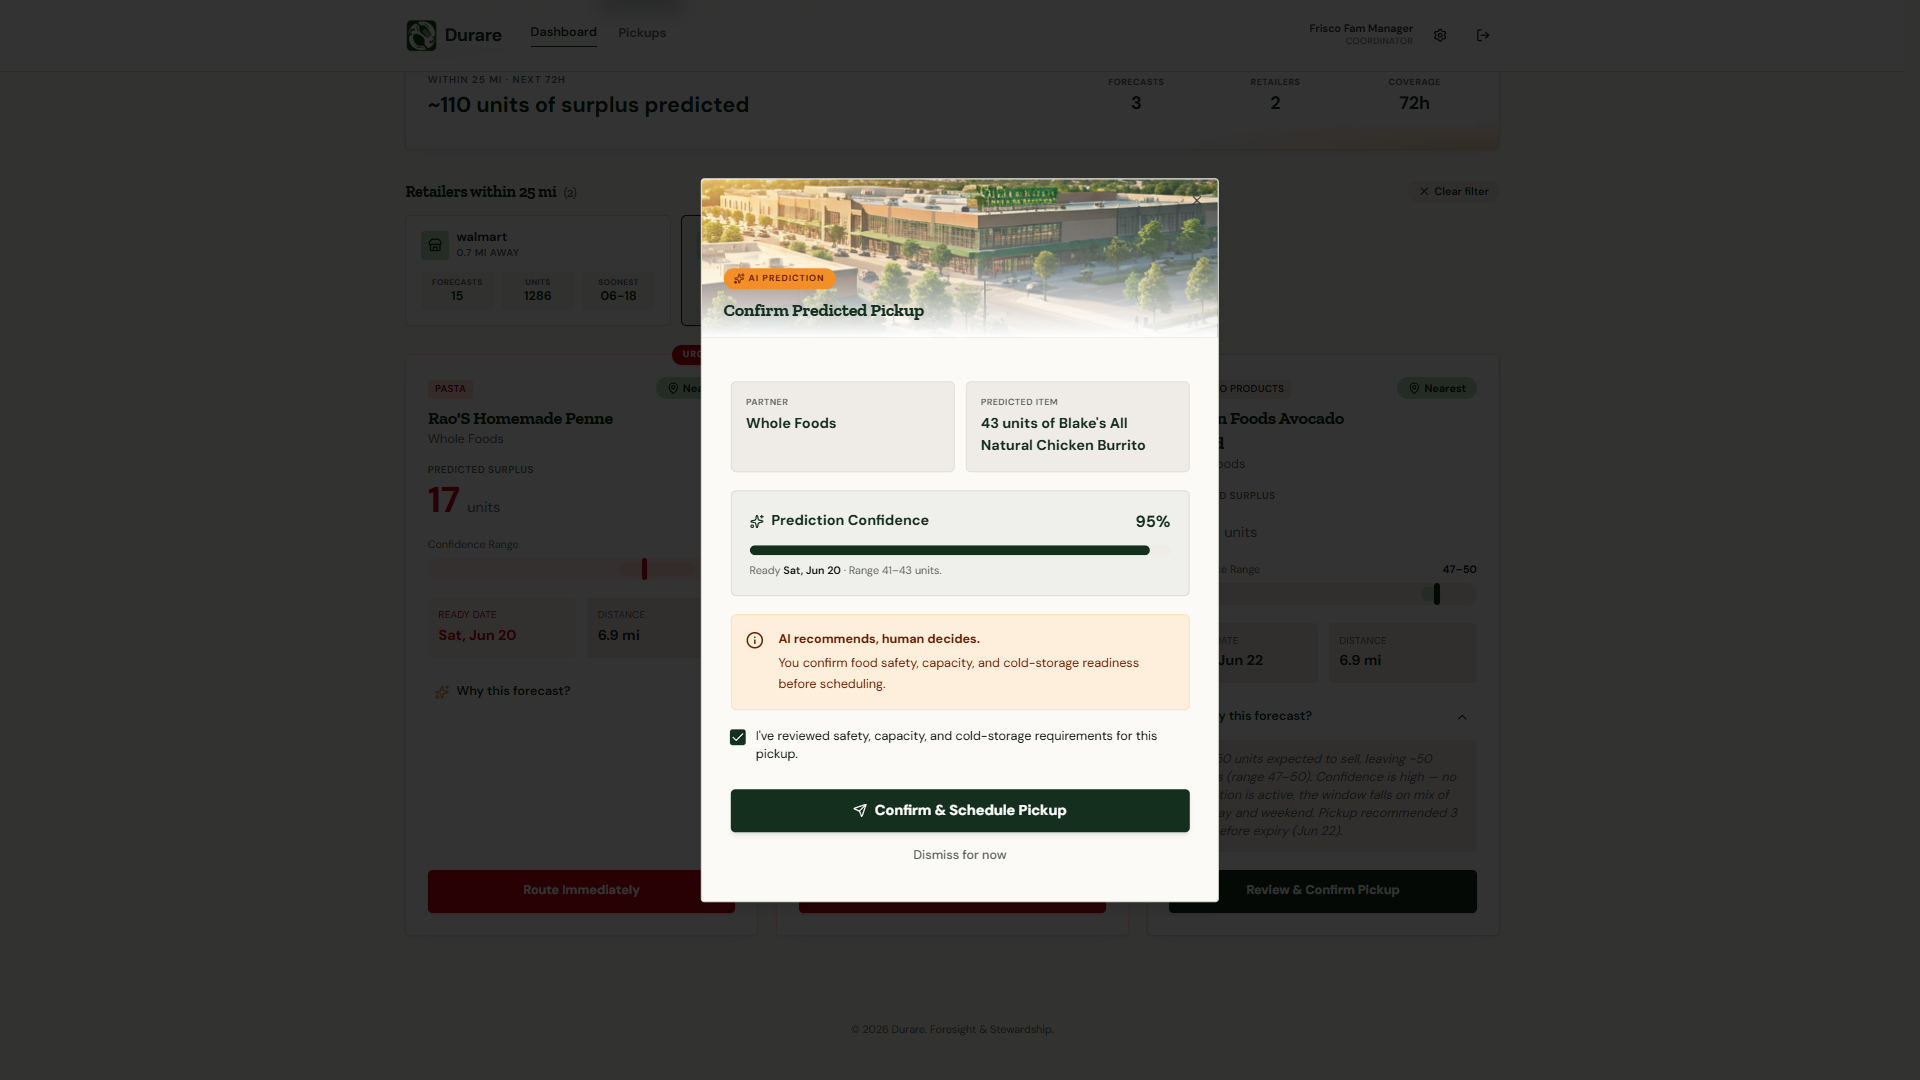
Coordinators assess these forecasts, filtering by radius, sorting by readiness, quantity, or distance, and then confirming a pickup. That confirmation is a deliberate human action and never an automatic dispatch.
The whole system follows a clear flow: inventory in → model forecasts surplus → coordinator sees ranked, explained forecasts → coordinator confirms a pickup → food gets rescued for use (Input → AI → insight → action).
How we built it
Durare is three pieces.
The interface for both retailers and coordinators is a React 19 + TanStack Start app (Vite), with file-based routing, TanStack Query for caching, and Tailwind v4 + shadcn/ui for a calm, legible design system. We scaffolded the UI in Lovable and refined it from there.
The backend is Lovable Cloud (Supabase under the hood), Postgres, Auth, and Row-Level Security (RLS) on every table, plus exactly one privileged server function, triggerModelRun, running on Cloudflare Workers (to run the model). Almost everything else happens through the browser talking directly to Postgres, kept safe by RLS.
The model is a separate FastAPI service wrapping XGBoost quantile regression, deployed independently. For each inventory row, it predicts three quantiles, \(q_{10}, q_{50}, q_{90}\), of the number of units expected to sell in the window between today and the item's expiry. It learns from twelve features: day of week, weekend flag, month, holiday (looked up per U.S. state), promotion flag, shelf life, item/category, state, days until expiry, and a near-expiry flag, all engineered from the retailer's inputs.
The model only emits raw quantiles plus an attribution object; the app derives other display values, so the entire product is traceable to a single place:
$$\text{surplus} = q_{\text{on_hand}} - \widehat{\text{sales}}{q_{50}}, \qquad \text{band} = \left[q_{\text{on_hand}} - \widehat{\text{sales}}{q_{90}},\ \ q_{\text{on_hand}} - \widehat{\text{sales}}{q_{10}} \right]$$
Model performance was evaluated using an 80/10/10 train-validation-test split across approximately 3 million data rows. The model produces conservative uncertainty estimates, with the \(q_{10}\) and \(q_{90}\) intervals achieving ~95.7% empirical coverage on validation data, compared with an 80% nominal expectation.
The width of that confidence band even sets the recommended pickup buffer. Tighter forecasts earn a longer planning runway; uncertain ones get a shorter, safer one. Google Maps handles location picking and reverse geocoding, and the store-to-food-bank distance is computed client-side using the Haversine formula.
Challenges we ran into
Training our first XGBoost model: Neither of us had built a quantile-regression model before, so we were learning XGBoost from the ground up, including how to configure it, which features actually carry signal, and how to shape its outputs. Feature selection was a challenge in itself, since we went back and forth on what genuinely predicts sell-through (day of week, seasonality, shelf life, promotions, proximity to expiry) versus what was just noise, and figuring out where to even source that information was half the battle.
Getting the quantiles and the prediction window right: Two failures ate a lot of our time. First, long horizons broke the model. So, when the snapshot-to-expiry window stretched beyond roughly a month, the three quantiles \(q_{10}, q_{50}, q_{90}\) collapsed onto each other and the model returned essentially the same number for every row, because over a long enough window almost everything eventually "sells," the target variance flattened out, and the confidence band lost meaning. Second, on some rows, the model overshot surplus wildly, predicting that almost nothing would sell and therefore flagging nearly the entire stock as donatable. We had to bound the prediction window to the near-term range where surplus is actually decision-relevant, and clamp and sort the quantiles per row before the forecasts started behaving.
Real-time sync across two different user types: Durare connects two roles whose views constantly affect each other, so a large amount of state has to stay live: when a retailer logs or removes inventory, when a coordinator claims a pickup, when a pickup is completed, as well as when sharing contact information with both parties. Every relevant screen on both sides has to update without a manual refresh and without two coordinators accidentally double-claiming the same surplus.
Keeping the interface usable and not bloated: With this much data flowing between two roles, the easy path was to dump every field and control onto the screen. We pushed hard against that, paring each role down to only what it needs. A retailer sees a clean inventory list, and a coordinator sees ranked forecast cards, so that a real, busy coordinator would actually want to use it instead of fighting it. Moreover, we utilized AI to facilitate the design process, which involves thoughtful design direction rather than mindlessly prompting and ending up with design slop.
Finding data that doesn't exist publicly: Grocery chains don't publish expiration dates or surplus inventory, so there was no available dataset to train on. We had to assemble what public information we could by scraping, then generate a synthetic dataset with time and item-specific values so the model learned genuine patterns rather than noise. Further, we utilized heuristics to make the data more complex for the model to grasp a trend rather than noise.
Accomplishments that we're proud of
- A forecasting engine with in-built confidence ranges: real quantile regression that ships confidence intervals, not point estimates pretending to be certain. Use of XGBoost to ship estimate ranges rather than a fixed point and a probability distribution
- End-to-end explainability: Every number on screen traces to a deterministic function, and every forecast has a simple reason as to why it's predicting what it is.
- Keeping it a prediction system, not an automated decision-maker: Our first and hardest design challenge was structural: we had to build the flow so the AI's job is genuinely to forecast and surface insight, and never to decide. It's deceptively easy to let software quietly make the call by, say, having an auto-claim a pickup or auto-dispatch a truck, but that would have dissolved the integrity of both the AI layer and the human one. We deliberately engineered the seams so the model only ever proposes (here's the predicted surplus, here's the confidence), and a coordinator is the one making the final call by looking into the AI's reasoning to make the best call.
- A human-in-the-loop: The AI proposes; a coordinator decides. The judgment that matters most (is this food safe, do we have capacity, should we send a truck) stays with a person.
- Security Implementations: Row-level security and privilege-escalation protection to protect sensitive information tied to organizations.
- It works specifically and locally: a full loop running across any retail location and matched to food banks based on distance, so it can work within local communities.
What we learned
- How to actually build a forecasting model with XGBoost. None of us had used XGBoost for prediction before this, and we came out the other side knowing how to frame a real-world problem as quantile regression, engineer features that preserve signals, and produce outputs with calibrated confidence levels instead of just a number. Going from "we've heard of gradient boosting" to a working, explainable forecaster was the steepest technical climb of the project.
- A great engine means nothing if no one will open the app. We learned that user experience can sometimes matter more than technical sophistication. You can build the most accurate model in the world, but if the interface is cluttered or confusing, a busy coordinator simply will not use it, and an app that never reaches its users helps no one. Designing for the human on the other end turned out to be just as important as the model behind it.
- Security is more important than ever: In an era where AI "vibecoding" makes it trivial to ship features fast, it is just as trivial to ship them insecurely; the tooling moves so quickly that security is the first thing to get skipped. Building direct browser-to-database access forced us to learn and actually implement real practices: Row-Level Security on every table, least-privilege service roles, and guards against privilege escalation. If anything, the speed of AI-assisted building makes that discipline more necessary, not less.
- The human in the loop is the most important feature we built. AI and ML systems are confidently wrong sometimes; they hallucinate, they overshoot, they sometimes produce inaccurate numbers that look authoritative. The deepest thing this project taught us is that the answer is not to chase a flawless model; rather, to make sure a person always holds the final judgement. The forecast informs the decision, but a human makes it, and on a problem touching food safety and perishable resources, that boundary is necessary.
What's next for Durare
- Taking it past the competition and into the real world. Beyond this competition, we genuinely feel this is such a strong product with the opportunity to actually really help people in the real world, and we are willing to work with local companies and food banks to implement this. Our next step is to put it in front of actual users: we're ready to work directly with local grocers and food banks to pilot it, learn from how it's really used, and refine it around their day-to-day workflow.
- Notifications and impact tracking. Two features would make Durare far more enticing: Proactive notifications would alert a coordinator the moment high-confidence surplus appears, so a rescue never hinges on someone remembering to check. An impact dashboard would total the pounds of food rescued, meals provided, and landfill emissions avoided, in order to display everyday pickups into a visible, motivating record of the difference made.
- A sharper forecasting model. The biggest accuracy gains come from richer inputs. We want to feed the model daily and historical sales so it learns each item's real velocity, day-of-month demand spikes around paydays, perishability tiers beyond raw shelf life, and per-item traffic rates. Each one gives the model more of the real-world signal that separates items with different signals.
- Partnerships that compound accuracy. The single best way to make Durare more accurate is to have more real data. By partnering with local retailers and nonprofits, we can train on real, historical sales and surplus patterns and tune region-specific parameters, so the model gets measurably better for every community it serves, instead of leaning on larger approximations. The more partners join, the sharper it becomes for everyone.
Built With
- fastapi
- google-maps
- lovable
- postgresql
- python
- react
- render
- supabase
- tailwindcss
- tanstack-start
- typescript
- xgboost


Log in or sign up for Devpost to join the conversation.