DSAvis — Data Structure Visualizer
I built this because most DSA resources are either too abstract or too dry. DSAvis lets you watch Python code run line by line while the data structure updates in real time — no setup, no install, just open and learn.
🔗 Live Site: mrsiuuuu-x1.github.io/DSA-Visualization
What's inside
| Section | What you'll see |
|---|---|
| Array | append, pop, insert — watch indices shift in real time |
| Linked List | node chaining, deletion with pointer re-linking visualized |
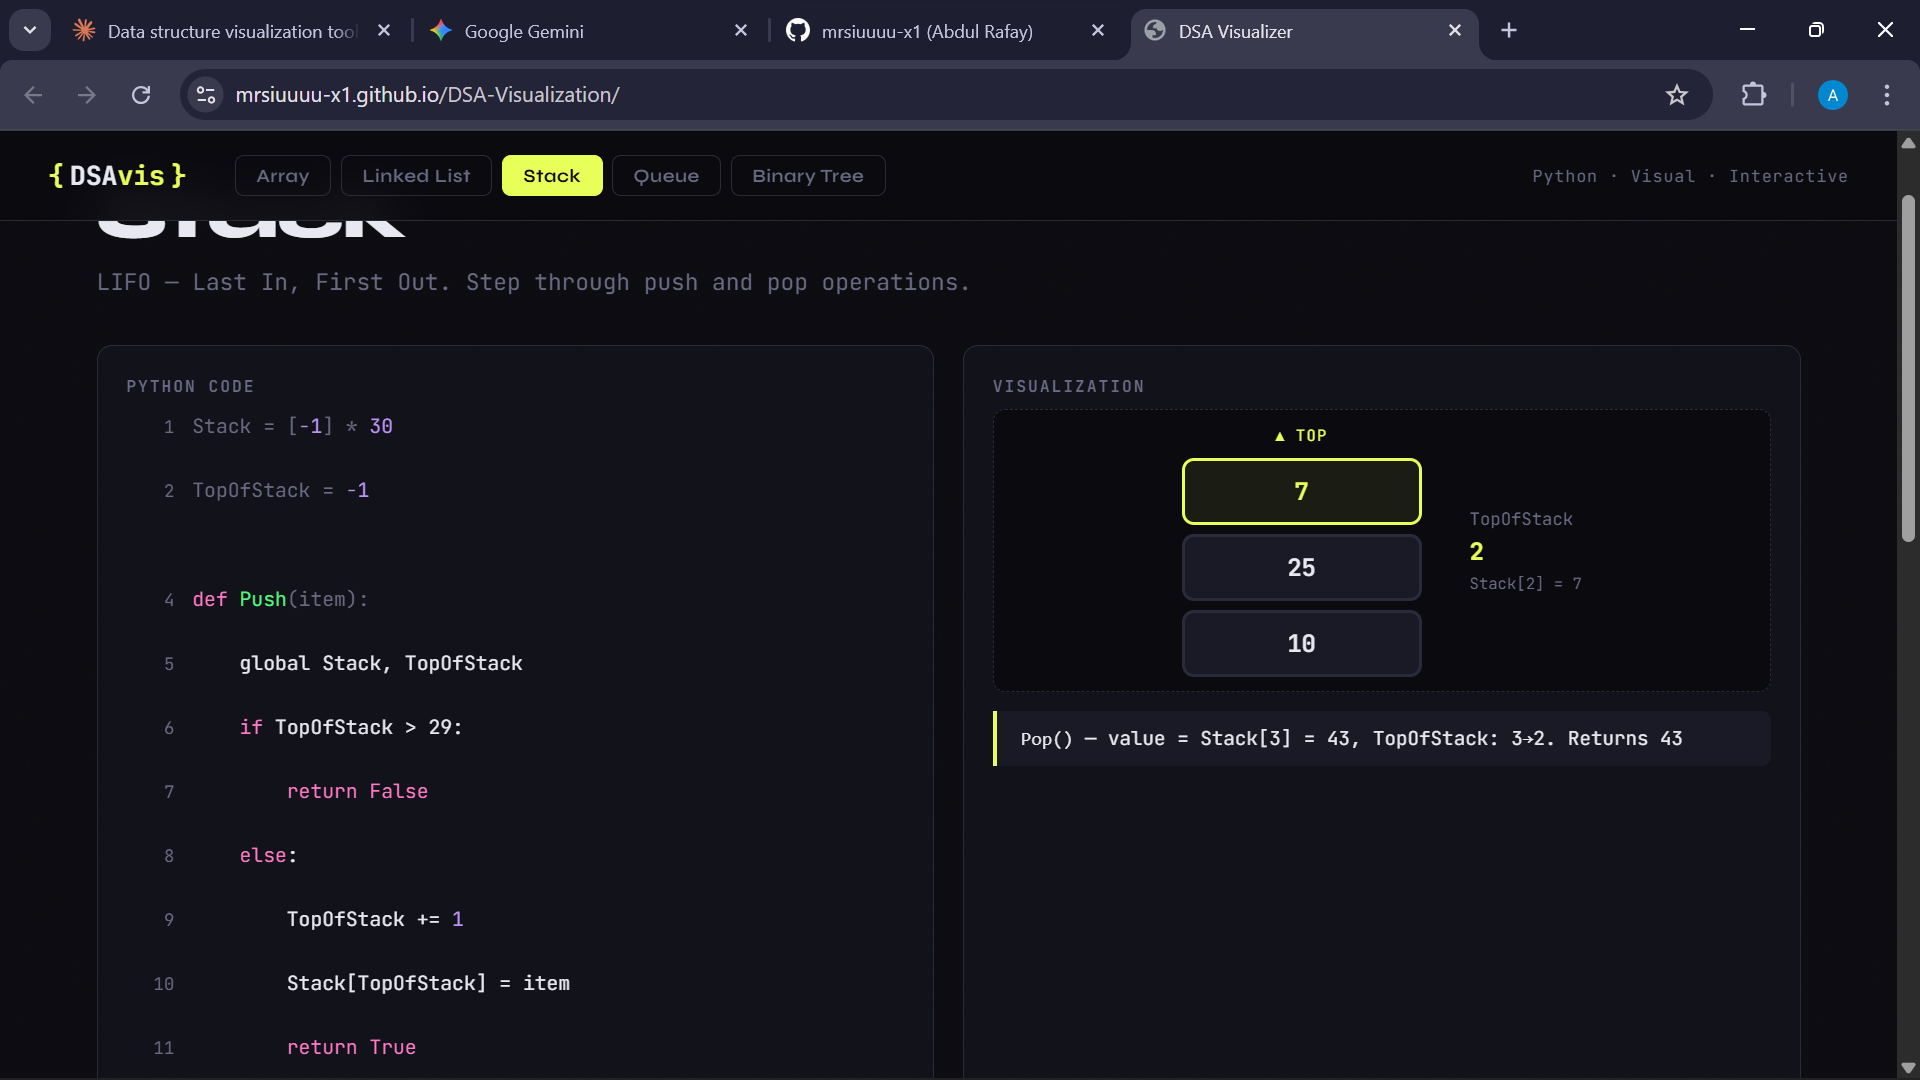
| Stack | push and pop with a live TopOfStack pointer |
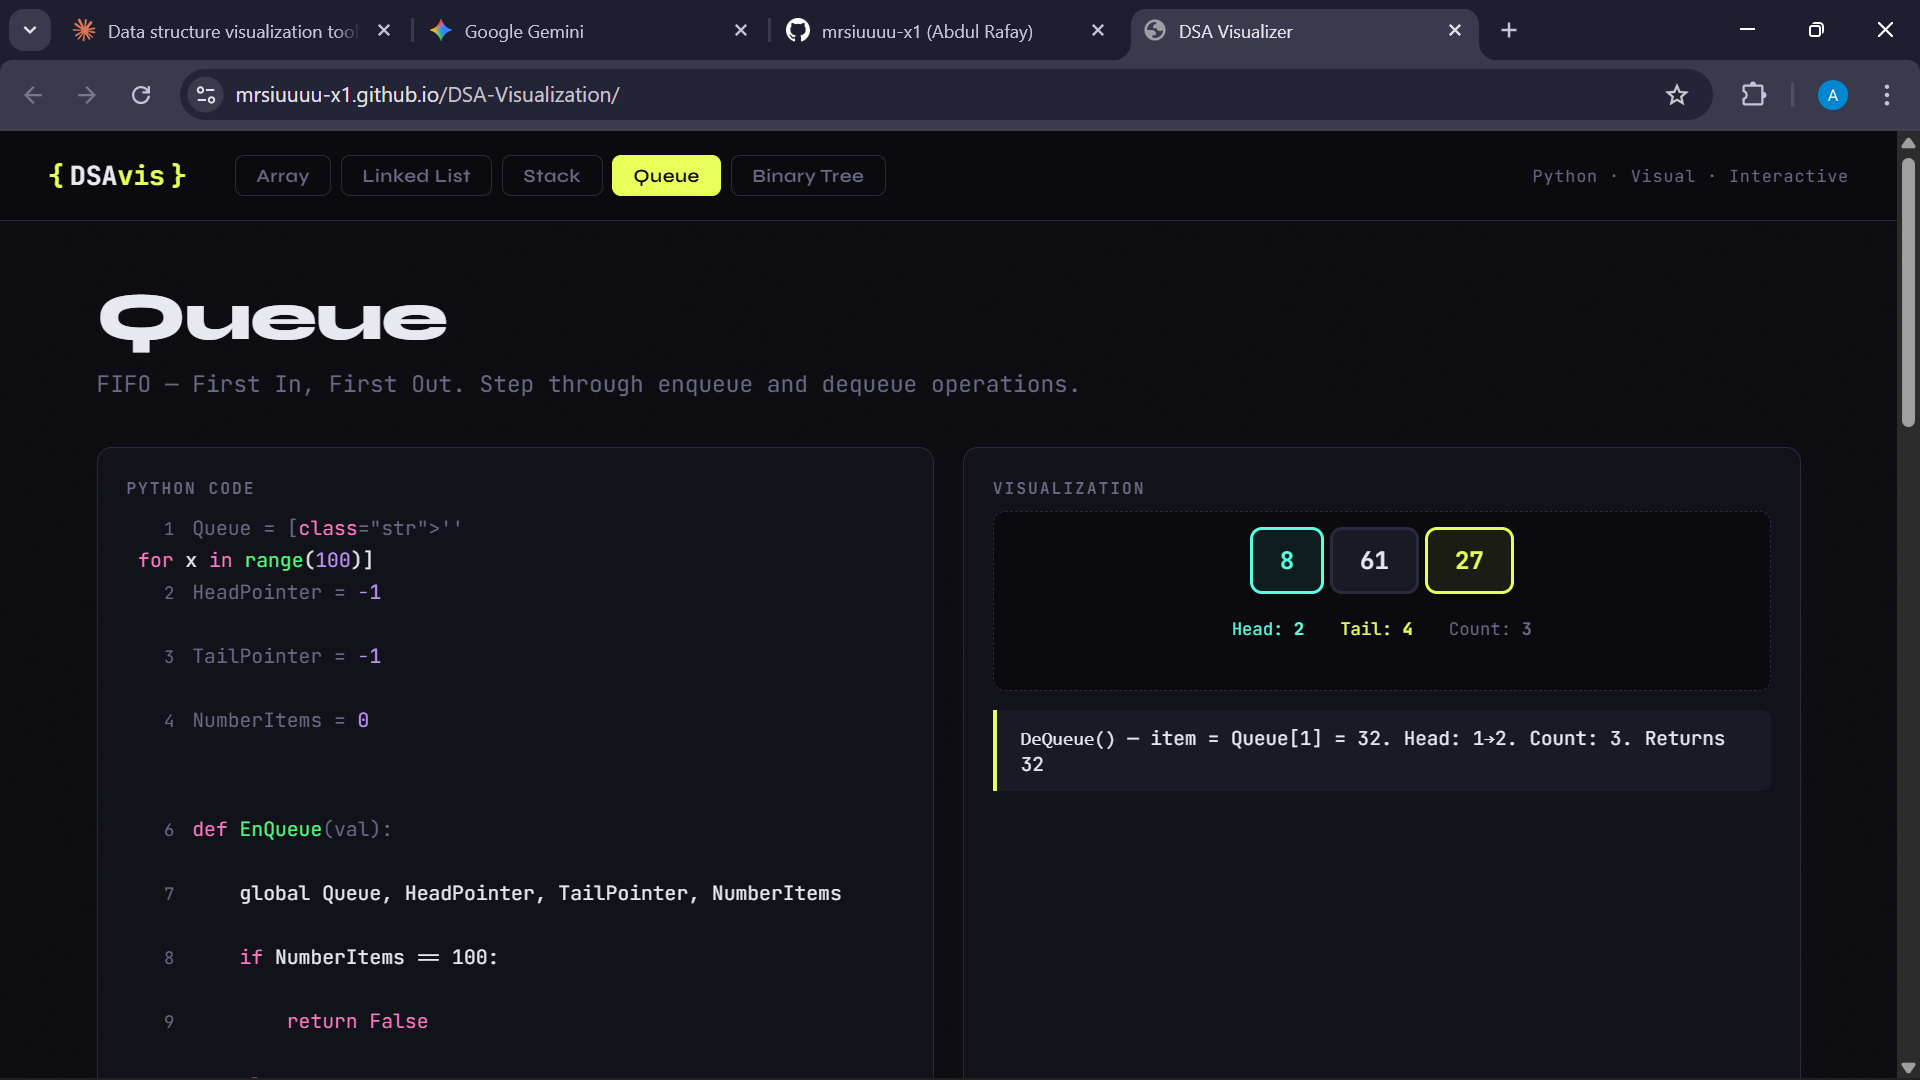
| Queue | enqueue and dequeue with Head, Tail, and Count updating live |
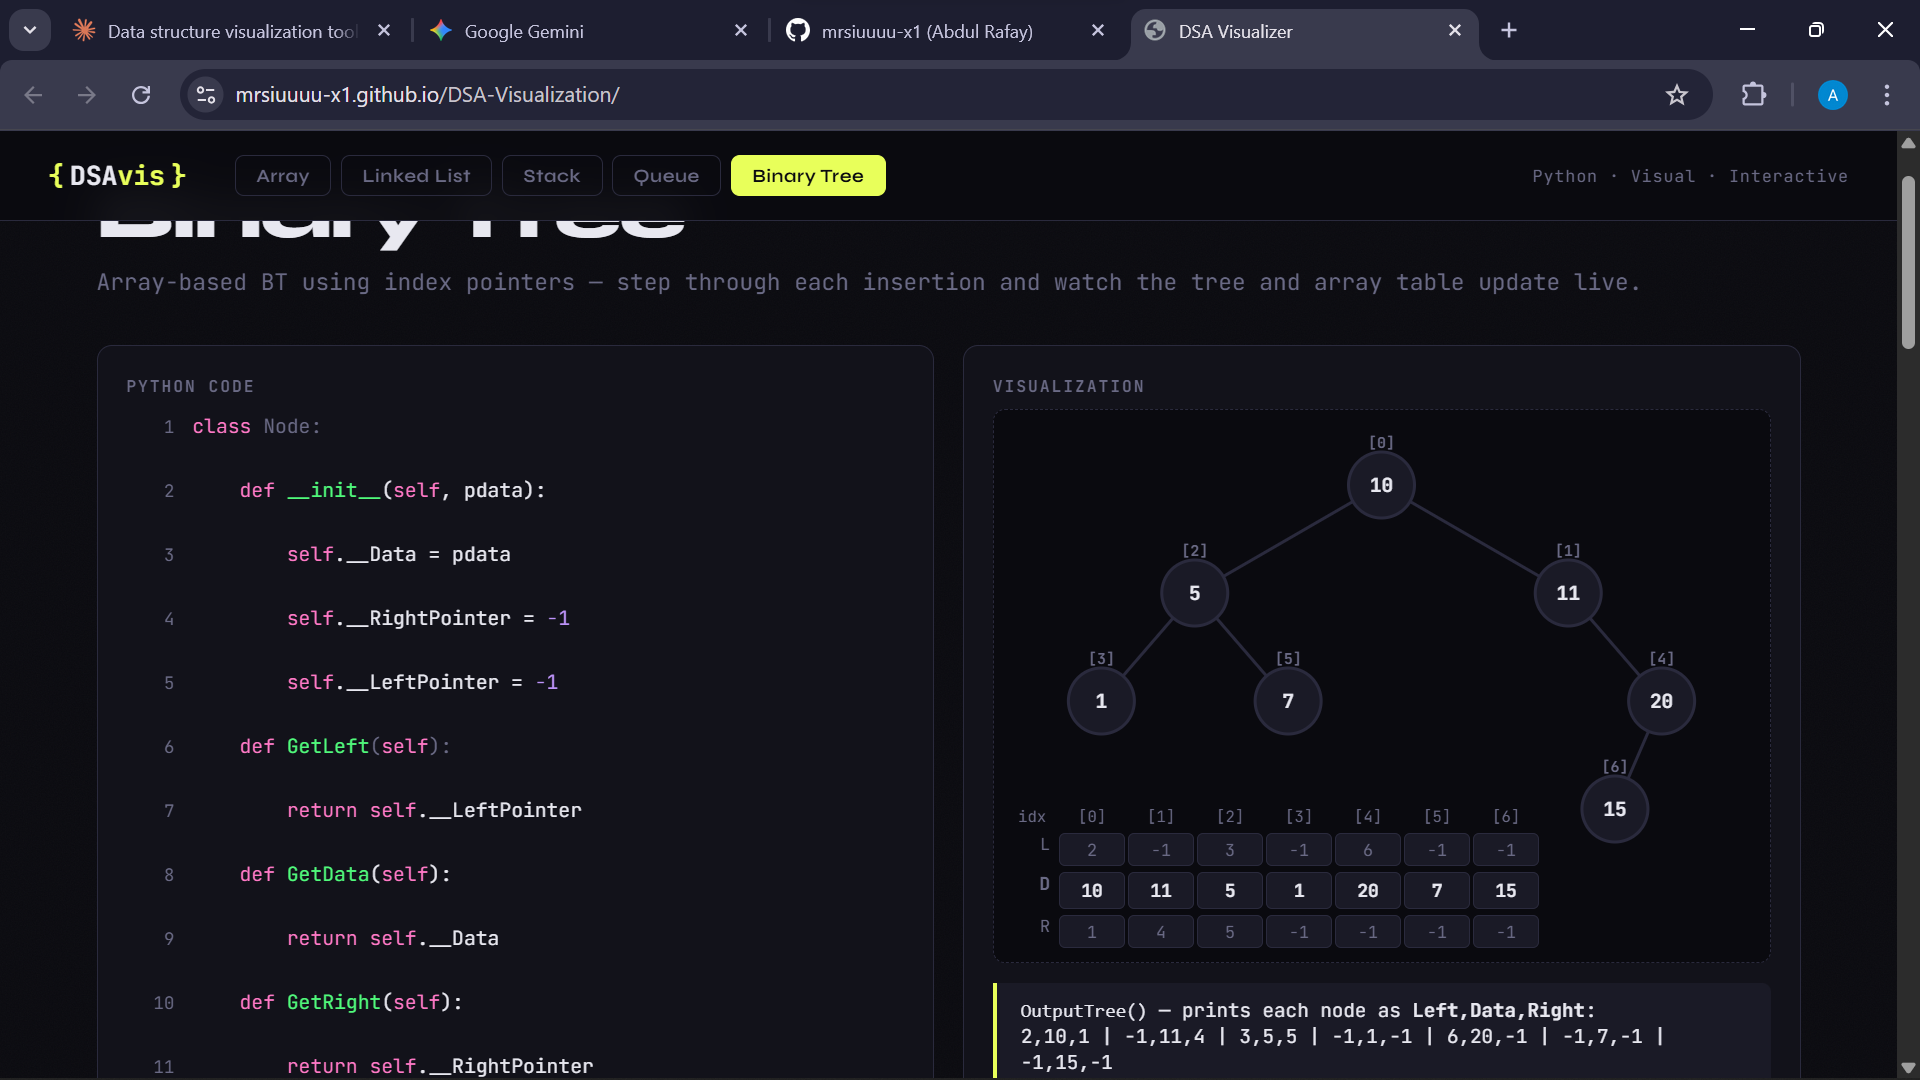
| Binary Tree | BST insertion with an array-based implementation — see the L/D/R table update as nodes are placed |
| Sorting | Bubble Sort and Insertion Sort — bar chart that highlights comparisons, swaps, and sorted regions |
Two ways to learn
Step Mode
Click Step → to move through the code one line at a time. Every step updates the diagram and shows a plain-English explanation of what just happened. Use Auto to let it play on its own, and the speed slider to go as slow or fast as you want.
Interactive Mode
Write your own Python code, tag a variable with # @visualize varName, and hit Run. The visualizer will animate every change to that variable as your code executes — line by line, with the active line highlighted.
A few things worth knowing:
- If your code throws an error, you'll get a plain-English explanation instead of a raw Python traceback
- If you accidentally tag a class name instead of a variable, a warning appears before you even run
importstatements aren't supported — the visualizer runs Python in-browser via Skulpt
Interactive Mode — quick examples
Simple list:
arr = []
arr.append(10)
arr.append(20)
arr.append(30)
# @visualize arr
Linked list — add a to_list() method and reassign after each operation:
ll = LinkedList()
snapshot = ll.to_list()

ll.append(10)
snapshot = ll.to_list()

ll.append(20)
snapshot = ll.to_list()

# @visualize snapshot
Binary tree — snapshot() needs to return [[leftIdx, data, rightIdx], ...] per node:
def snapshot(self):
    return [[self.__Tree[i].GetLeft(), self.__Tree[i].GetData(), self.__Tree[i].GetRight()]
            for i in range(self.__NumberNodes)]

Tree = TheTree.snapshot()
TheTree.InsertNode(Node(10))
Tree = TheTree.snapshot()
# @visualize Tree
Running locally
No build step, no dependencies — just clone and open.
git clone https://github.com/mrsiuuuu-x1/DSA-Visualization.git
cd DSA-Visualization
# open index.html in your browser
File structure
DSA-Visualization/
├── index.html
├── style.css
├── utils.js
├── interactive.js
├── sections/
│   ├── array.js
│   ├── linkedlist.js
│   ├── stack.js
│   ├── queue.js
│   ├── tree.js
│   └── sorting.js
├── main.js
├── favicon.svg
└── README.md
Tech stack
- Vanilla HTML, CSS, JavaScript — zero dependencies, zero build step
- Skulpt — in-browser Python interpreter
- SVG for Binary Tree rendering
- Google Fonts: JetBrains Mono + Syne
- Hosted on GitHub Pages
What's coming
- [ ] Hash Tables
- [ ] Heap / Priority Queue
- [ ] Light theme toggle
License
MIT — free to use, modify, and share.

Log in or sign up for Devpost to join the conversation.