-
-

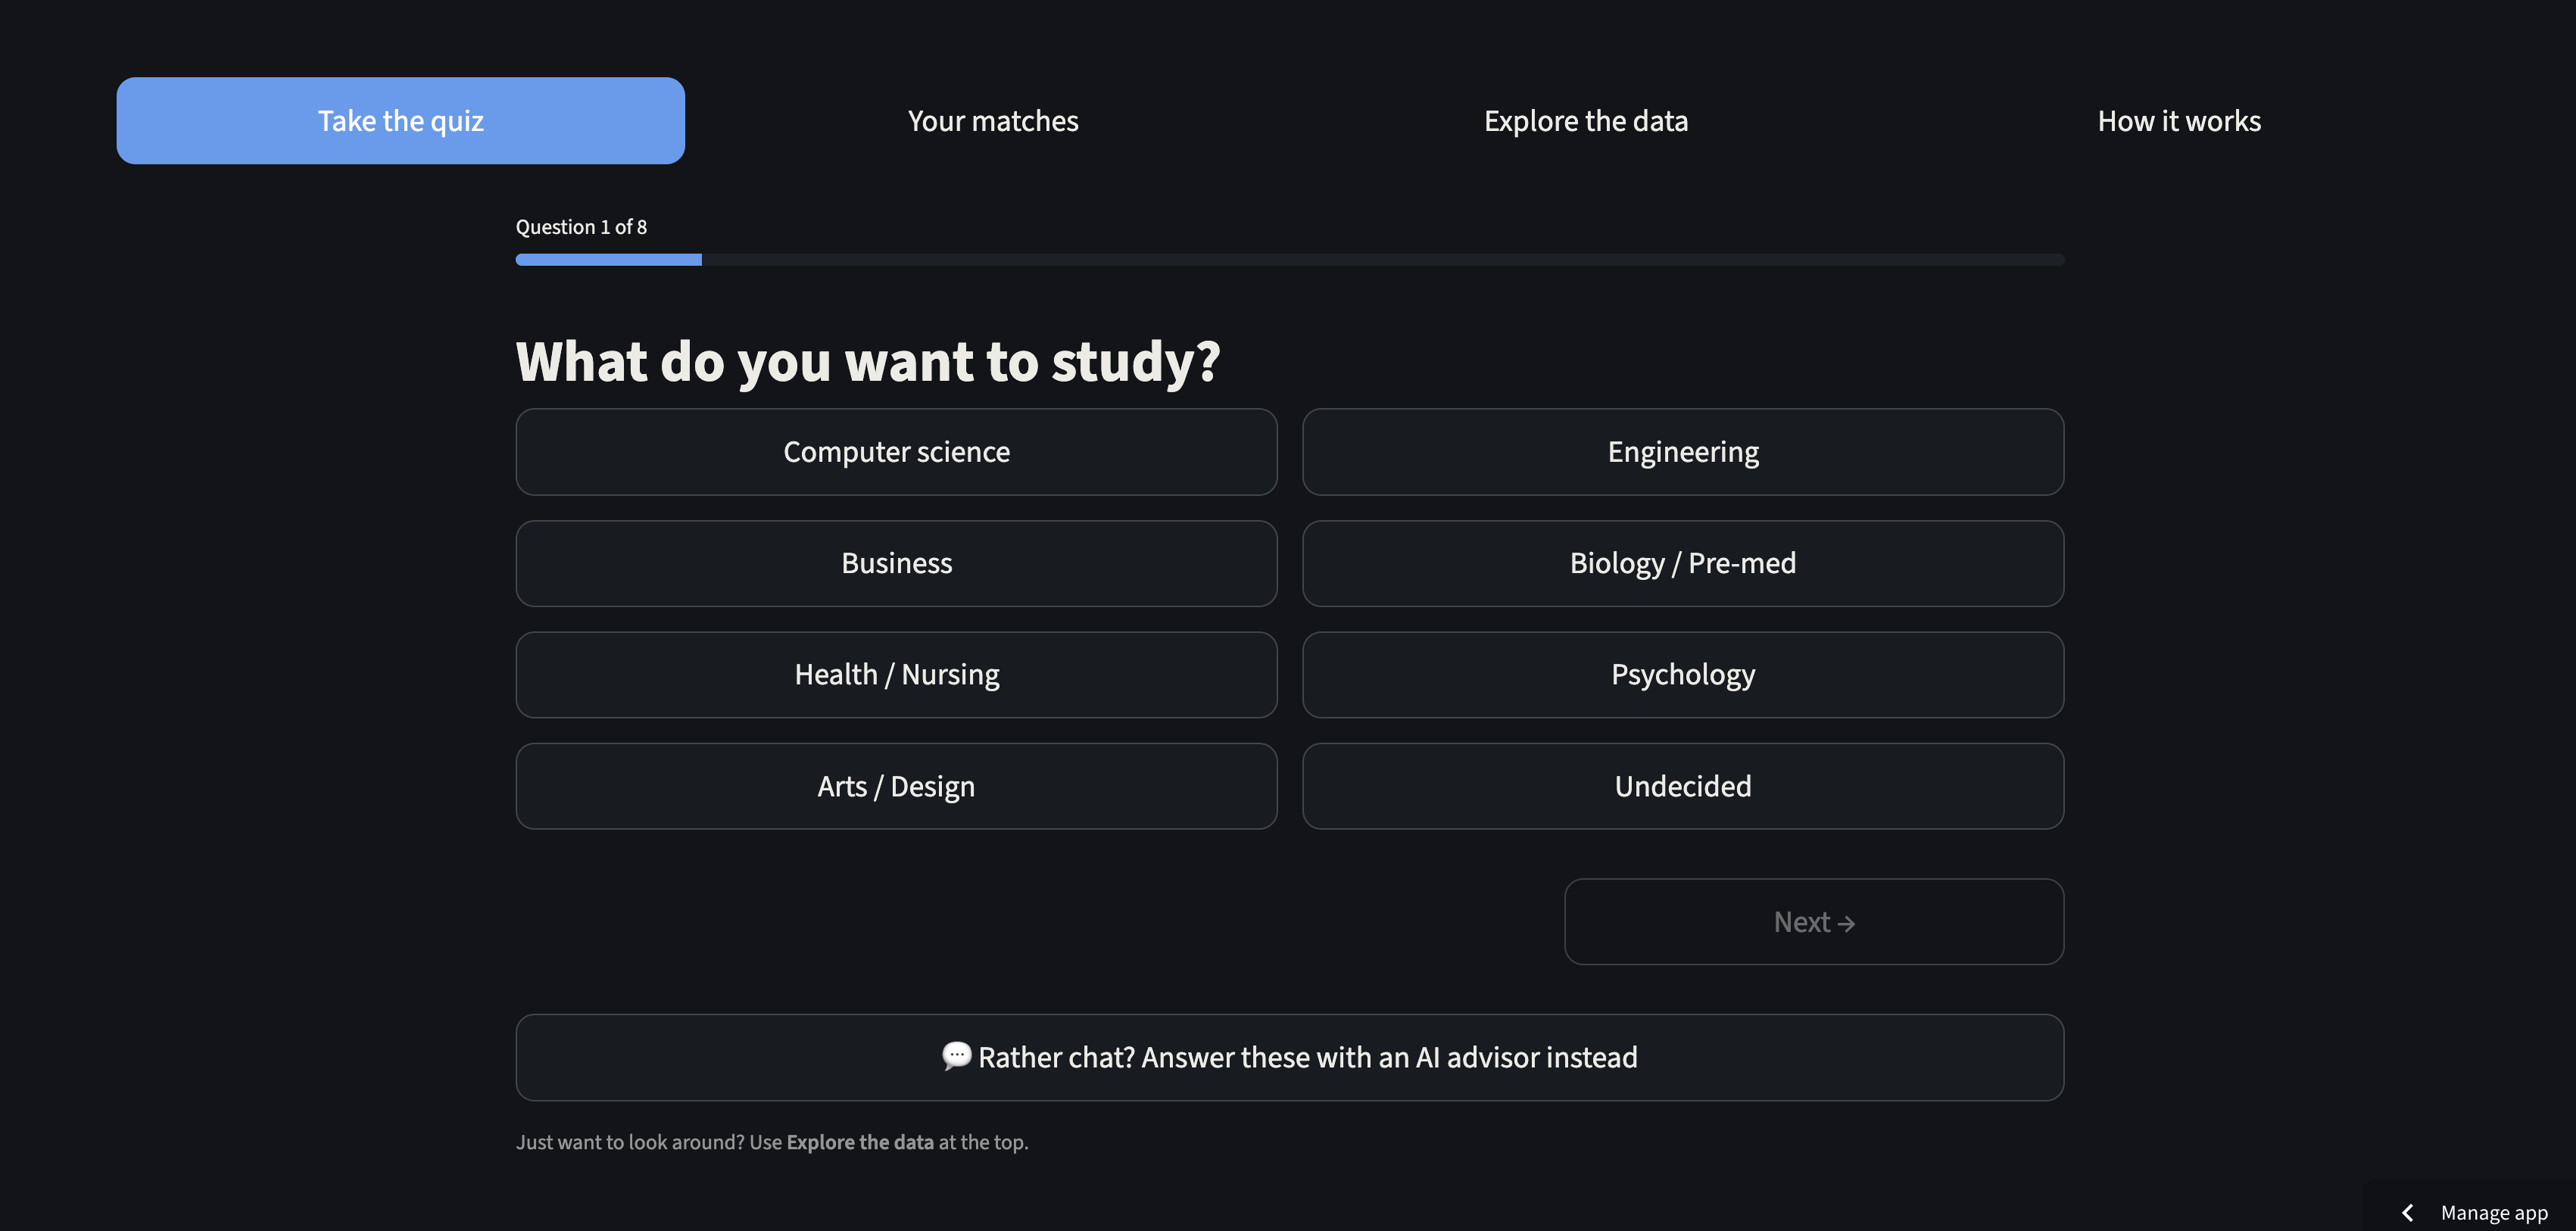
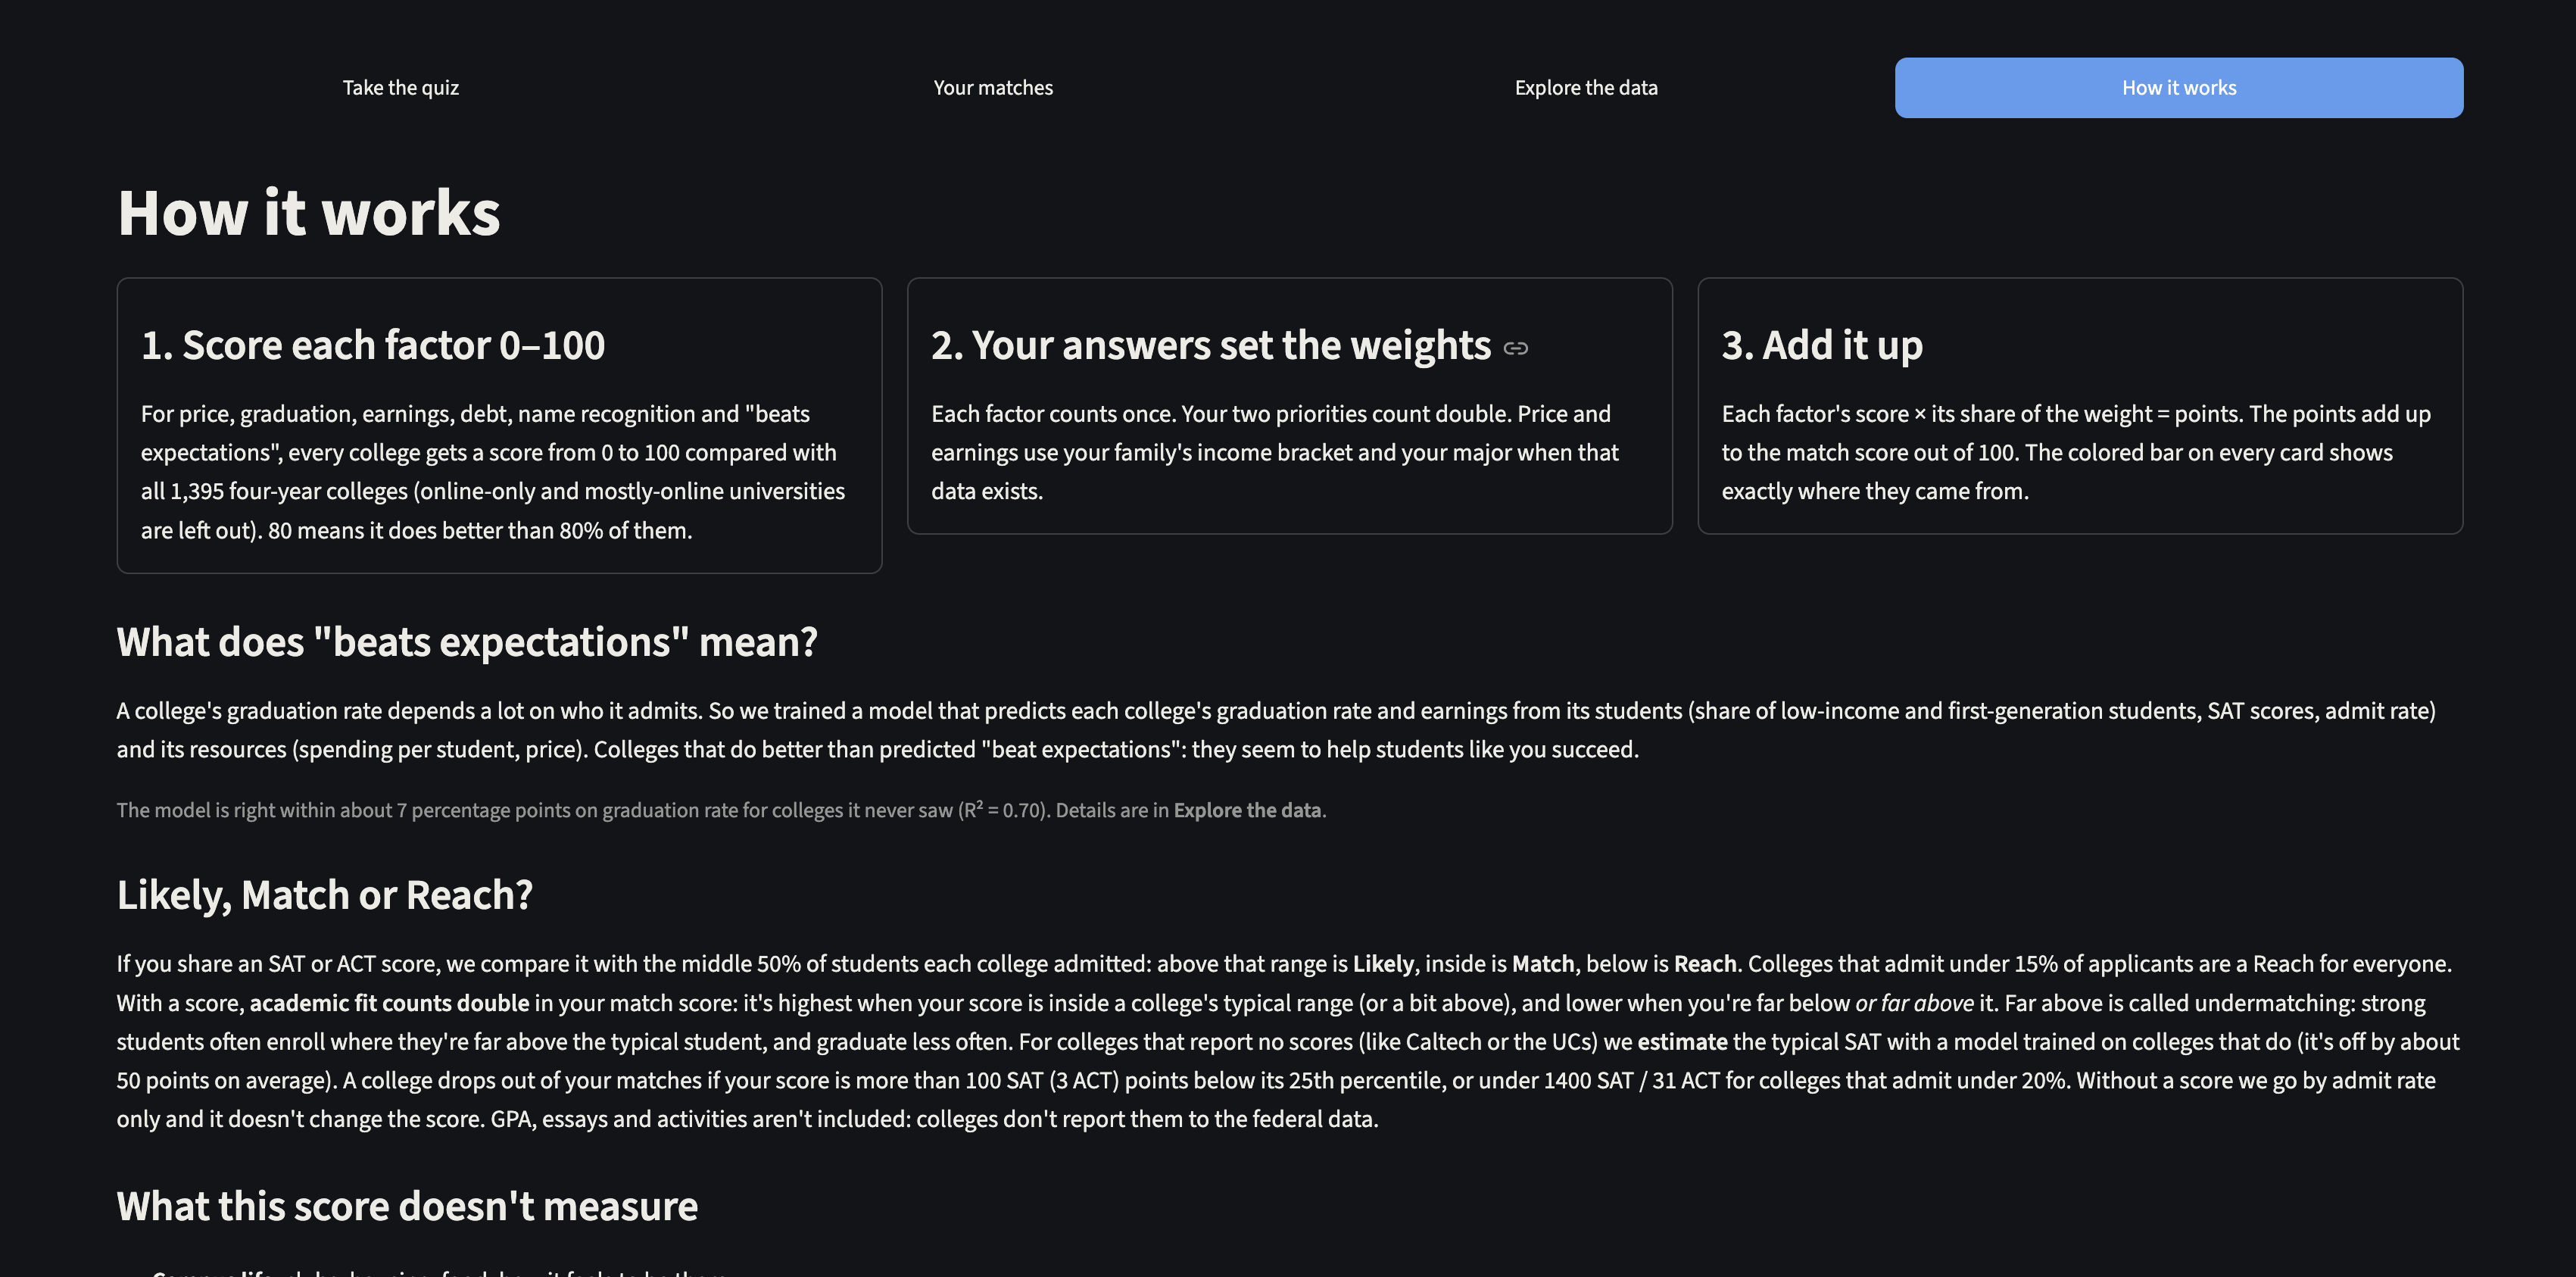
Personal preferences quiz
-

AI college advisor
-
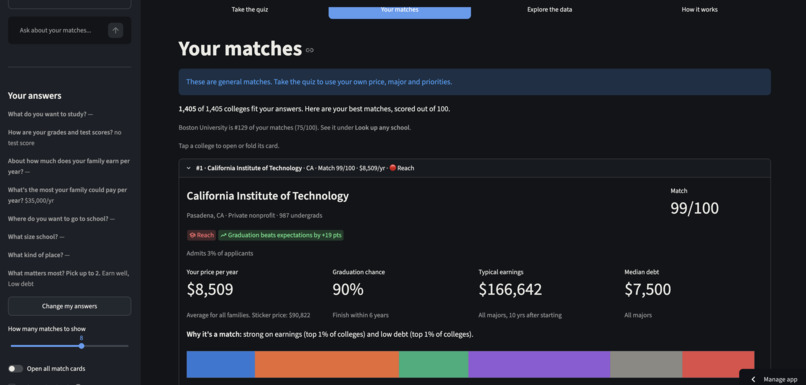
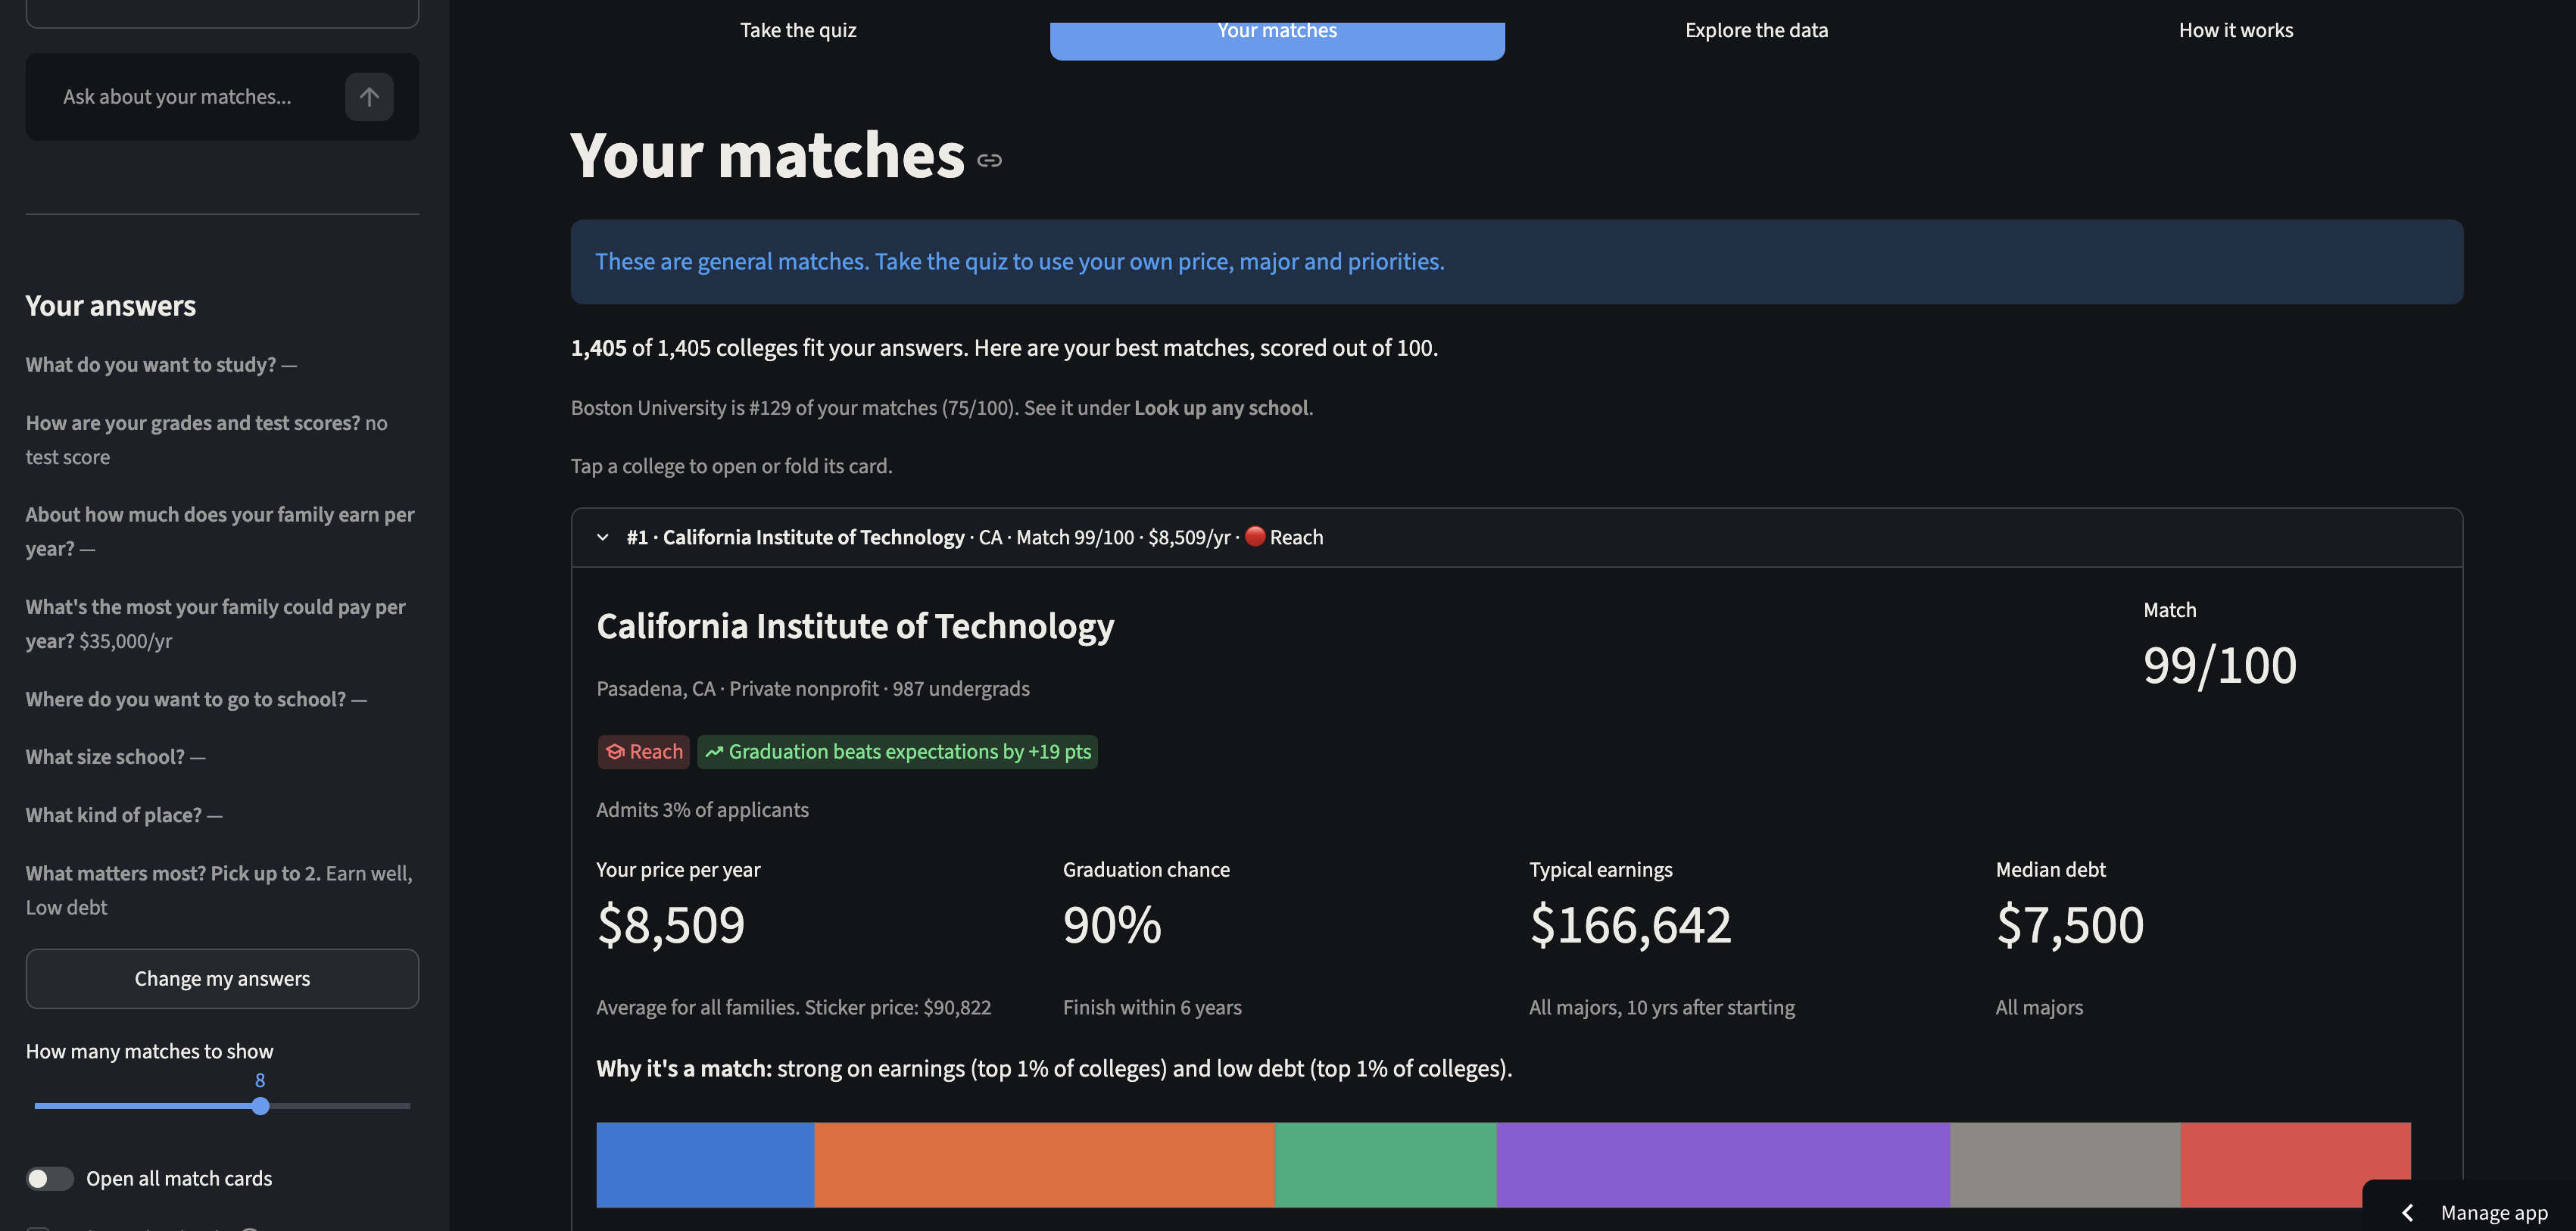
Results screen
-
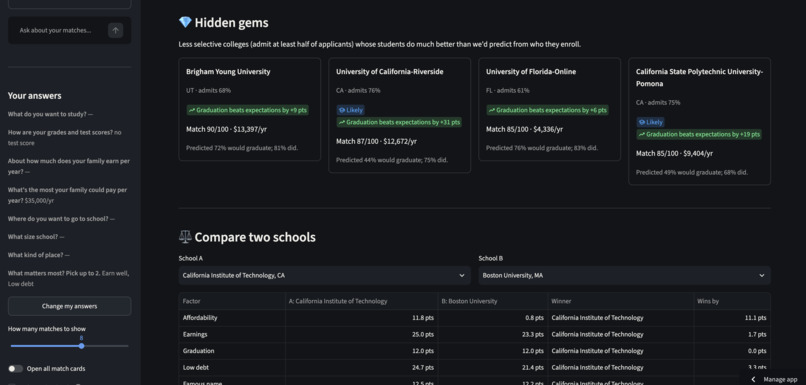
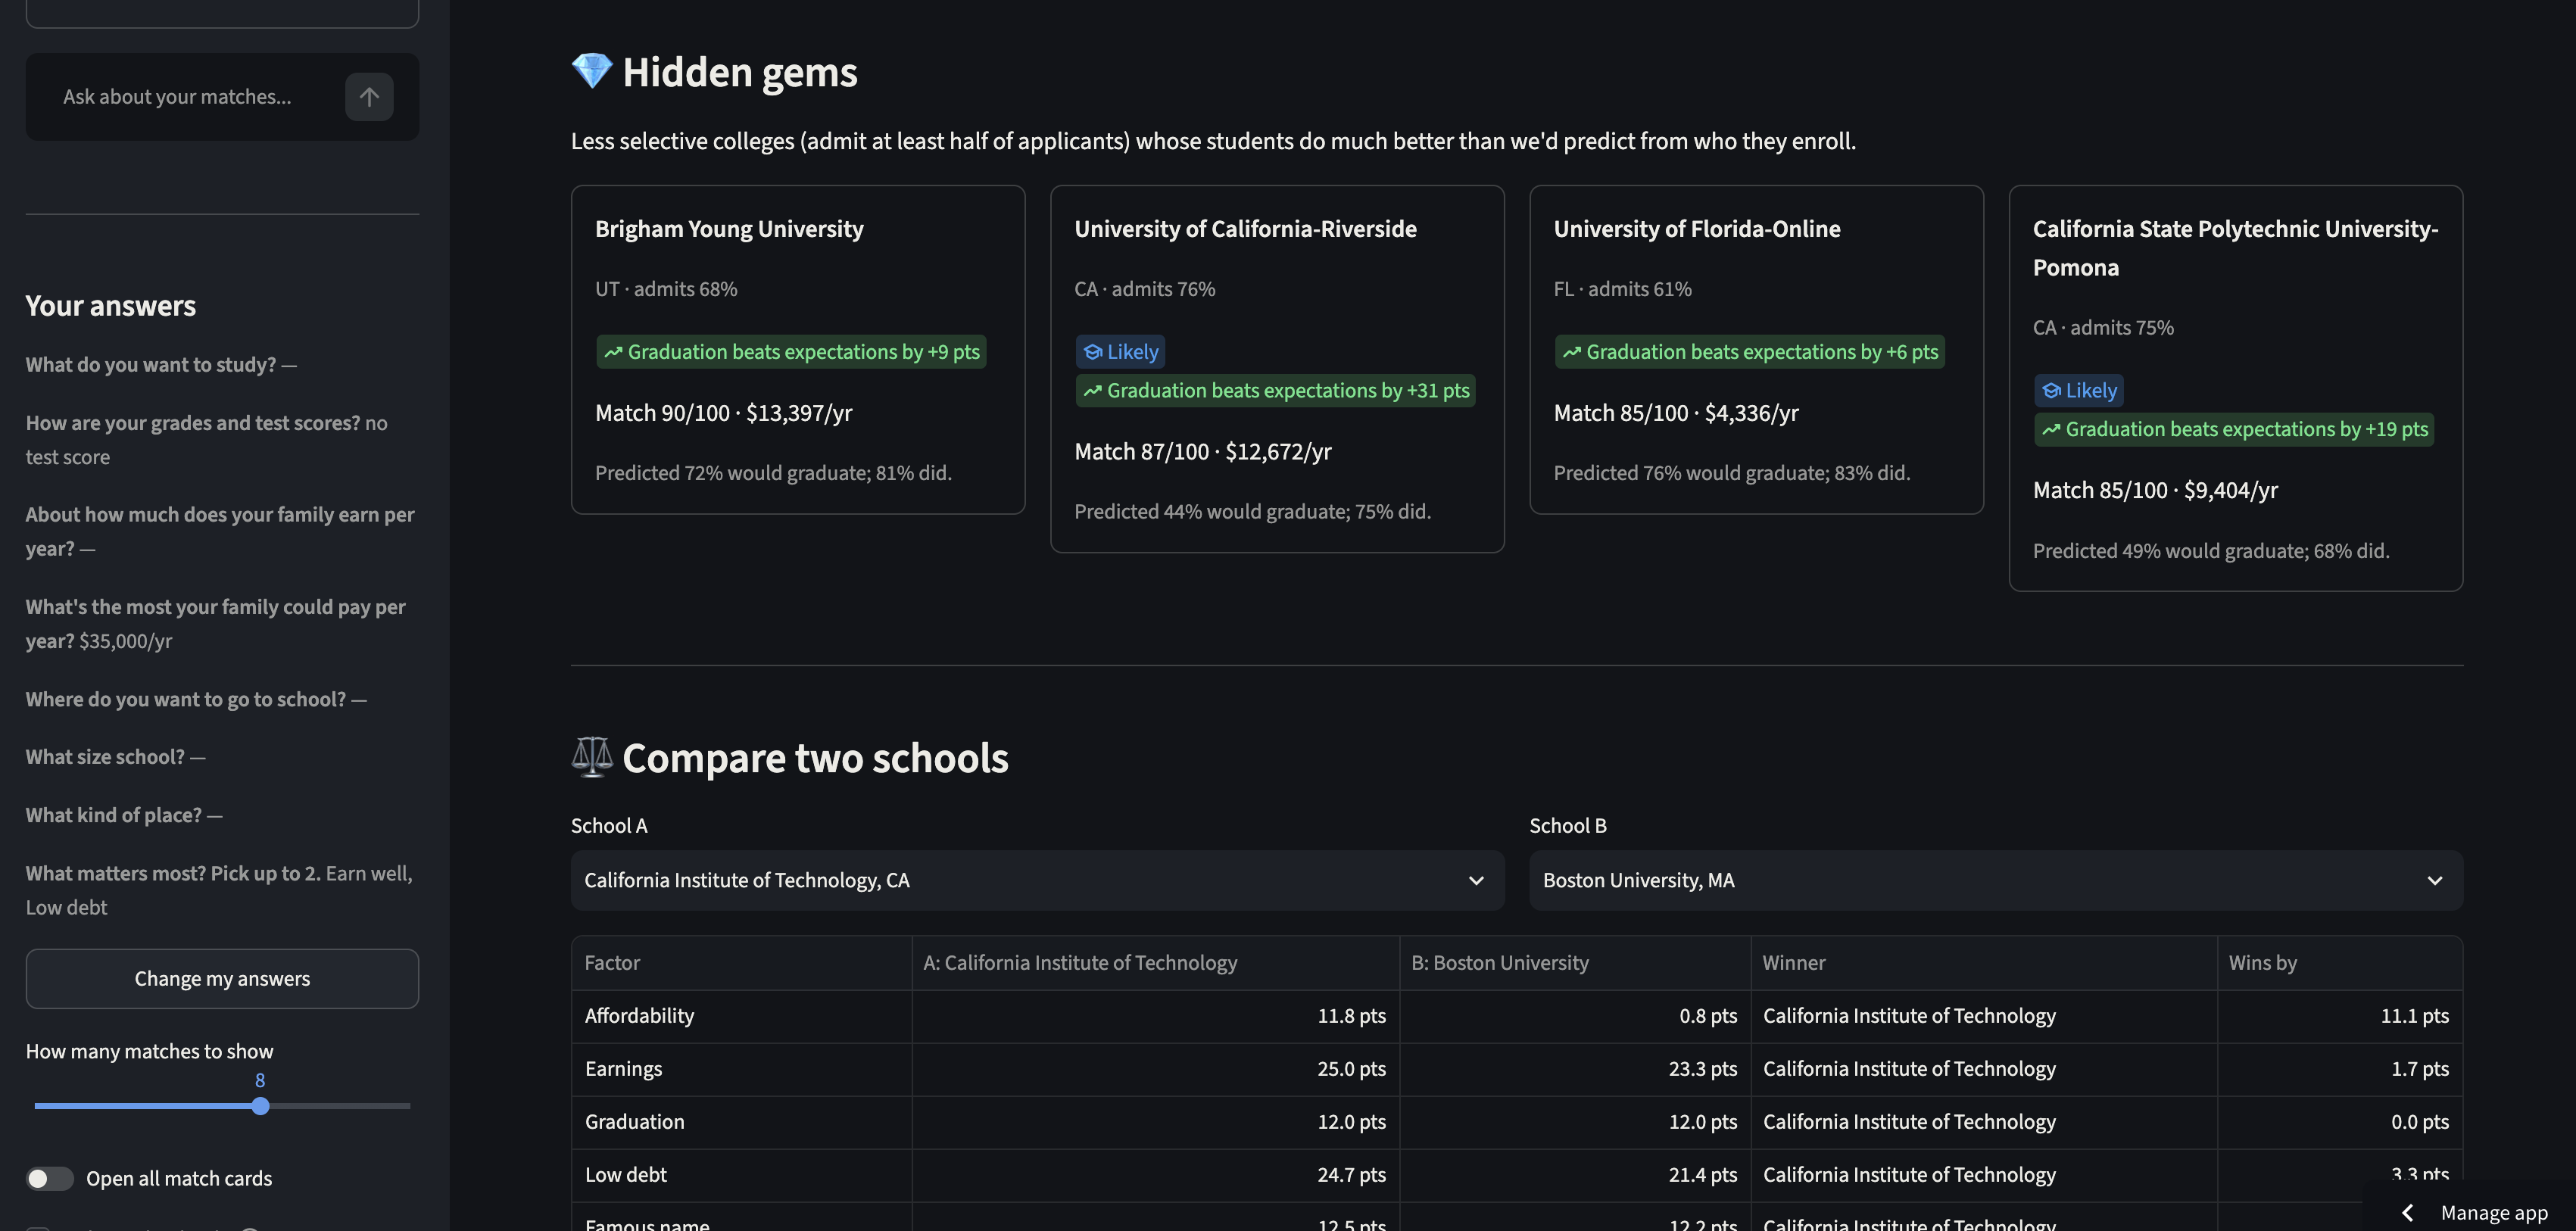
Hidden gems section
-

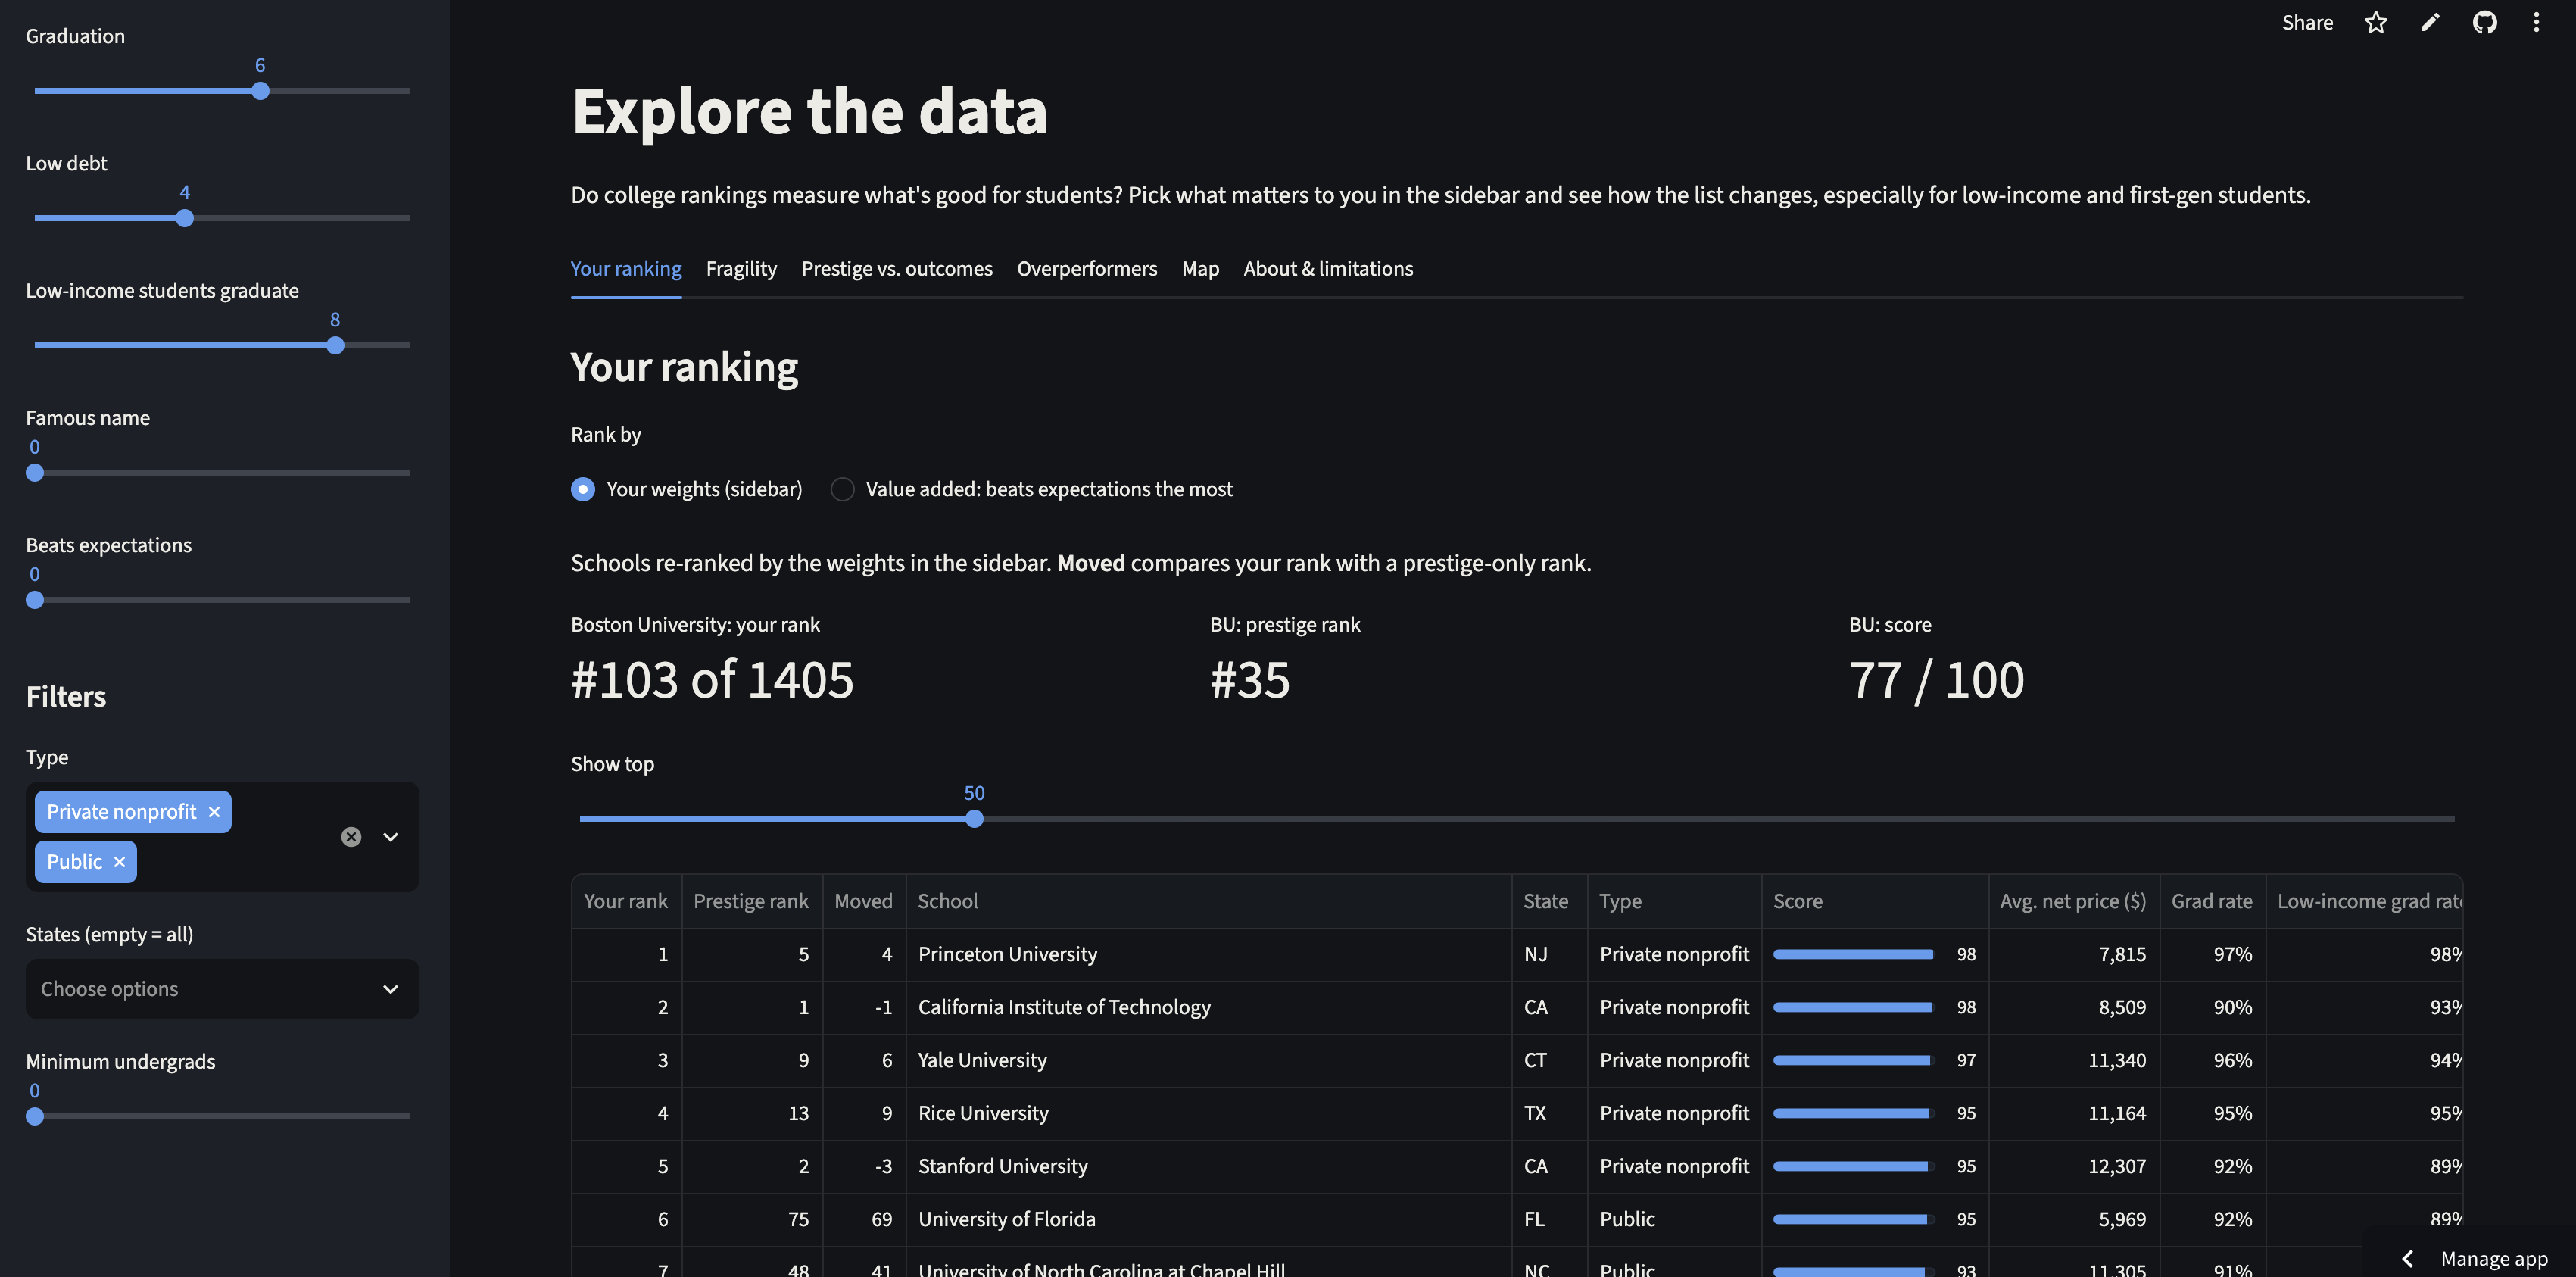
Adjustable rankings page
-
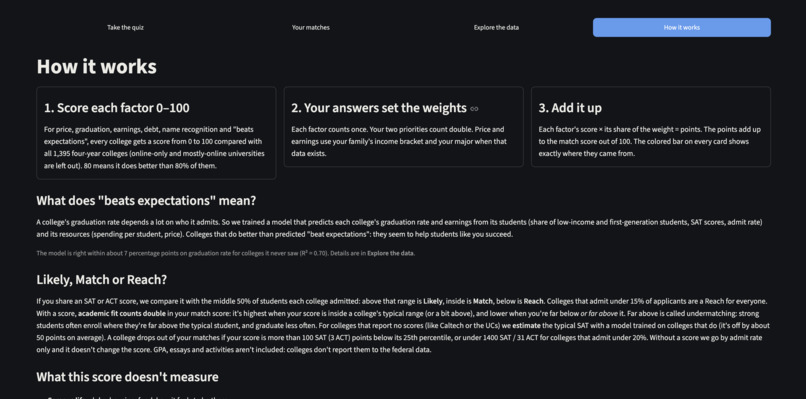

Inspiration
Every fall, college rankings tell students and families which schools are "best." But many ranking formulas reward how selective and wealthy a school is, which mostly measures who it admits, not how well it serves the students it has.
As college students who just went through the application process, we kept asking: which colleges actually help their students graduate and earn a good living without heavy debt, especially students from low-income and first-generation families? Rankd is our attempt to answer that with data instead of reputation.
What it does
Rankd is an interactive app built on the U.S. Department of Education's College Scorecard for 1,405 four-year colleges.
- Rank by what matters to you. Sliders for affordability, earnings, graduation rate, low debt, Pell-student graduation, and prestige re-rank every school live, and show how far each one moves compared with a prestige-only ranking.
- Fragility check. Reruns the ranking 500 times with slightly nudged weights to show how arbitrary a "top 20" can be.
- Overperformers. A machine-learning model finds schools that graduate more students, or produce higher earnings, than expected given who they enroll.
- Prestige vs. outcomes. An interactive scatter plot (with BU highlighted), a US map, and a limitations page.
How we built it
We used Python, pandas, scikit-learn, Plotly, and Streamlit.
1. Cleaning. We cut the 3,000+ column Scorecard file down to 25 fields and kept public and private nonprofit colleges that mainly award bachelor's degrees. We treated NULL, PrivacySuppressed, and PS as missing, and dropped graduation rates based on fewer than 100 students.
2. Predicting outcomes. We trained models to predict graduation rate and 10-year earnings from factors a college mostly doesn't control in the short run: % Pell, % first-gen, admit rate, average SAT (with a "not reported" flag), instructional spending per student, and net price.
| Model (20% held-out test set) | Graduation rate $R^2$ / MAE | Earnings $R^2$ / MAE |
|---|---|---|
| Linear regression | 0.65 / 8.0 pts | 0.53 / \$8,785 |
| Random forest | 0.72 / 7.2 pts | 0.60 / \$7,908 |
3. Measuring value added. For each school $i$, the overperformance is the residual
$$ r_i = y_i - \hat{y}_i^{(-k)} $$
where $\hat{y}_i^{(-k)}$ is the prediction from a model trained with 5-fold cross-validation on the folds that don't include school $i$. That way no school is judged by a model that already saw it. We used permutation importance to explain which inputs matter most.
4. Prestige vs. outcome scores. Using percentile ranks $\text{pct}(\cdot)$ from 0 to 100:
$$ \text{Prestige}_i = \tfrac{1}{4}\Big[\text{pct}(\text{selectivity}_i) + \text{pct}(\text{SAT}_i) + \text{pct}(\text{faculty salary}_i) + \text{pct}(\text{spending}_i)\Big] $$
The outcome score is the average percentile of graduation rate, Pell-student graduation rate, earnings, low debt, and low net price.
5. Personal ranking and fragility. A school's score is a weighted sum of its normalized factor values $x_{ij}$ using the user's weights $w_j$:
$$ S_i = \frac{\sum_j w_j \, x_{ij}}{\sum_j w_j} $$
For the fragility check, we rerun the ranking 500 times with each weight perturbed by up to ±20%,
$$ w_j' = w_j\,(1 + \varepsilon_j), \qquad \varepsilon_j \in [-0.2,\ 0.2] $$
and measure how much the top 20 reshuffles.
Key findings
- Who a college enrolls explains most of its results. Average SAT and % Pell are the strongest predictors of both graduation and earnings.
- Prestige predicts who gets in, not how much a school adds. Prestige has a Spearman correlation of $\rho = 0.72$ with raw graduation rate, but only $\rho = 0.12$ with graduation-rate overperformance (and $0.13$ for earnings).
- The real overperformers are public universities serving low-income students. UC Riverside (+31 points above predicted graduation rate), Florida International, Rutgers-Newark, CSU Long Beach, Montclair State, and San Diego State all have 35–58% Pell students.
- We looked honestly at our own school. BU scores 97 on prestige and 76 on outcomes. Its graduation rate exactly matches prediction (89.5%), and earnings come in \$4.4k below.
Challenges we ran into
- Tiny cohorts. Some graduation rates were based on a single student, so our first "top overperformers" were small seminaries at 100%. We added a minimum cohort size of 100.
- Test-optional schools. About 38% of schools don't report SAT scores. Instead of dropping them, we filled with the median (fit on training data only) and added a missing-value flag.
- Hidden missing data. Missing values appear under several different codes, and faculty salary turned out to be reported monthly.
- Weights are values, not math. No set of weights is objectively "correct," so we made that uncertainty visible with the fragility check instead of hiding it.
What we learned
- How much of a college's outcomes come from its incoming students rather than the college itself.
- Why held-out testing and cross-validated residuals matter: without them, a model can "grade" schools it has already memorized.
- That a single data-cleaning decision, like a cohort-size cutoff, can completely change the story.
Ethics & limitations
- Earnings only cover students who received federal financial aid, and they depend heavily on majors and local job markets. Arts and music schools look weak on earnings for this reason.
- "Overperforming" means beating our seven-input model. That's correlation, not causation, and unmeasured factors matter.
- Privacy suppression hides data for small groups, so small schools are under-represented.
- Graduation rates count only first-time, full-time students.
- Prestige is our own proxy. We did not scrape U.S. News, QS, or THE.
- Data: U.S. Department of Education, College Scorecard (public domain), downloaded October 2026.
What's next for Rankd
- Smarter personal matching: net price for each student's income bracket, academic fit (reach, match, and likely schools), and the share of degrees in their intended major, so high-achieving low-income students aren't steered below their level.
- Field-of-study earnings to separate "good college" from "high-paying major."
- Uncertainty intervals on overperformer estimates.
- Trends over time using historical Scorecard files.
Built With
- claude
- pandas
- plotly
- python
- scikit-learn
- streamlit

Log in or sign up for Devpost to join the conversation.