-
-
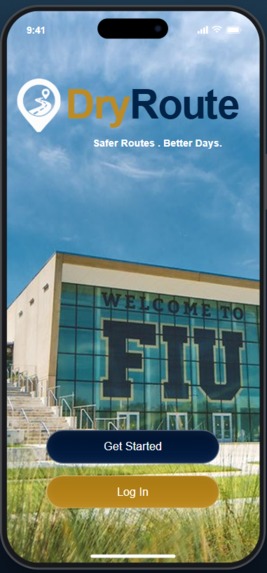
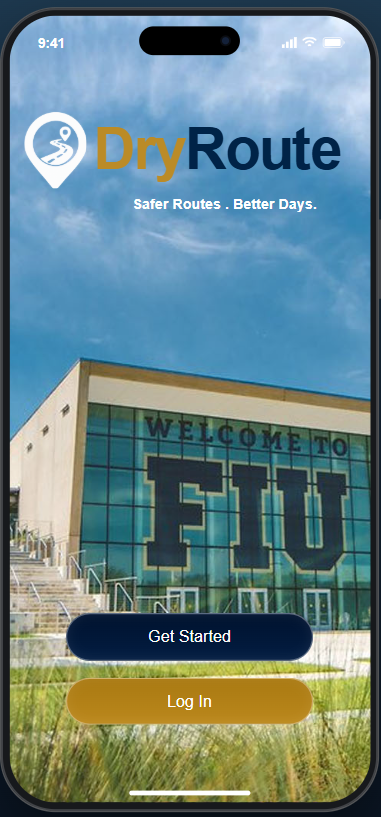
Starting page
-
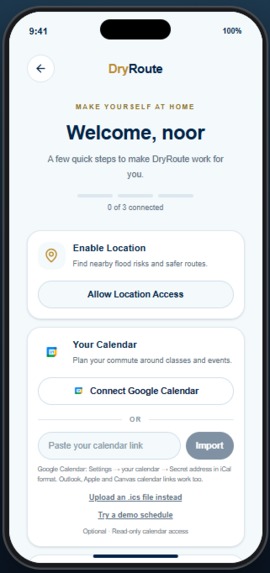
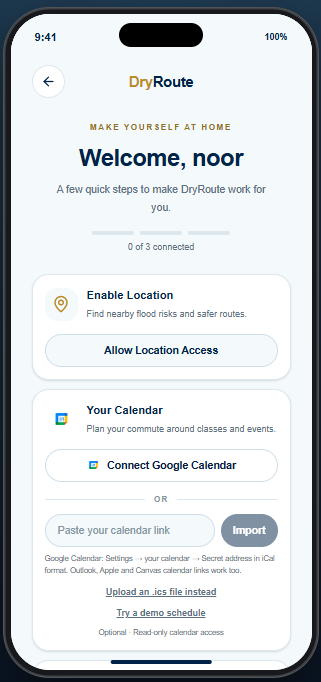
Welcome screen
-
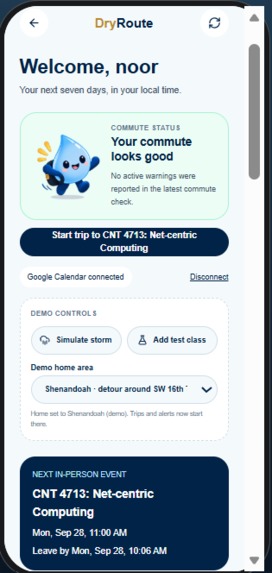
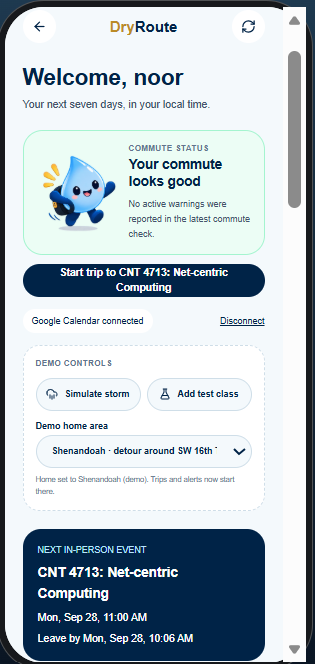
Home screen
-
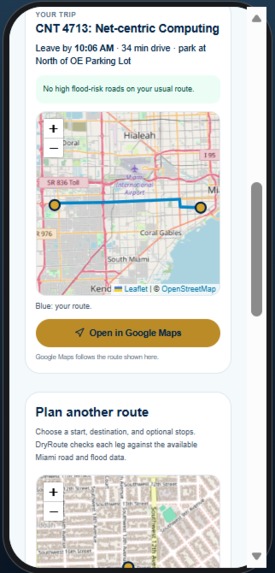
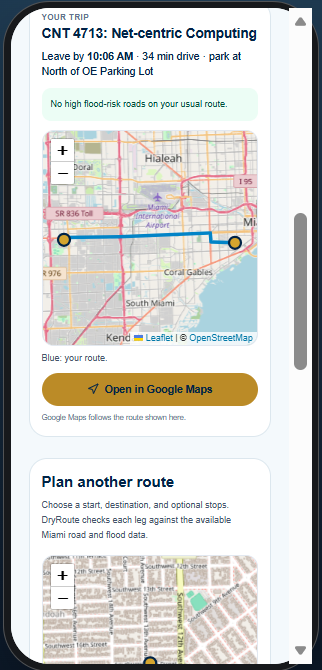
Routing screen
Inspiration
Have you had to drive anywhere in South Florida these past few weeks? If you have, you know the rain has been TERRIBLE and the flooding is even worse. Driving and parking in these Titanic-esque conditions is NOT good for our cars, and it's just plain dangerous: in the U.S. about 574,000 crashes happen due to rain every year. Flooded roads also make South Florida's already brutal traffic even worse, so we're always running late, and as students we can't afford to miss class or show up late.
So we asked: what if your navigation app knew which streets were about to flood before you left, and planned around your class schedule?
What it does
DryRoute is a mobile web app that gets FIU students to class on time without driving through flooded streets.
- Reads your schedule. Connect Google Calendar, or paste an iCal link or upload an .ics file. DryRoute finds your next in-person class and works out which FIU building it's in from the event location.
- Scores every road for flood risk. Our ML model scores about 36,000 road segments between FIU and Downtown/Brickell using today's rainfall forecast and flags the ones likely to flood.
- Plans a flood-safer route. It compares your usual fastest route with one that avoids high-risk streets and active construction, then recommends which one to take.
- Picks where to park. We mapped flood exposure for all 46 FIU parking lots and garages using 1-meter lidar elevation data. If your usual lot tends to pond, DryRoute suggests a drier one.
- Tells you when to leave. Your leave-by time accounts for drive time with live traffic, time to find a spot, and the walk from the lot to your building.
- Warns you in plain English. You get alerts about flooded streets on your route, parking, traffic and closures, plus optional National Weather Service flood alerts and high-tide warnings.
- One tap to drive. "Open in Google Maps" sends the flood-safer route straight to Google Maps.
How we built it
Data & GIS (Python, GeoPandas, OSMnx, rasterio, pysheds)
- Pulled the drivable OpenStreetMap road network between FIU and Brickell: 36,371 road segments (about 23,000 streets).
- Enriched every segment with FEMA flood zones, USGS elevation, ponding depth (low spots where water collects, computed from the elevation model), 33,000 Miami-Dade storm drain inlets, the county's 2060 design flood level, and 2,807 City of Miami and Miami-Dade 311 flooding complaints matched to the nearest road.
- Used a 1-meter lidar elevation model of FIU to find 166 spots where water pools on campus and score every parking lot.
- Added planned county construction as road closures.
- Loaded everything into MongoDB Atlas with geospatial indexes.
Machine learning (scikit-learn)
- No dataset says "this road flooded today," so we trained on 311 flood reports. Each street-day is labeled by whether someone reported flooding there, then combined with that day's rain, the previous days' rain (Open-Meteo), terrain features and the street's history of past reports.
- Compared logistic regression and gradient boosting across rolling time windows. Gradient boosting won.
- Tested on 4.4 million street-days the model never saw, from later dates and from streets held out of training entirely: ROC-AUC of 0.81 to 0.83, and average precision 13 to 17 times a random baseline.
- A scheduled job scores the whole network from the live forecast and publishes the results to Atlas every hour.
Backend (FastAPI)
- Routing runs on the road graph with NetworkX. The usual route is the fastest one. The safer route adds a cost for flood risk and a heavy penalty for high-risk roads, skips fully closed roads and slows down through roadwork.
- TomTom for traffic-aware drive times, plus the NWS alerts API and NOAA's Virginia Key tide gauge for live conditions.
- Google Calendar (OAuth) and iCal import, matched against FIU building names and codes.
Frontend (React, TypeScript, Vite, Tailwind, Leaflet)
- A mobile-first web app with a map comparing your usual route to the flood-safer one.
Deployment: the frontend and backend run as two Vercel projects. The frontend proxies the API so everything is served from one domain.
Challenges we ran into
- Nobody records when a road floods. There's no dataset saying "this street was underwater on this day." The closest thing is 311 flood complaints, and even those were thinner than advertised. The City of Miami's "311 Service Requests Since 2015" dataset only covers Oct 2022 to Aug 2024, and the county's public data stops at 2023. Flooding reports are also rare, about 1 for every 6,500 street-days. A model that always said "dry" would be 99.98% accurate and completely useless.
- Not cheating by accident. Storms produce reports several days in a row, so a naive "past reports" feature leaks the answer. We only count reports from more than a week earlier, held out entire streets for testing and chose models across rolling time windows after we found one validation score depended on a single report.
- Bridges looked like the most flood-prone roads in Miami. Elevation data reads the water under a bridge deck, and OpenStreetMap had merged bridges with their approach roads. We split the network wherever a bridge starts or ends and capped bridge scores. FIU had a similar problem: our first ponding map filled the campus lakes and marked 23% of campus as 2-meter-deep "hotspots." Treating the lakes as drains fixed it, which matches reality, since they're stormwater retention ponds.
- Keeping road IDs in sync. The routing graph, the ML output and the database all had to share the same road IDs. Re-downloading OpenStreetMap changes every one of them, so we froze the graph.
- Deploying for free. Vercel caps Python bundles at 500 MB (ours is about 465 MB), serverless functions forget everything between requests, and Safari blocks cookies between two separate vercel.app sites. We moved calendar sessions and demo state into MongoDB Atlas, proxied the API through the frontend's domain and moved the ML model out of the backend: it runs on its own and publishes scores to Atlas. Google OAuth in testing mode only lets approved test users sign in, so we added iCal import so anyone can try the app.
Accomplishments that we're proud of
- A real flood model trained on real Miami data, not a hardcoded demo, and it holds up on streets it never saw during training.
- Every drivable road between FIU and Brickell enriched with FEMA, USGS, Miami-Dade and City of Miami data.
- The full loop works end to end: calendar → building → parking lot → flood-safer route → leave-by time → Google Maps.
- A campus-level parking flood analysis. 311 doesn't cover FIU's campus, so we built it from lidar terrain data.
What we learned
- For rare events, accuracy is misleading. Precision, recall and average precision tell the real story, and data leakage is easy to miss.
- No report doesn't mean a dry road. 311 data shows where people call in, which skews toward residential streets over highways.
- A lot of GIS: coordinate systems, elevation models and how the Miami Rock Ridge keeps Brickell and Coral Gables high while FIU and the airport sit low.
What's next for DryRoute
- Driver reports. Let users mark a street "flooded" or "clear" to give us real ground truth and cover the highways that 311 misses.
- A bigger map. Expand west to Kendall, Doral, Sweetwater and Westchester, where many FIU commuters live, then add other campuses and flood-prone cities.
- Live FDOT road closures through FL511.
Built With
- fastapi
- geopandas
- gis
- leaflet.js
- mongodb
- oauth
- osmnx
- python
- rasterio
- react
- scikit-learn
- tailwind
- typescript
- vercel
- vite


Log in or sign up for Devpost to join the conversation.