-

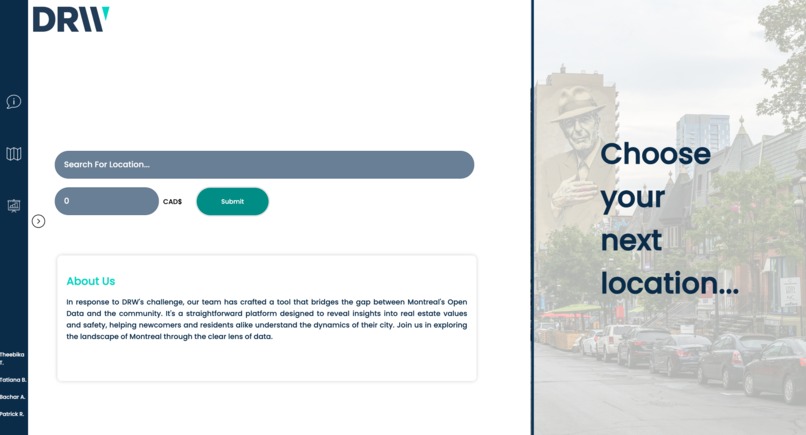
Main page
-
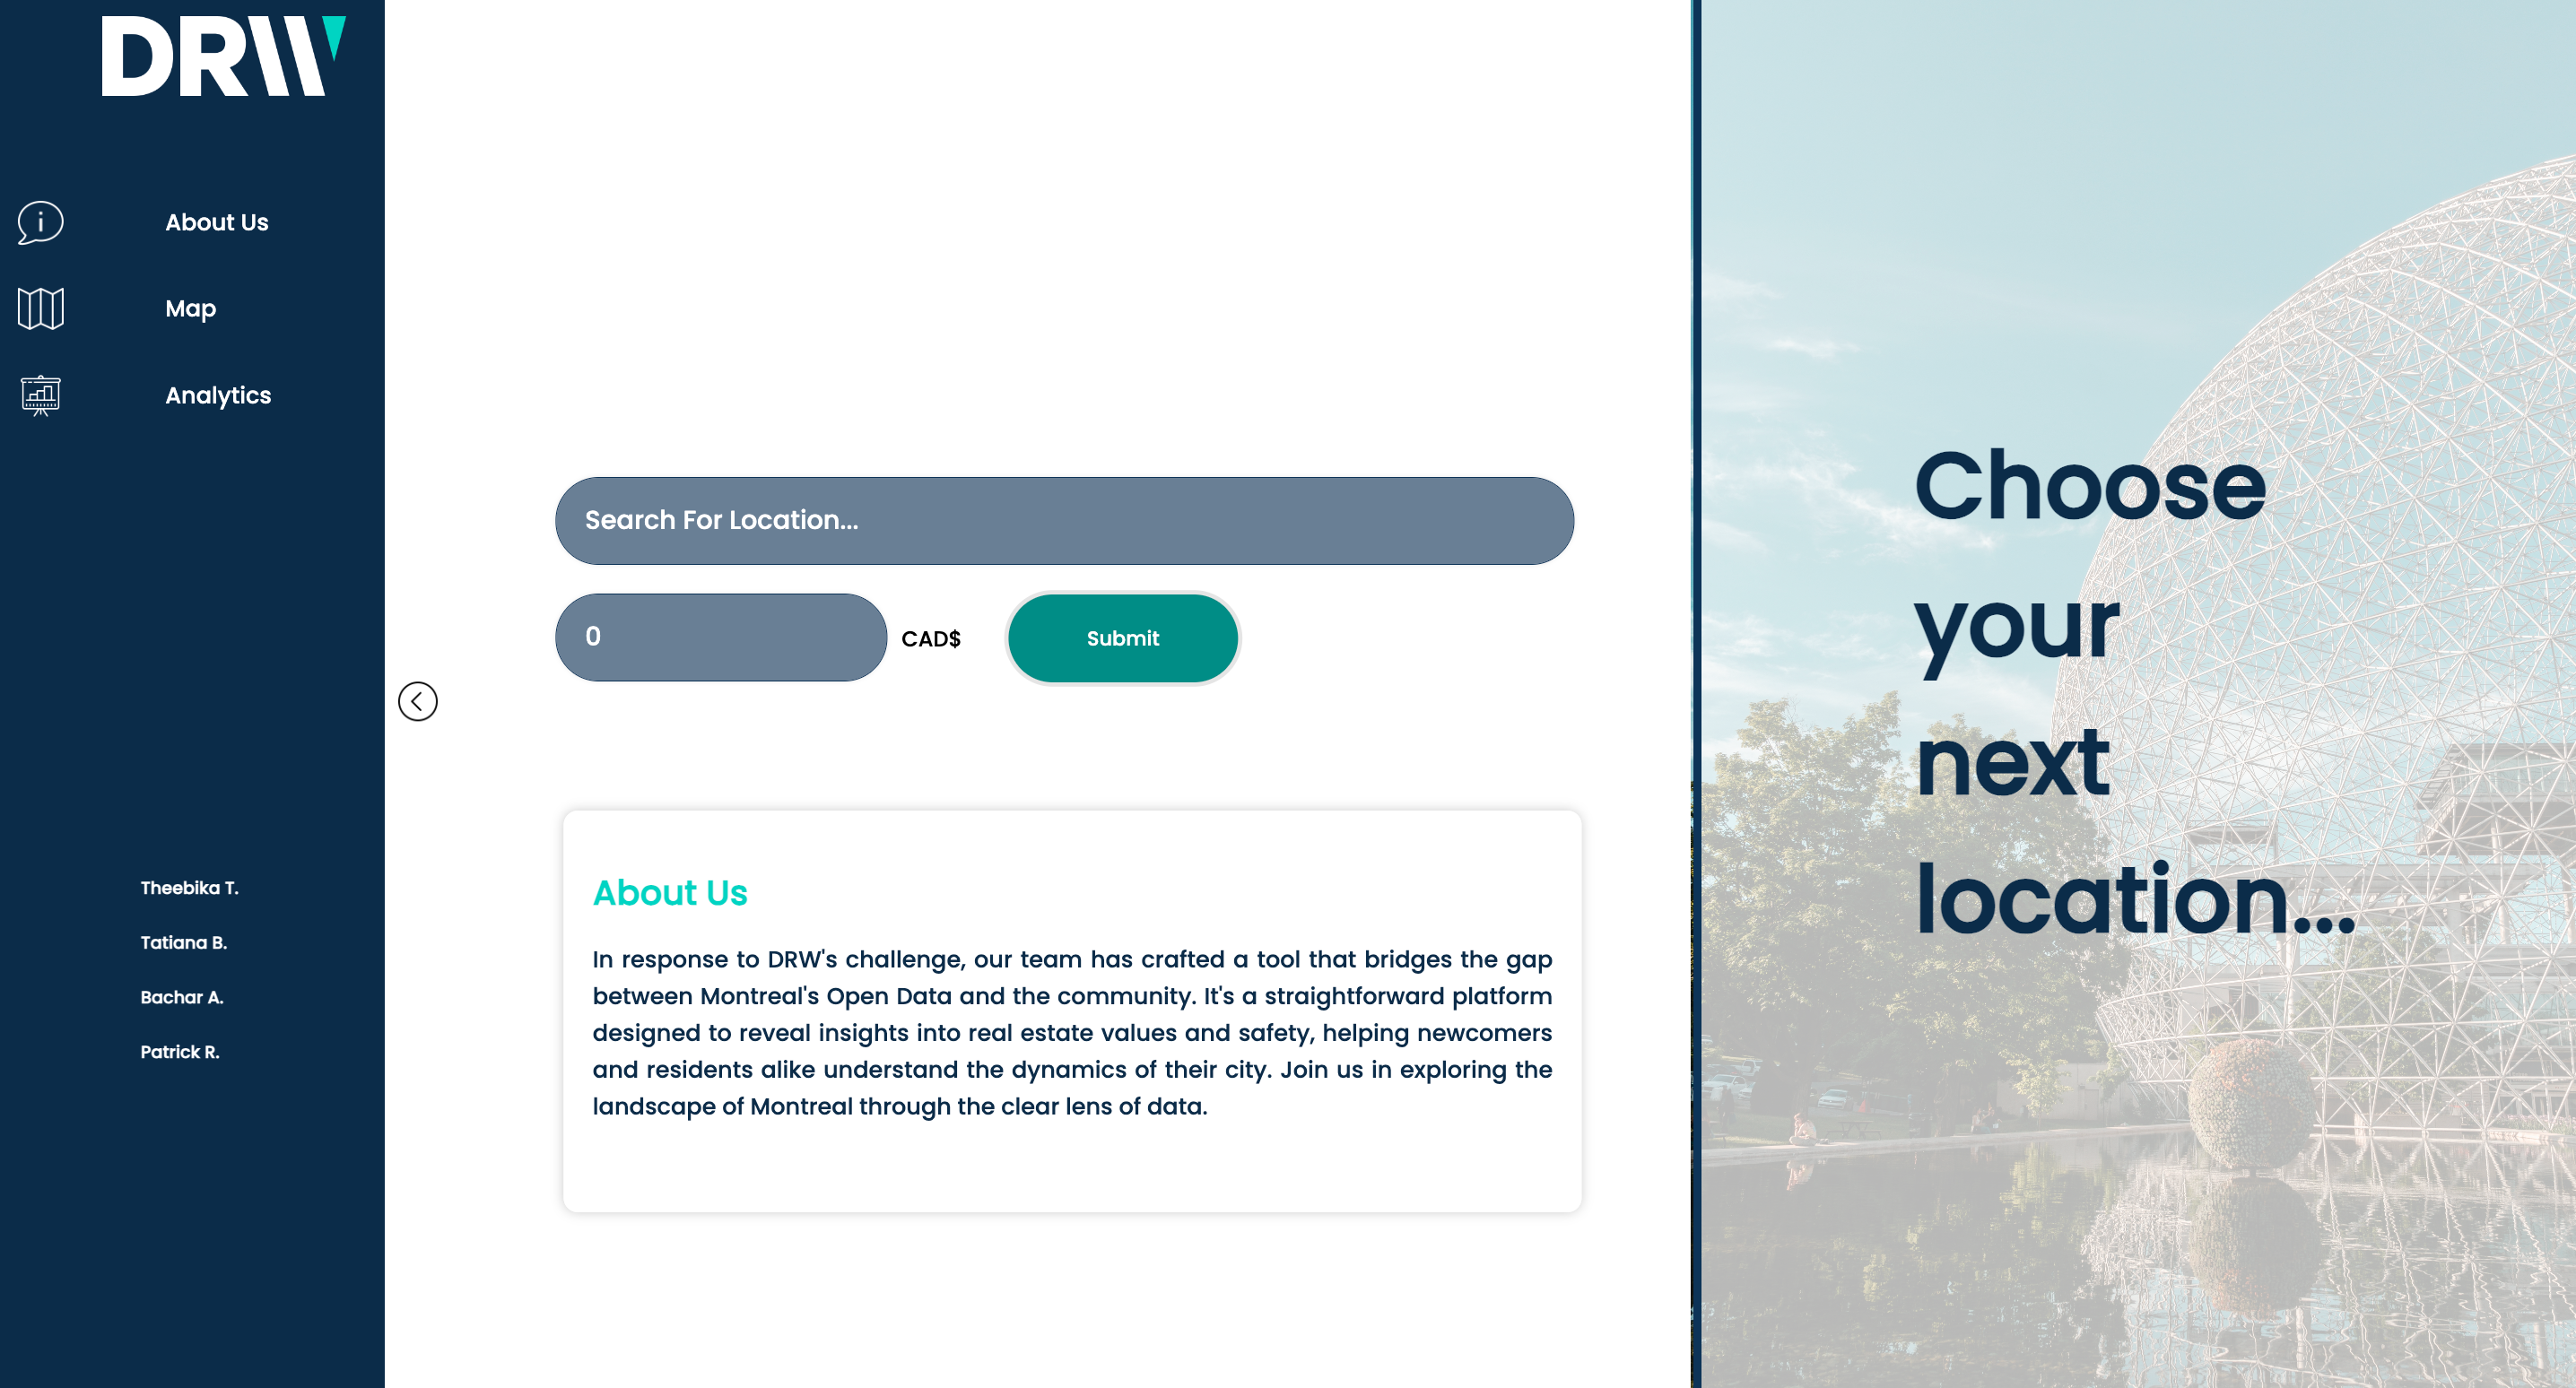
Another view of the main page
-

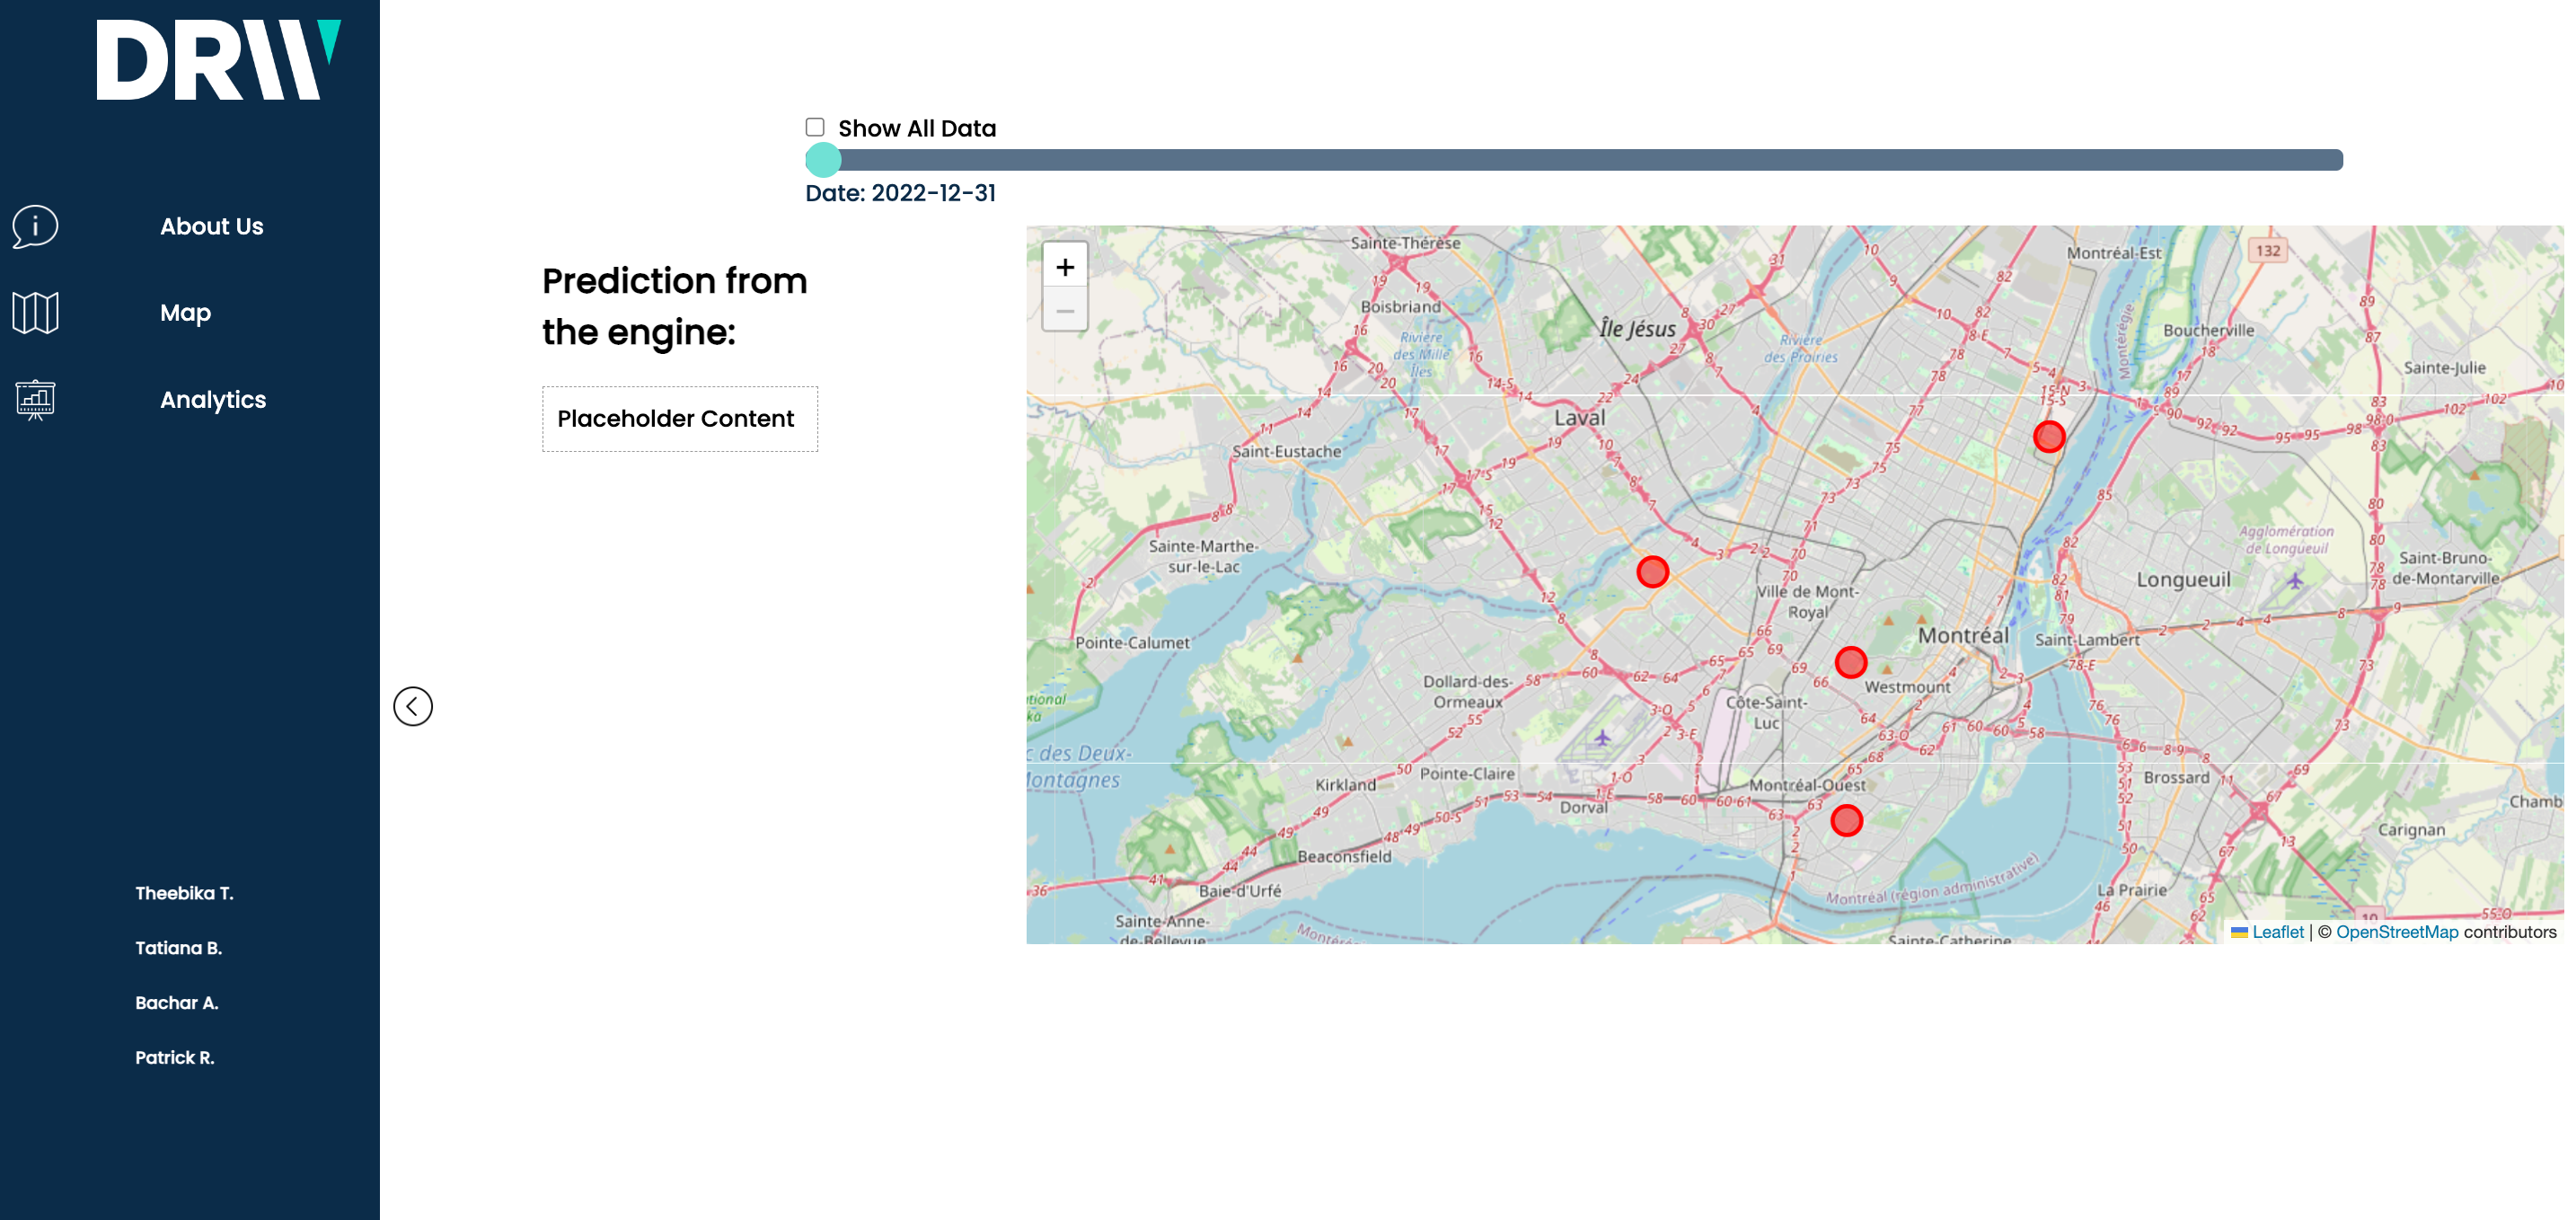
Montreal Map file with crime rates and prediction from ML
-
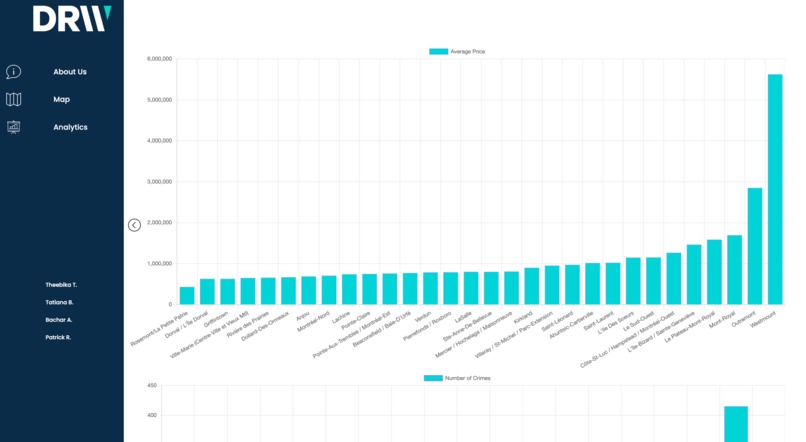
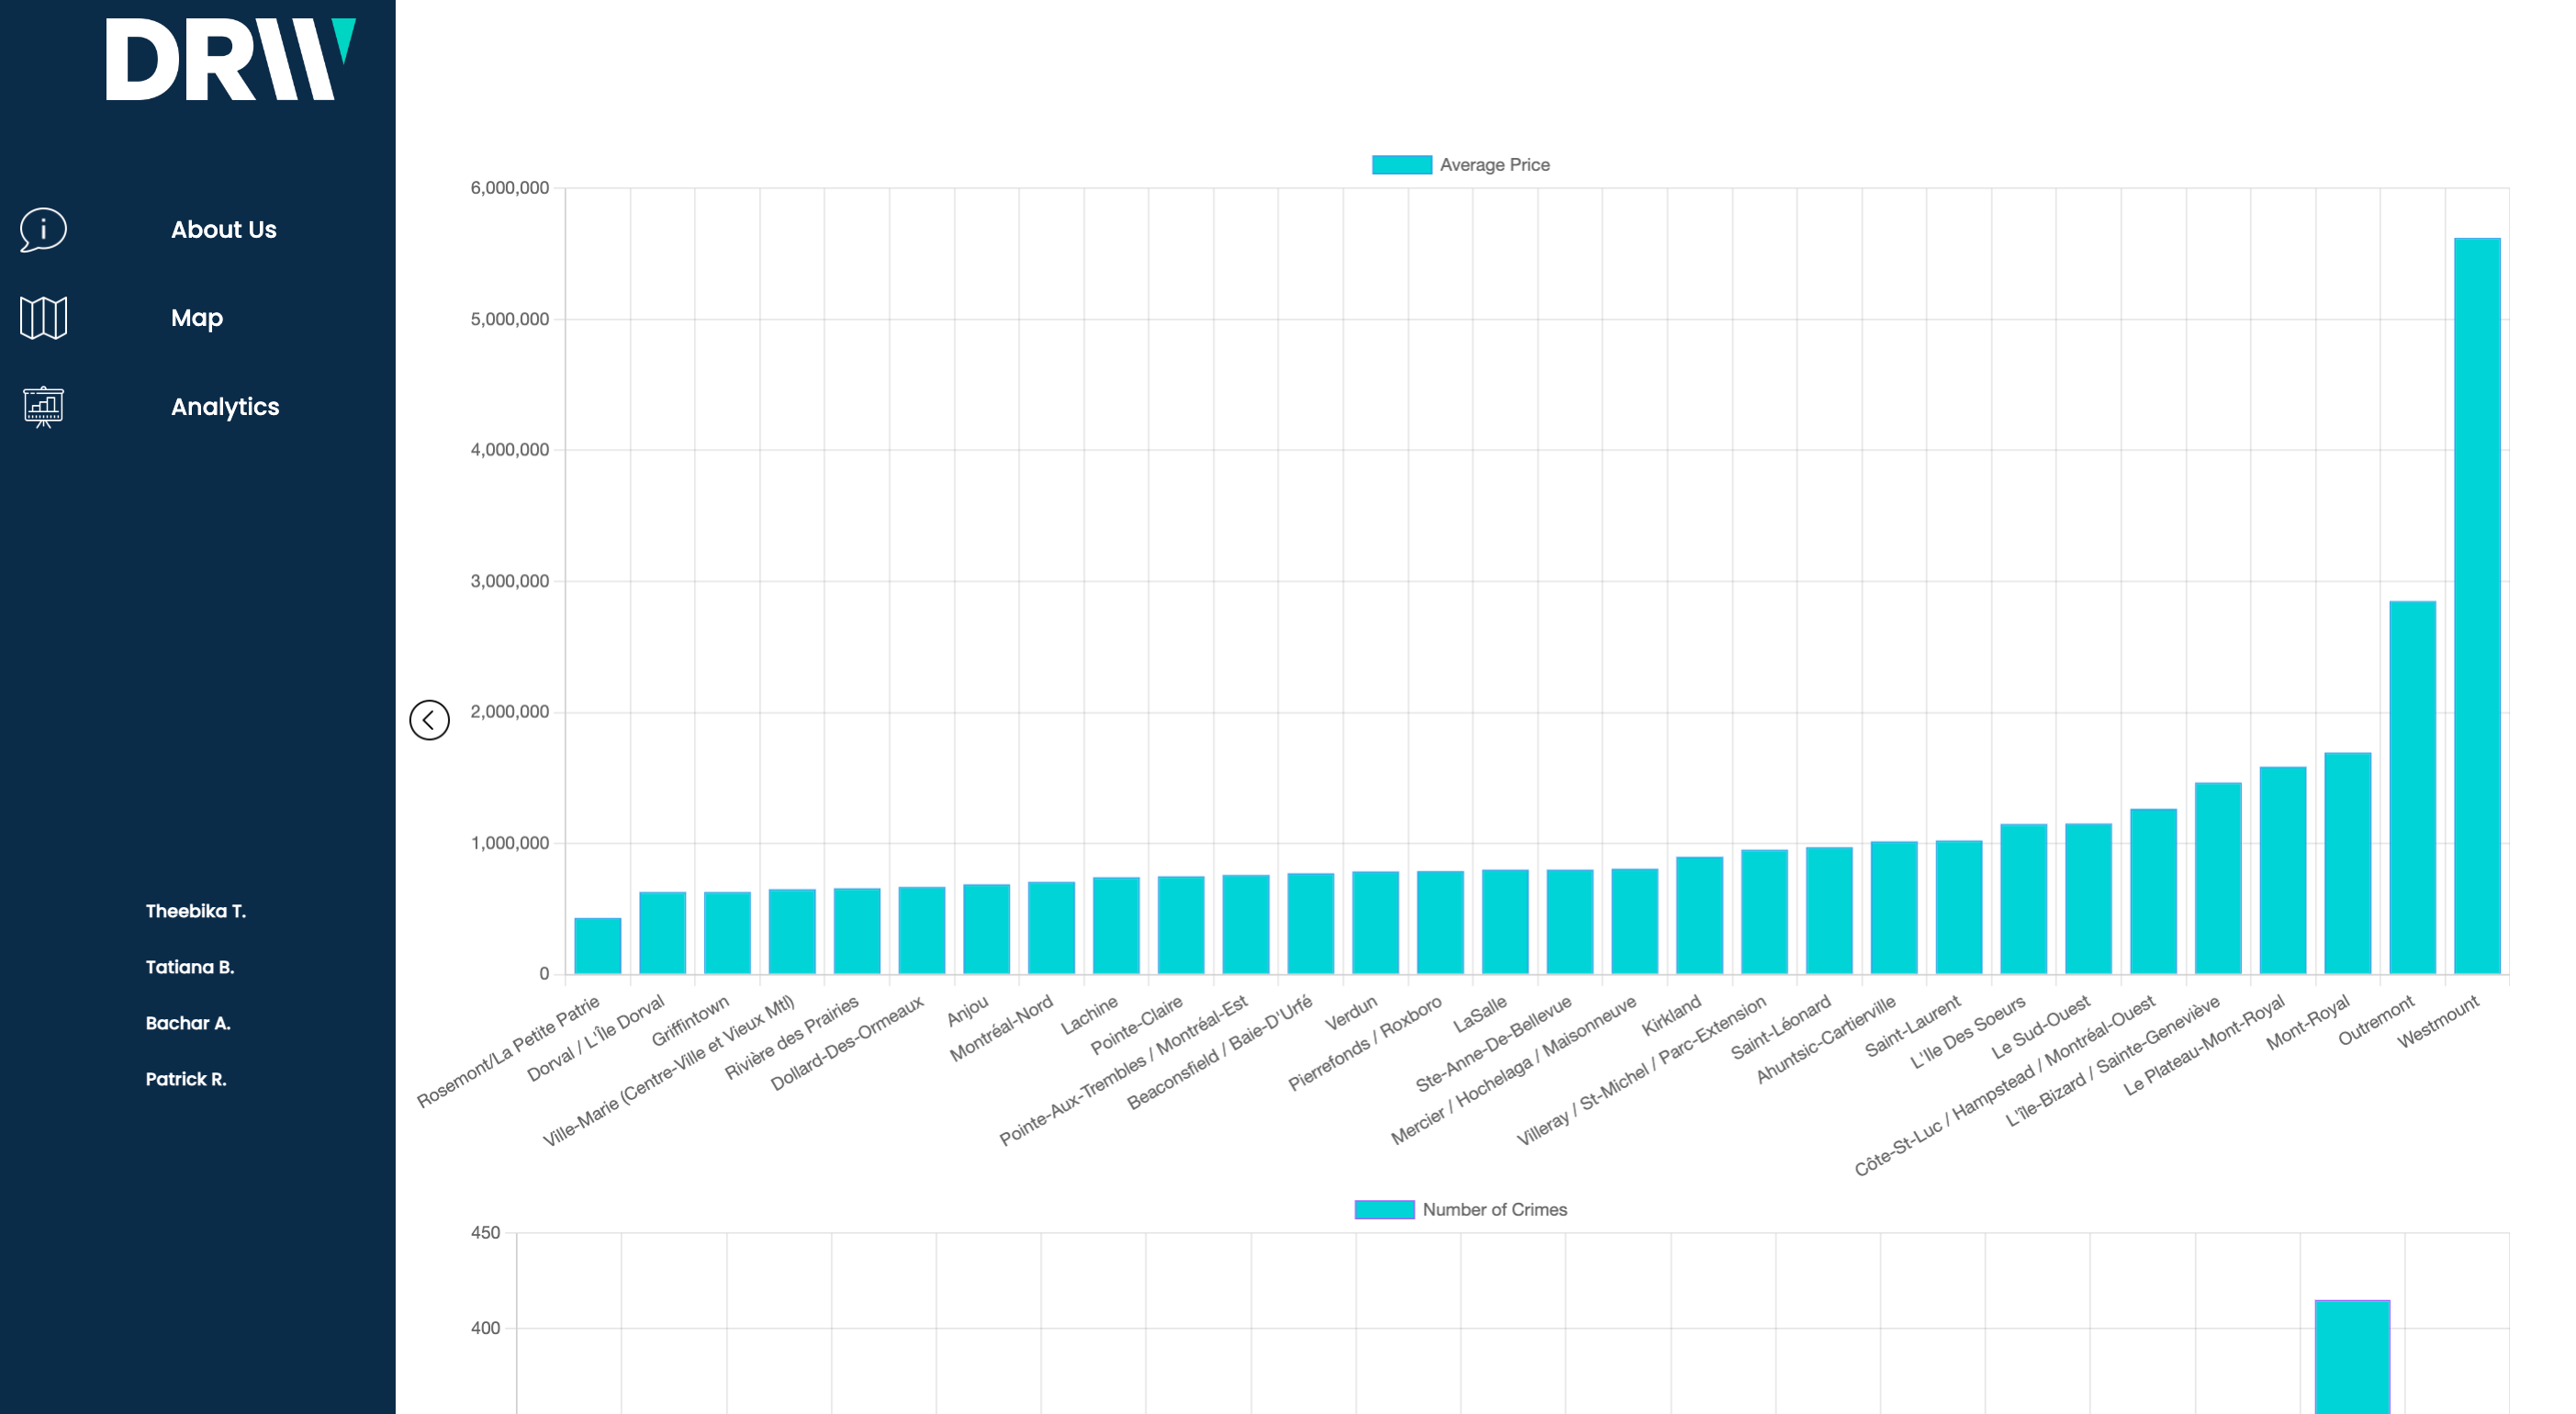
Analytics where it has two graphs: average house price for the specific region and number of crimes in the specific region

Inspiration
We were interested on doing the hackathon for DRW. When we read the challenge, we realized that we wanted to work on datas with unusual relations.
What it does
This project is a web interface that helps real estate investors to visualize the price market through time in relation to crime that has occurred around the city of Montreal for 2023-2024. This tool assists in forecasting market fluctuations and provides information to help choose the best places to live and invest.
How we built it
We used React.js for front end and Flask to connect the Python model that we developed with the front end react. For the databases, we used a total of three datasets where the crime datasets were found from the Montreal open data website and the others were outsources. link link
Challenges we ran into
- We had issues in debugging so we used AI to help us solve our problems. Thanks to AI we were able to finish the project succesfully. -Staying awake the next day after staying up the whole night was a challenge as well
Accomplishments that we're proud of
- We are proud of our User Interface
- We got a high prediction accuracy of 92% for detecting the best choice for investment depending on the crimes and the prices within the region
What we learned
- We learned React, Flask, data analysis...
What's next for DRW - Real Estate Investment Montreal
- Add extra datasets to improve relation between housing and transportation (for example, adding metro station on the map, bixe stations,...)


Log in or sign up for Devpost to join the conversation.