-
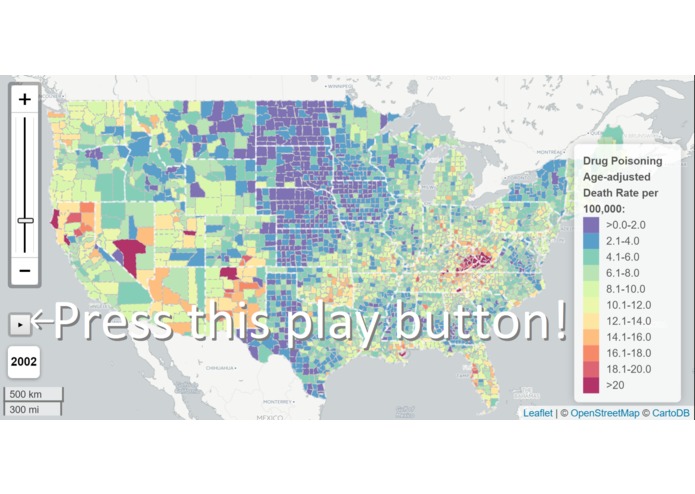
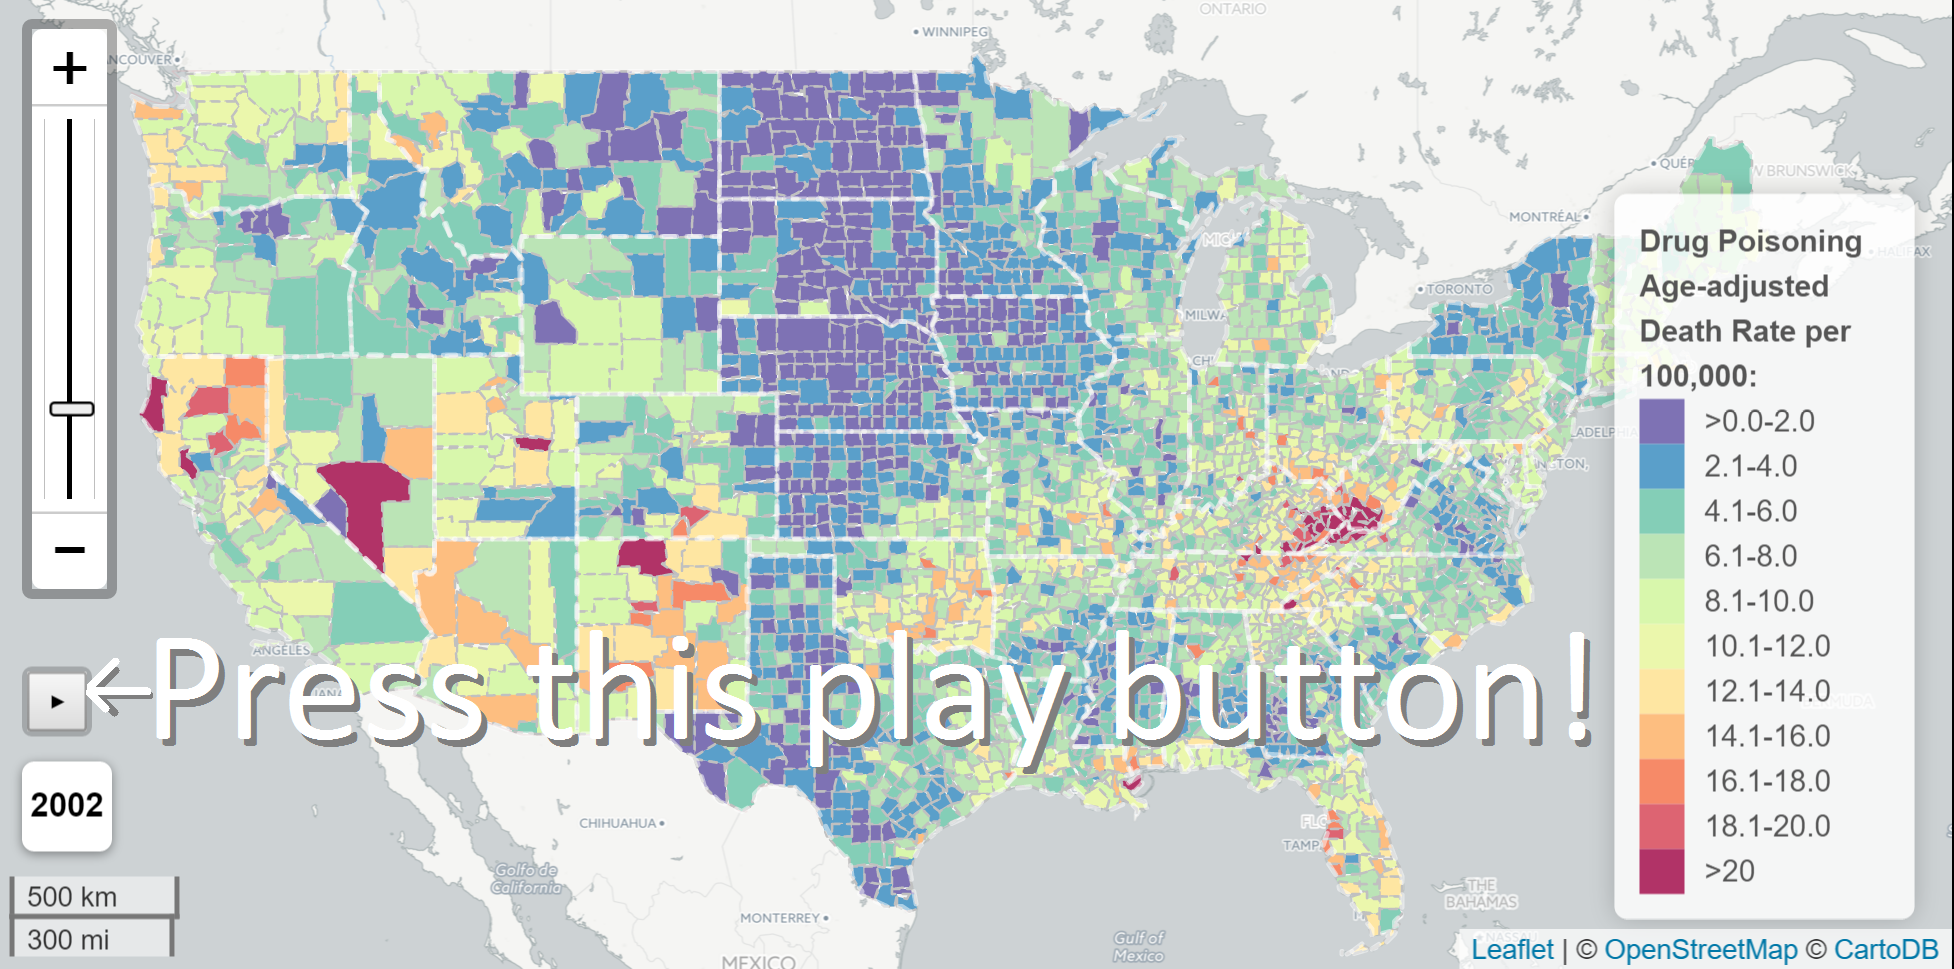
Screenshot
Inspiration
Google Maps, OpenStreetMap, Leaflet.js
What it does
Animated visualization of mortality related to drug poisonings in the United States between 2002-2014 based on data from the CDC.
Just press play!
How we built it
Leaflet.js Teamwork Coffee https://github.com/ezatpsc/midas-viz-hackathon
Challenges we ran into
Unfinished leaflet.js plugins
Accomplishments that we're proud of
Teamwork Performance Mobile-readiness
What we learned
Leaflet.js, GeoJSON
What's next
Splitting $3000 and a laptop


Log in or sign up for Devpost to join the conversation.