-
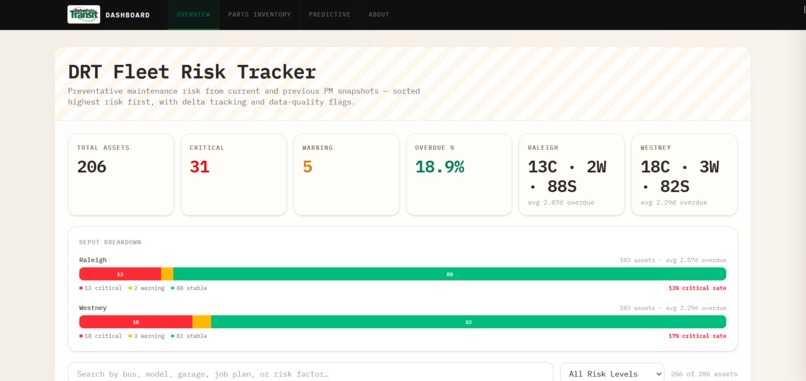
Main Dashboard View

Inspiration
Discussed Challenges faced by the maintenance team from DRT(Durham Region Transit) with Clinton. We discovered that he personally keeps tracks of the inventory and scheduling preventative maintenance on pen and paper. This gave us the notion to make his life easier.
What it does
Our web application solves his issue by tracking, notifying, and predicting inventory needs and part quality based on several factors. These factors includes; missed maintenance, weather, age, part quality, location, exceeding tolerance level, and bus models.
How we built it
We used React + Next.js Framework to create a dynamic and useful interface that allows anyone to visually understand the data presented. Specifically using badges to allow certain data to stand out when things are critical. Marking them as highly urgent and important. Provided CSV and Excel data sets including additional mock data we generated for demonstration purposes.
Challenges we ran into
- Setting up SMS text notifications
- Integrating new features to improve the overall application
- Fully understanding the Data/CSV files
- Missing Data from aspects we wanted to track/include
Accomplishments that we're proud of
Visual Presentation and overall user experience. A very positive collaborative environment. Working with open and understanding individuals Creating Real world application relevant mock data to enrich the overall presentation and system.
What we learned
Benjamin Langhammer: Learned Typescript with integrated frameworks. Gained experience in digesting complex data and discovering trends
Julien Mongrain: Improved upon and practised; Team Collaboration, passing data between props, and passing project code between group members. Demystified/Elucidated complex project structure, and logic, into business intelligence.
Lucas Delvoie: Focusing on an MVP and achieving a demonstrable product over a perfectionist best practice model.
What's next for DRT - Prediction Model
Creating a back-end to start collecting real data for new datasets we want to collect to improve the overall structure and system. Understanding and creating new mock data. Adding multiple the ability to review multiple years to discover more trends and enrich prediction models.
Built With
- amazon-web-services
- amplify
- claude
- discord
- next
- react
- restful
- typescript

Log in or sign up for Devpost to join the conversation.