-
-

Logo
-

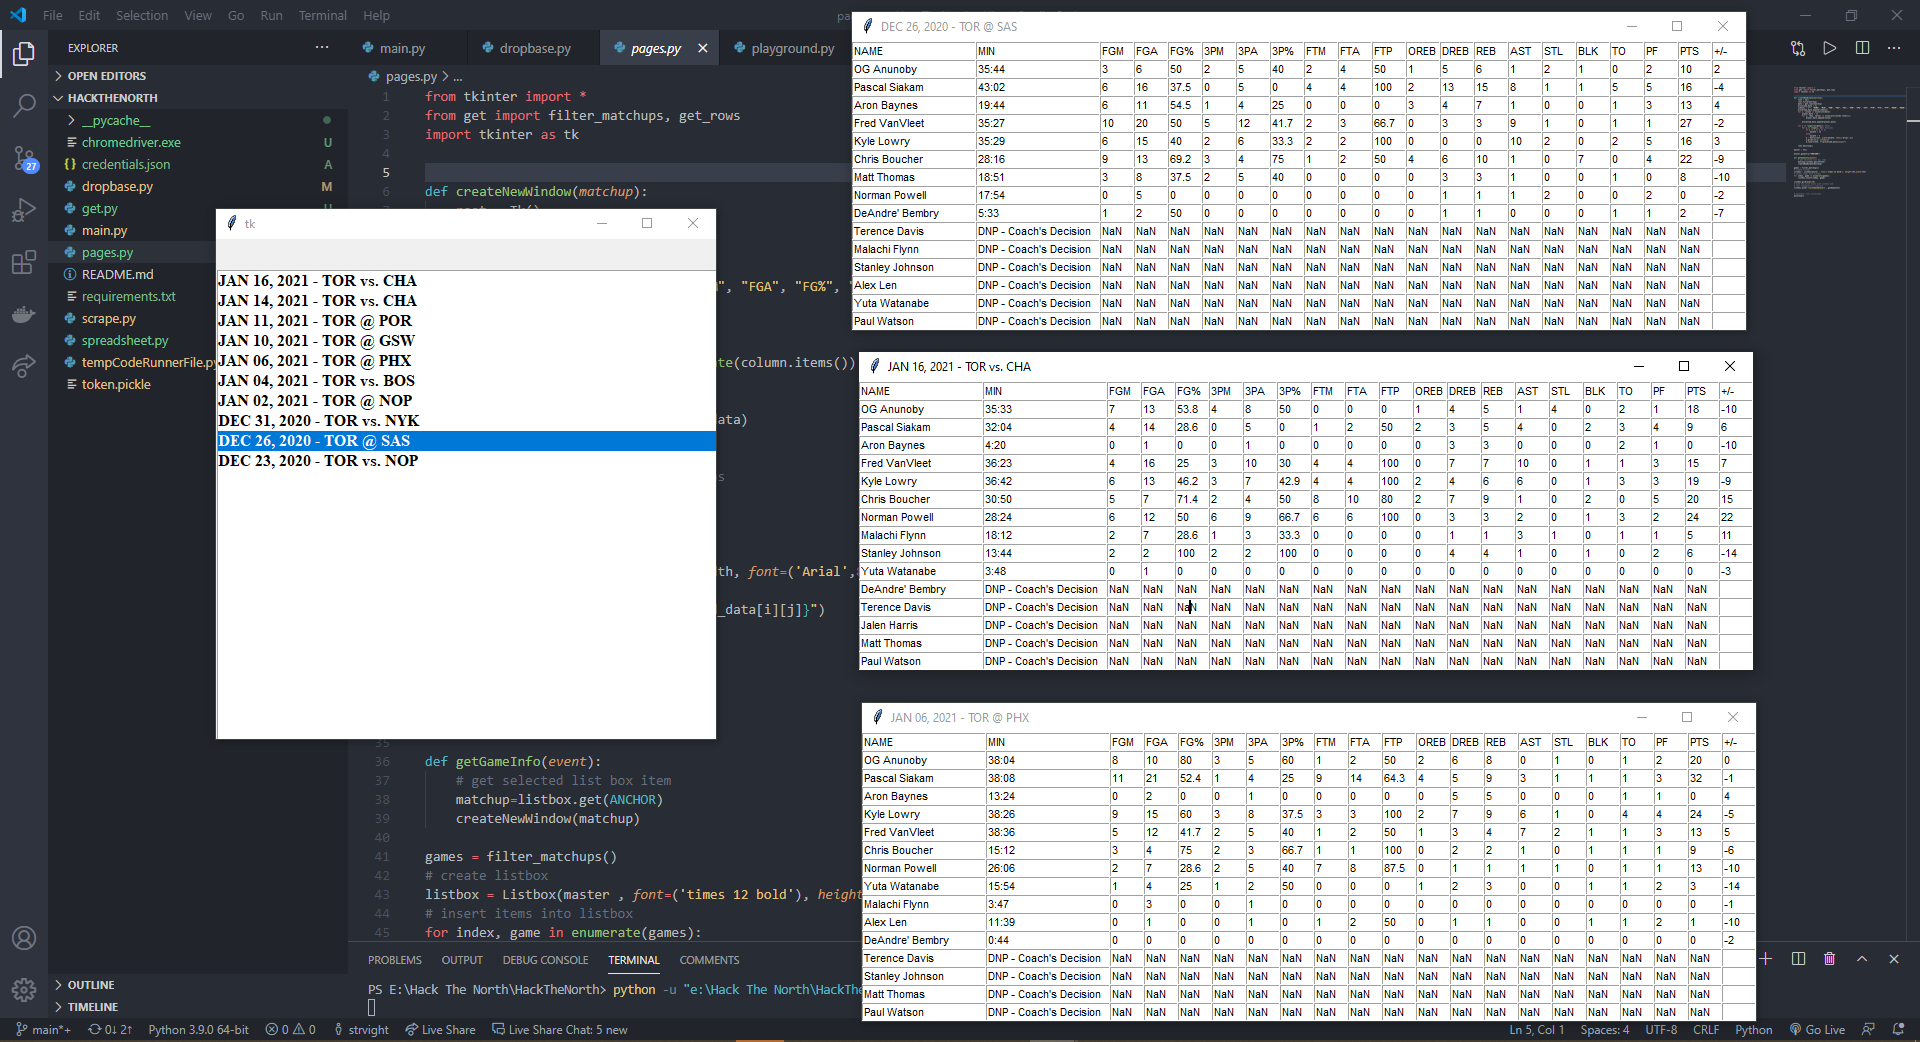
GUI using Tkinter

Inspiration
As basketball players and fans ourselves, we wanted an easy way to collect statistics of our favourite team, the Toronto Raptors and put this data onto a database. However, doing this by hand would take too long, but if we used web scraping combined with the Dropbase API, this process is as easy as bouncing a ball.
What it does
DropStats scraps the NBA website with all Toronto Raptors' games for all the stats of each player on the team for every single game played so far. This data is then uploaded to a Google Sheet using the Google Sheets API. This Google Sheet allows us to send a CSV file to Dropbase who converts it into a database with their API. We visualize the database with Tkinter, allowing users to view every game and every stat of each player on the team.
How we built it
This hack was built using python and two APIs (Dropbase and Google Sheets). We also used Selenium for web scraping and Tkinter to make the GUI.
Challenges we ran into
Well... as this was our first time using an API, we encountered many challenges with the two we used. However, the Dropbase team, as well as the workshop were very helpful. Also, we had many challenges with Tkinter as it was also new to us. As for web scraping, we were more experienced, however, we still had difficulties finding the correct path for certain elements on the page.
Accomplishments that we are proud of
GETTING IT TO WORK! We are also very proud of learning how to use APIs and Tkinter.
What we learned
We learned a lot about APIs and Tkinter.
What's next for DropStat
Plot/Visualize data and/or applying machine learning/predictions using data gathered.
Built With
- dropbase
- google-spreadsheets
- python
- tkinter


Log in or sign up for Devpost to join the conversation.