-
-
-
-
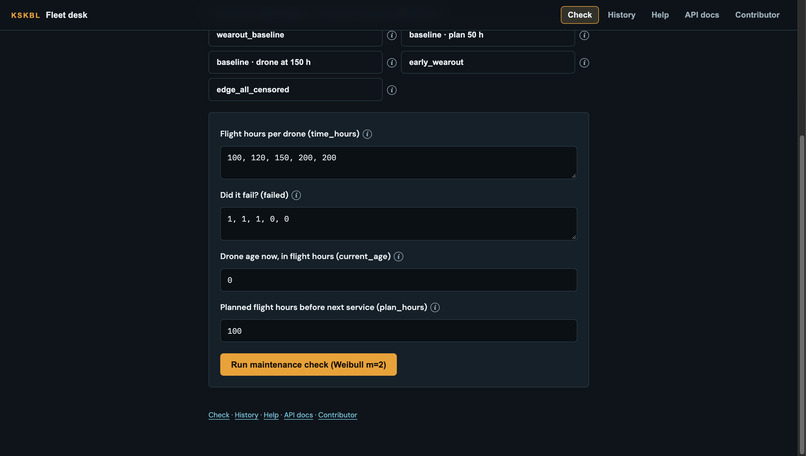
Baseline Reliability Analysis
-
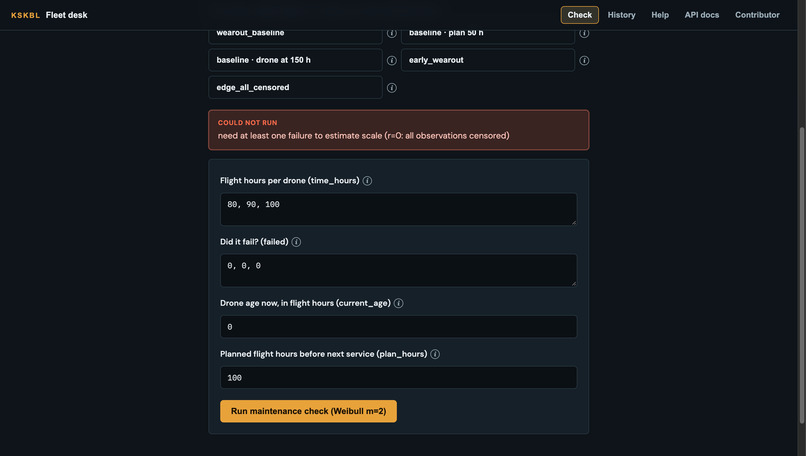
Input Validation and Error Handling
-
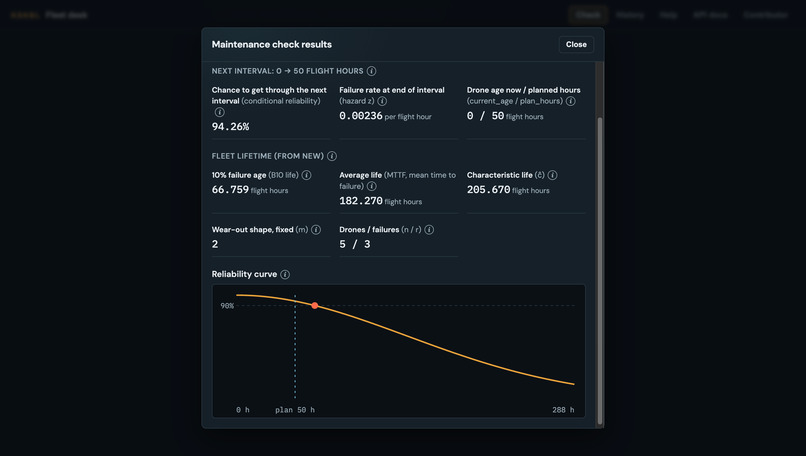
Reliability at Different Flight Horizons
-
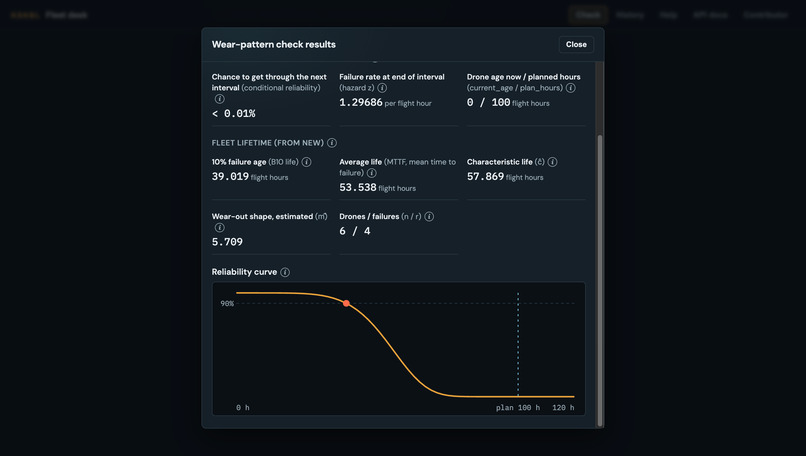
Weibull Shape Estimation
-
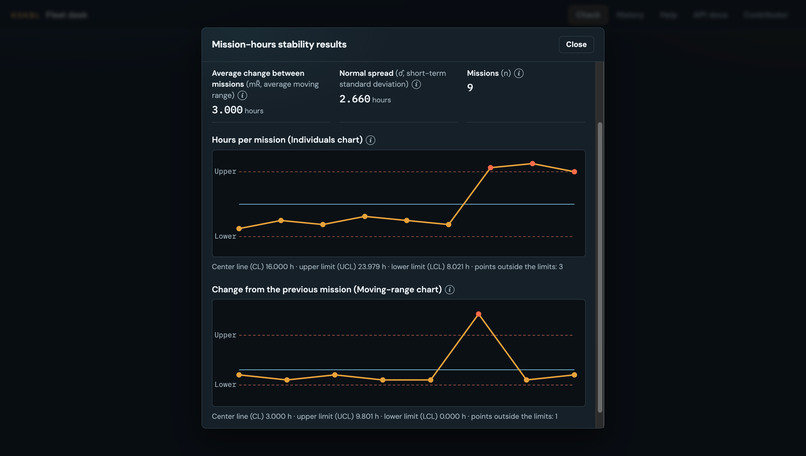
Mission Hours Stability Analysis
-
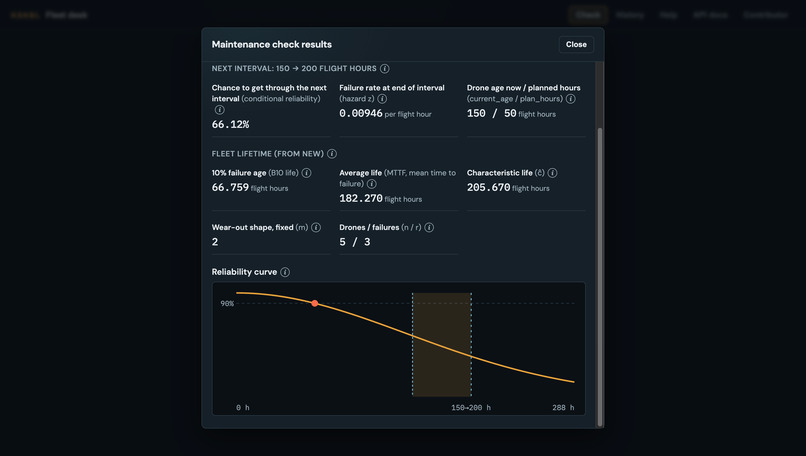
Reliability for Drones Already in Service
-
Inspiration
Drone failures discovered only after a crash can lead to equipment damage, delivery delays, and costly investigations. We wanted to explore how flight records and statistical reliability analysis could help maintenance teams identify potential risks before the next mission.
What it does
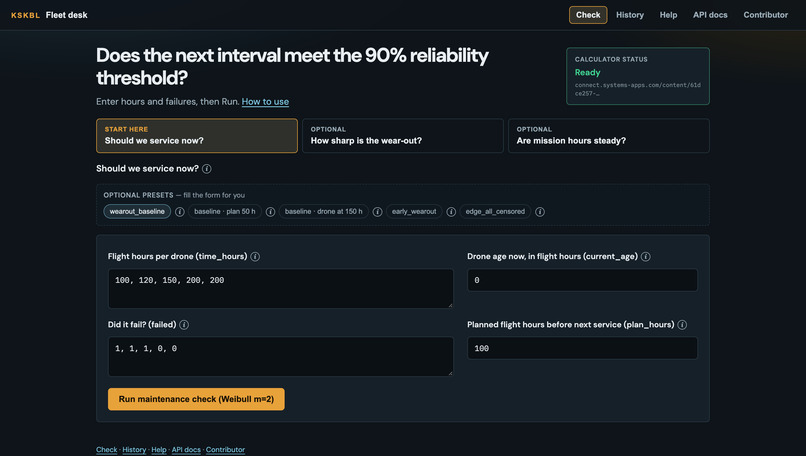
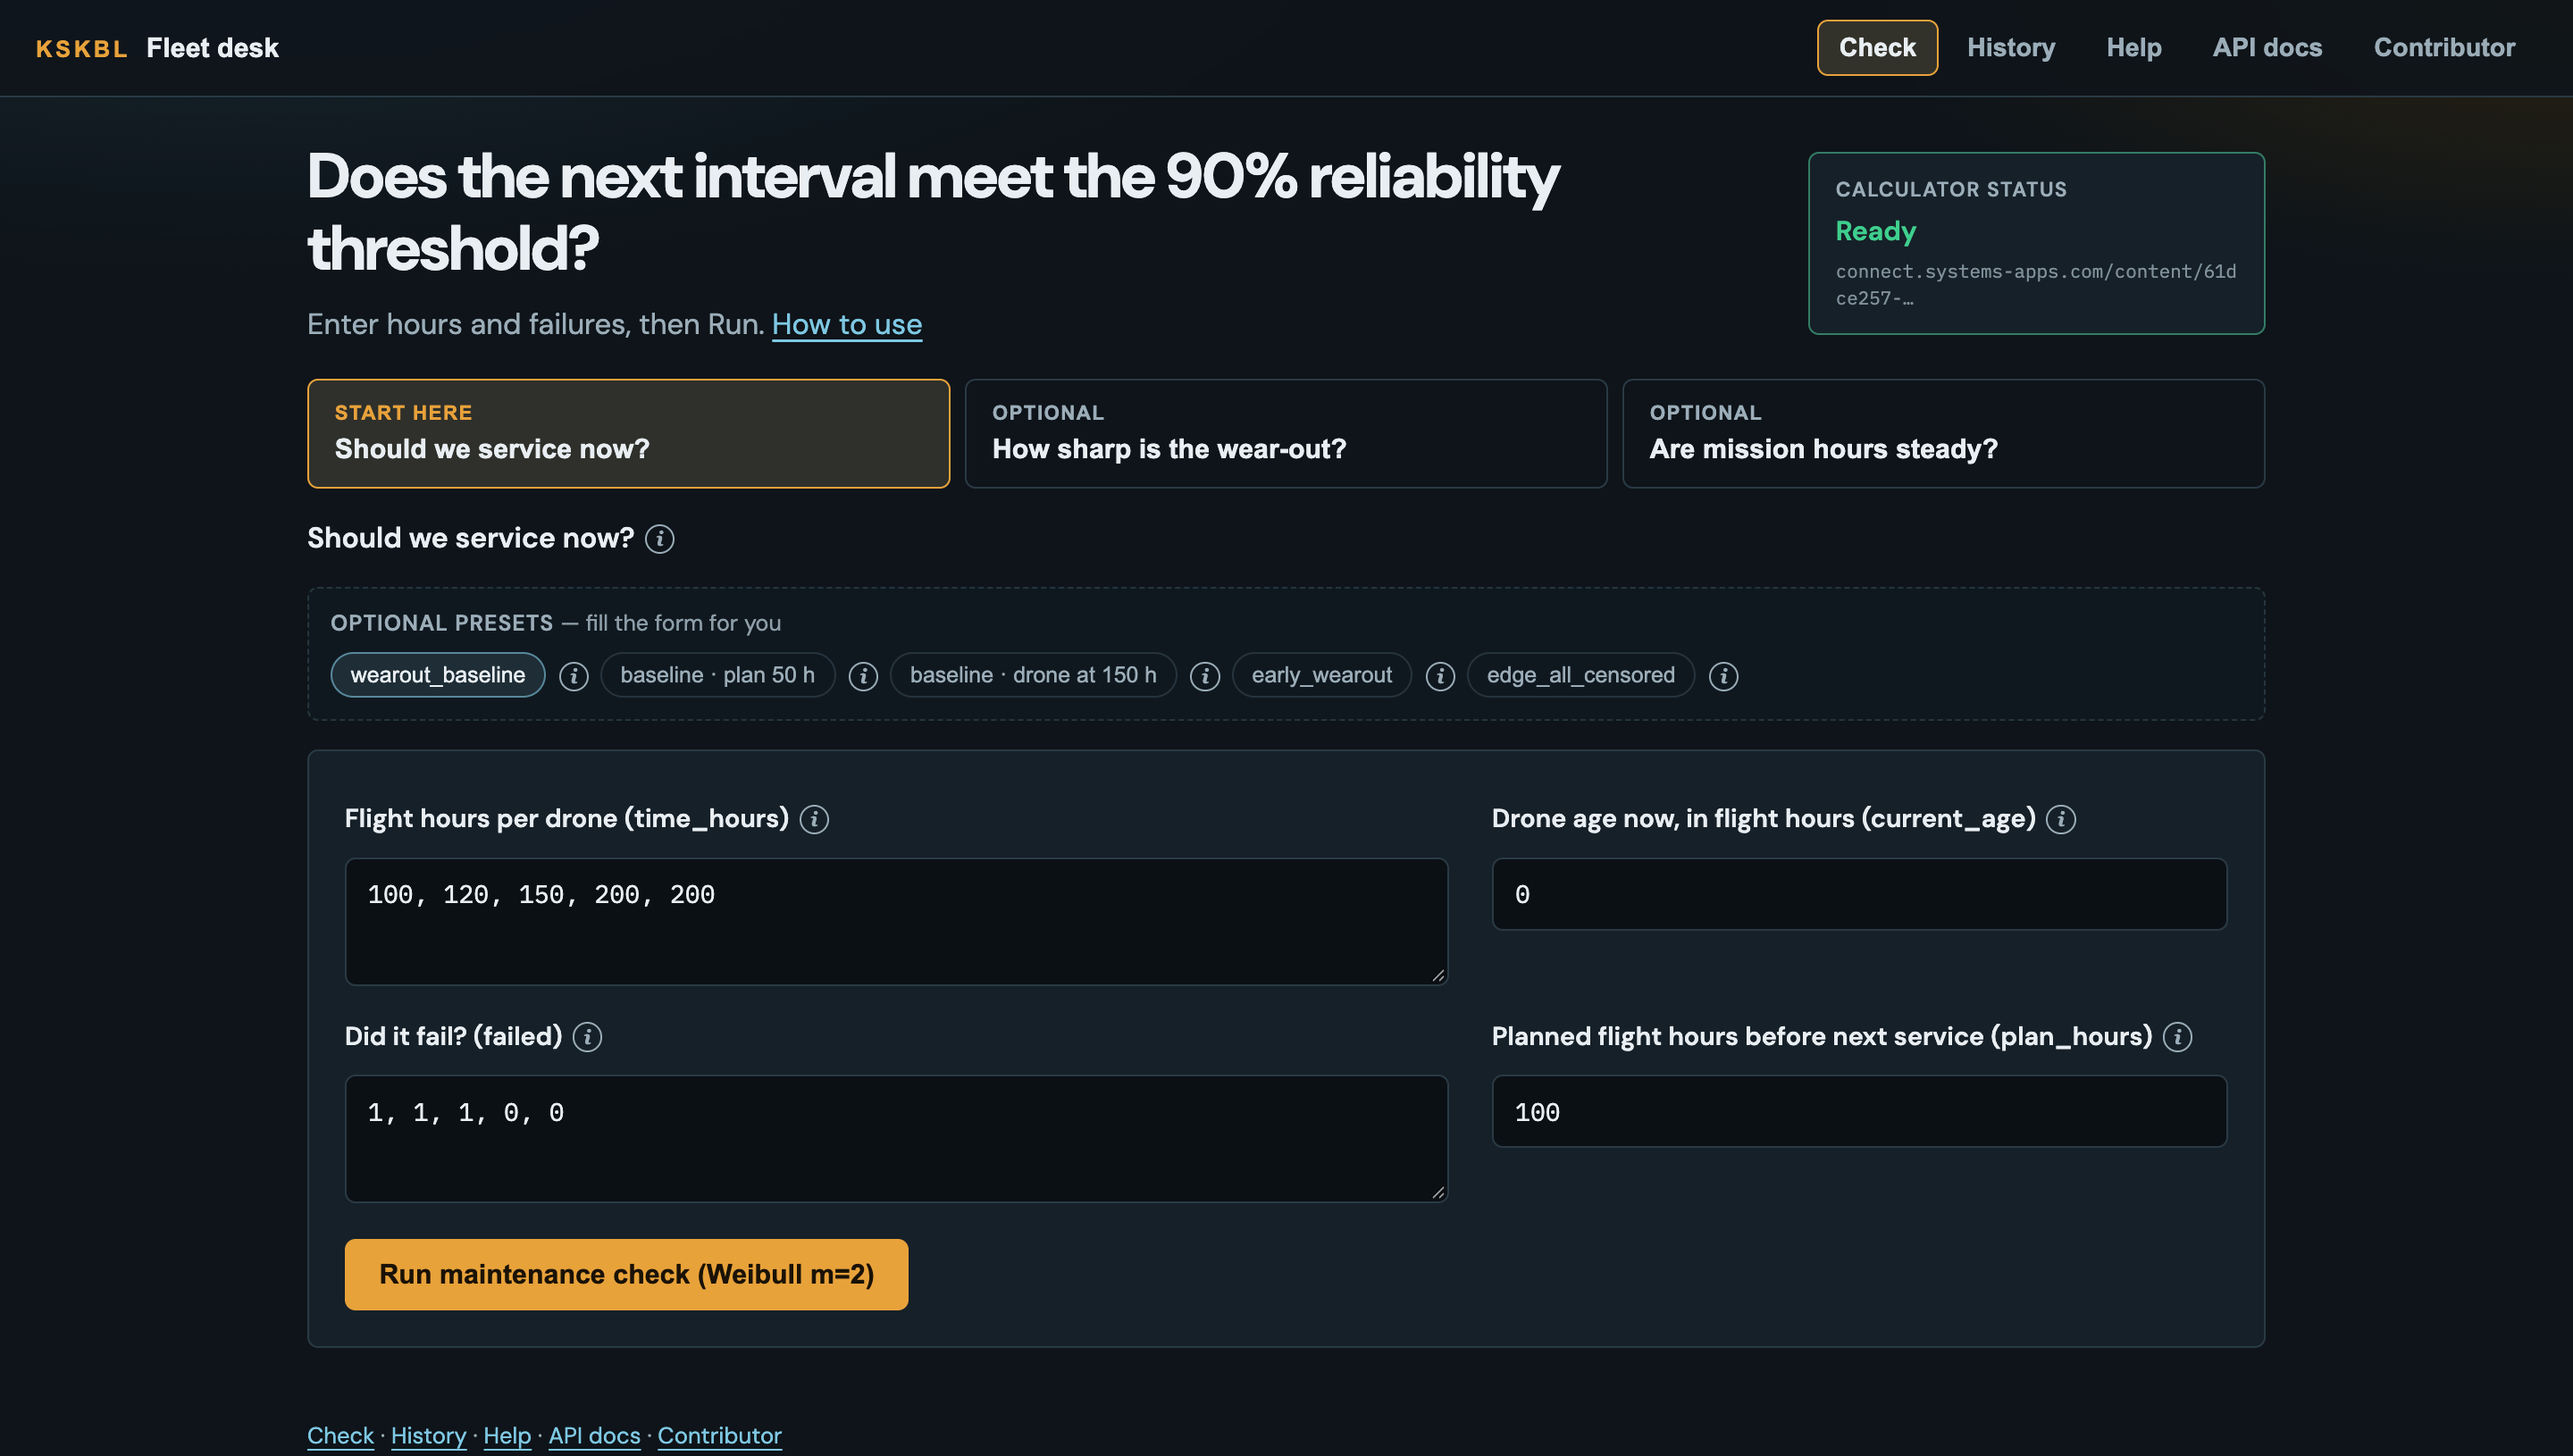
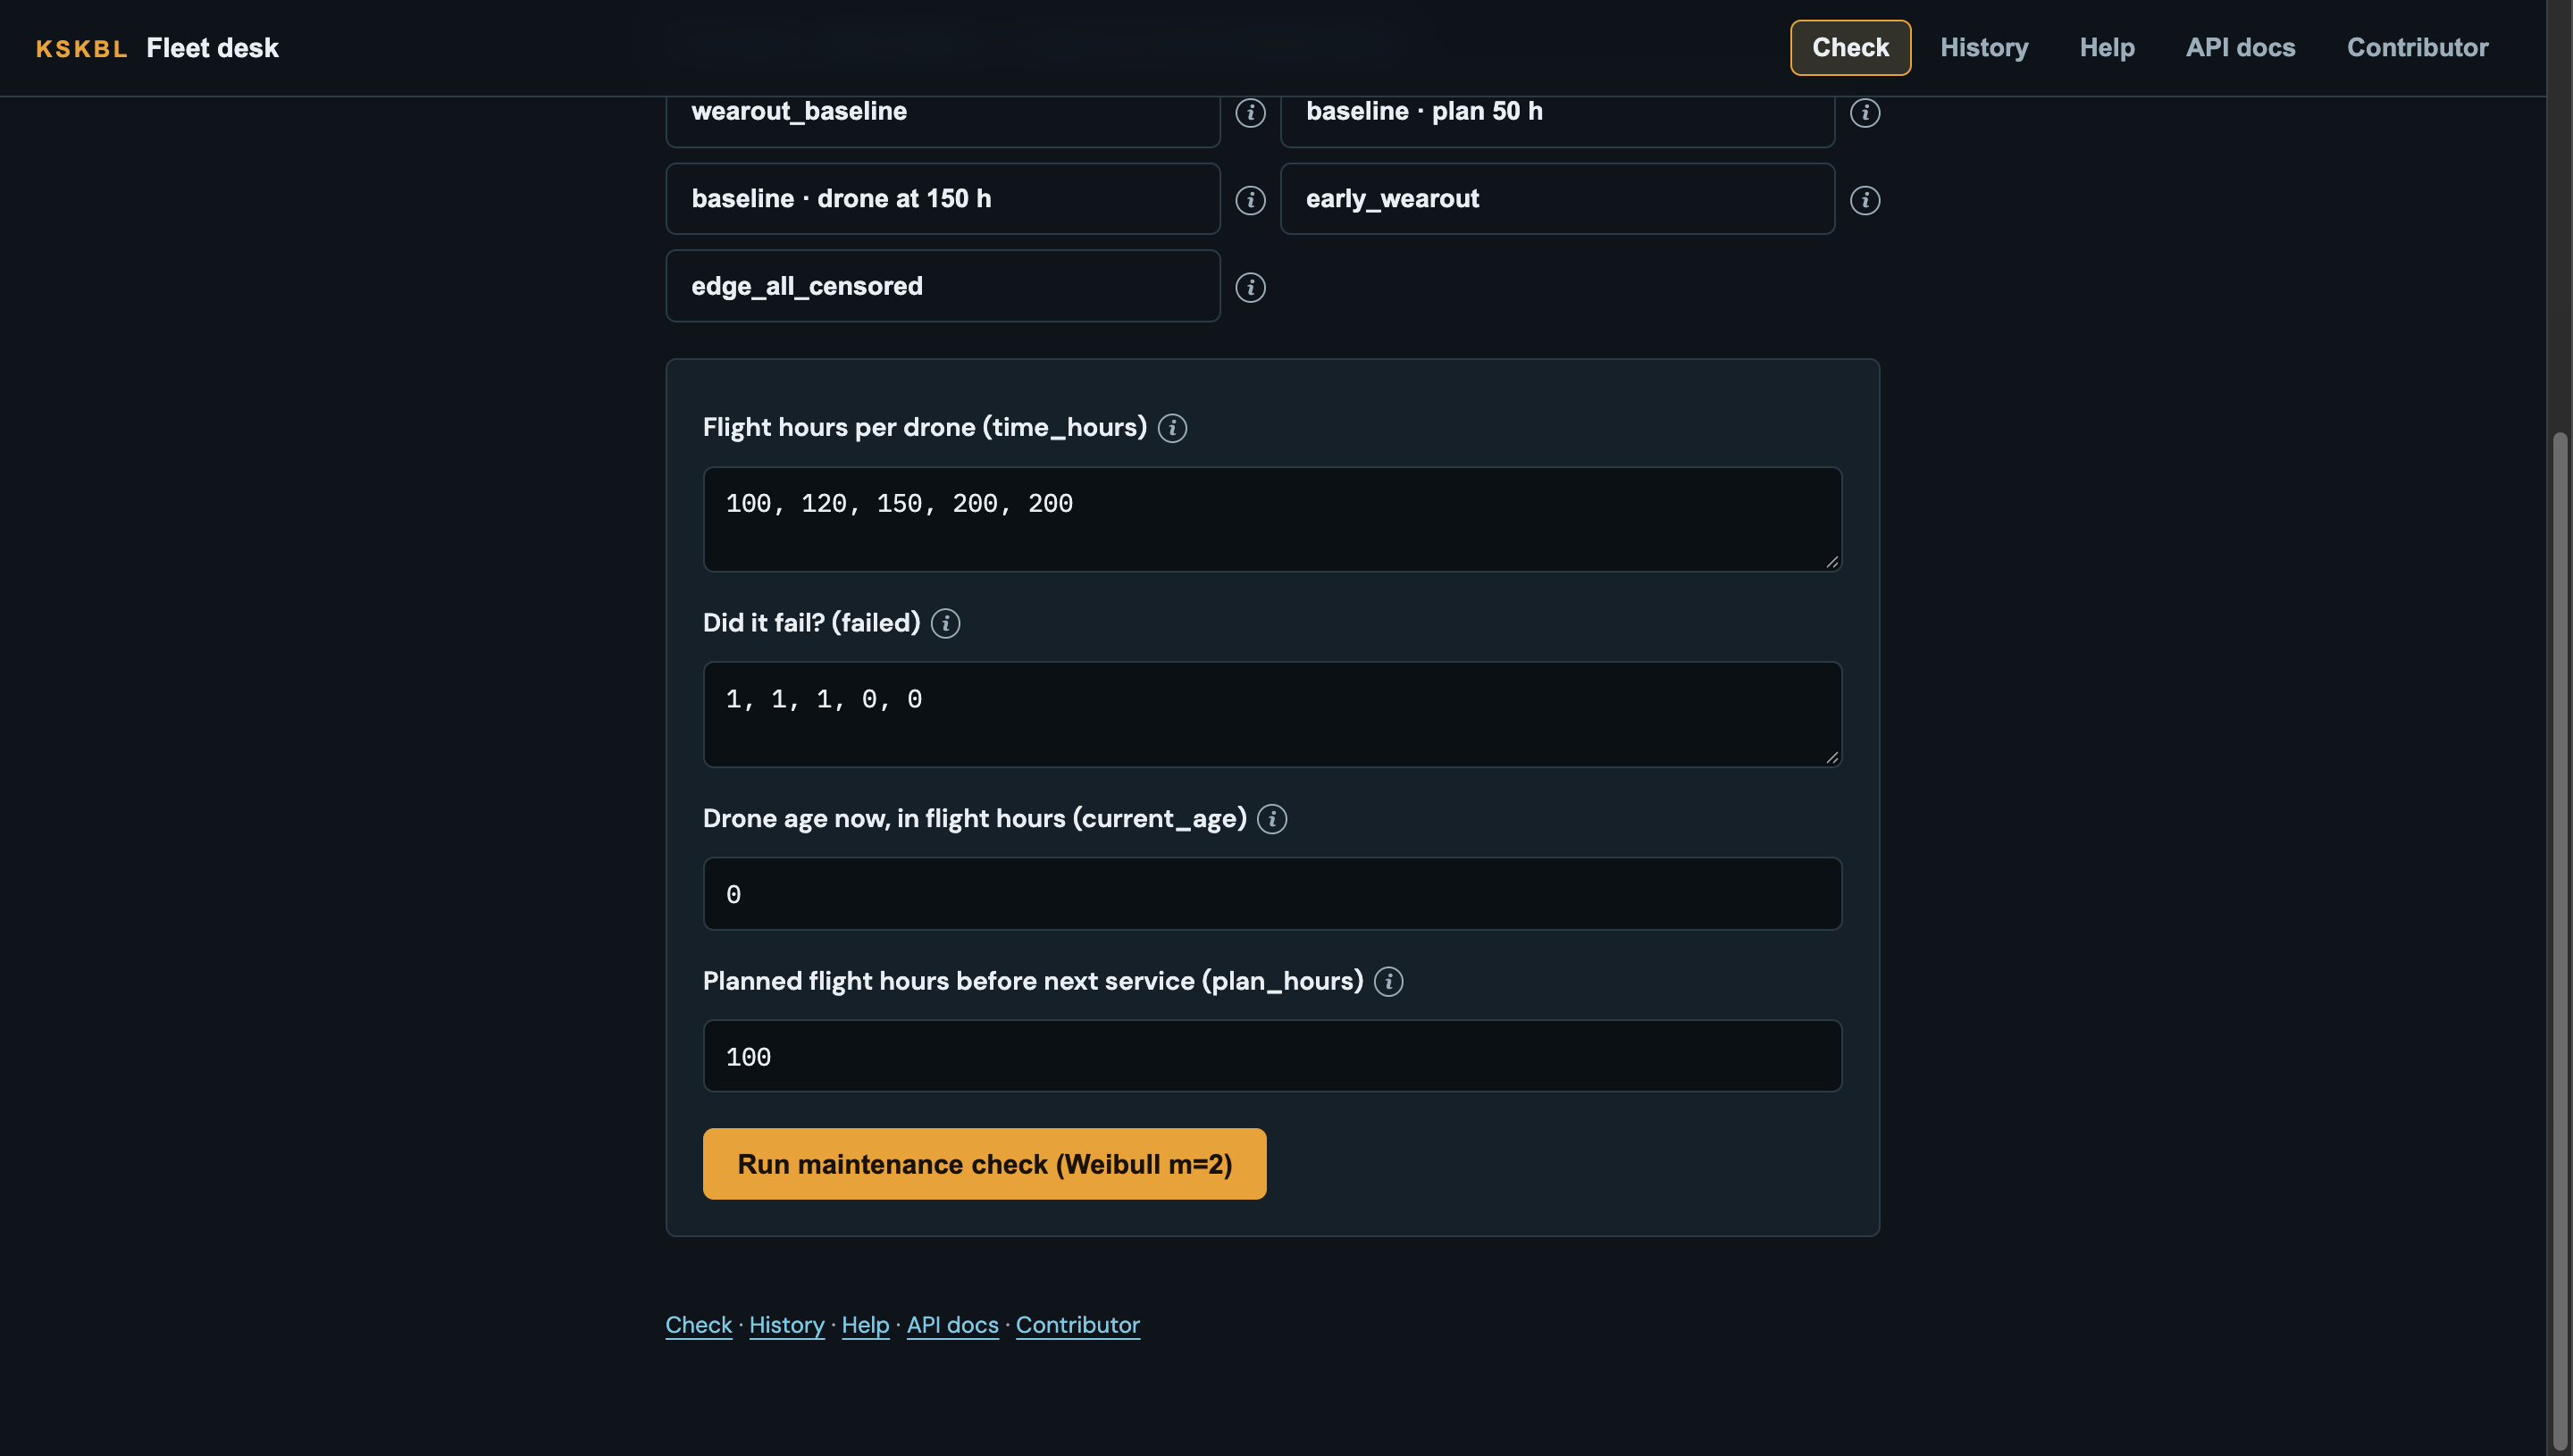
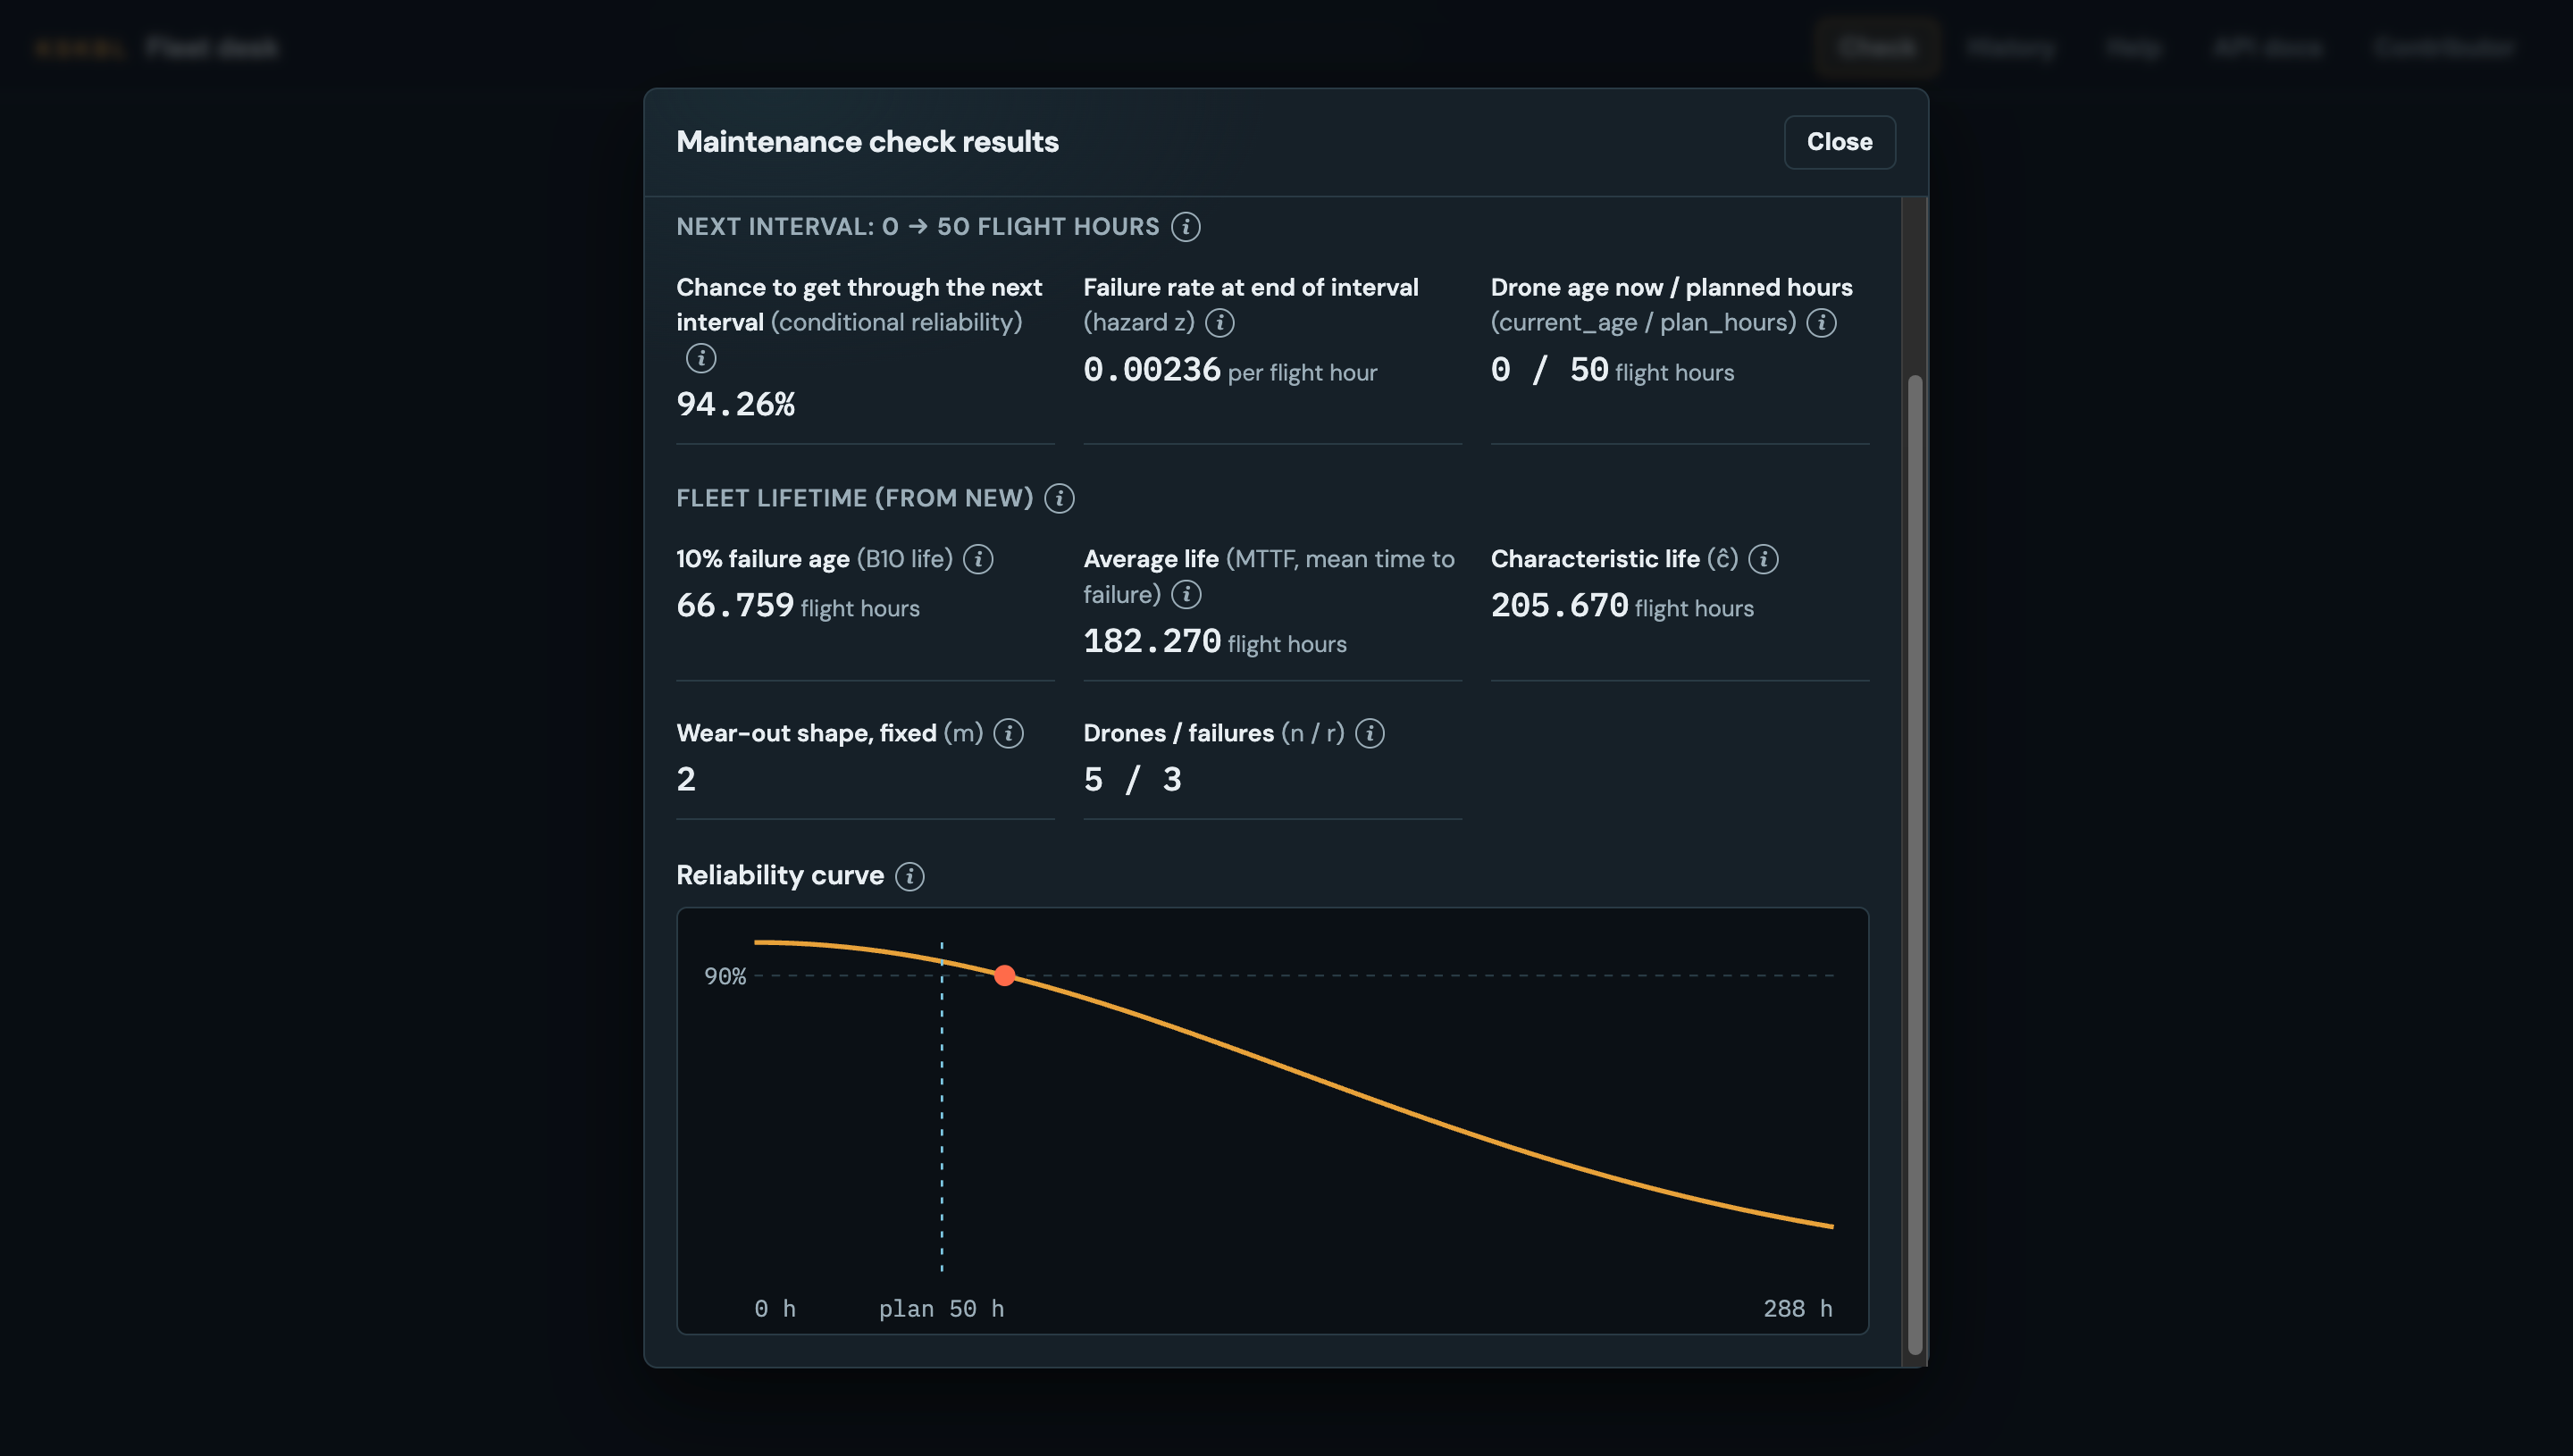
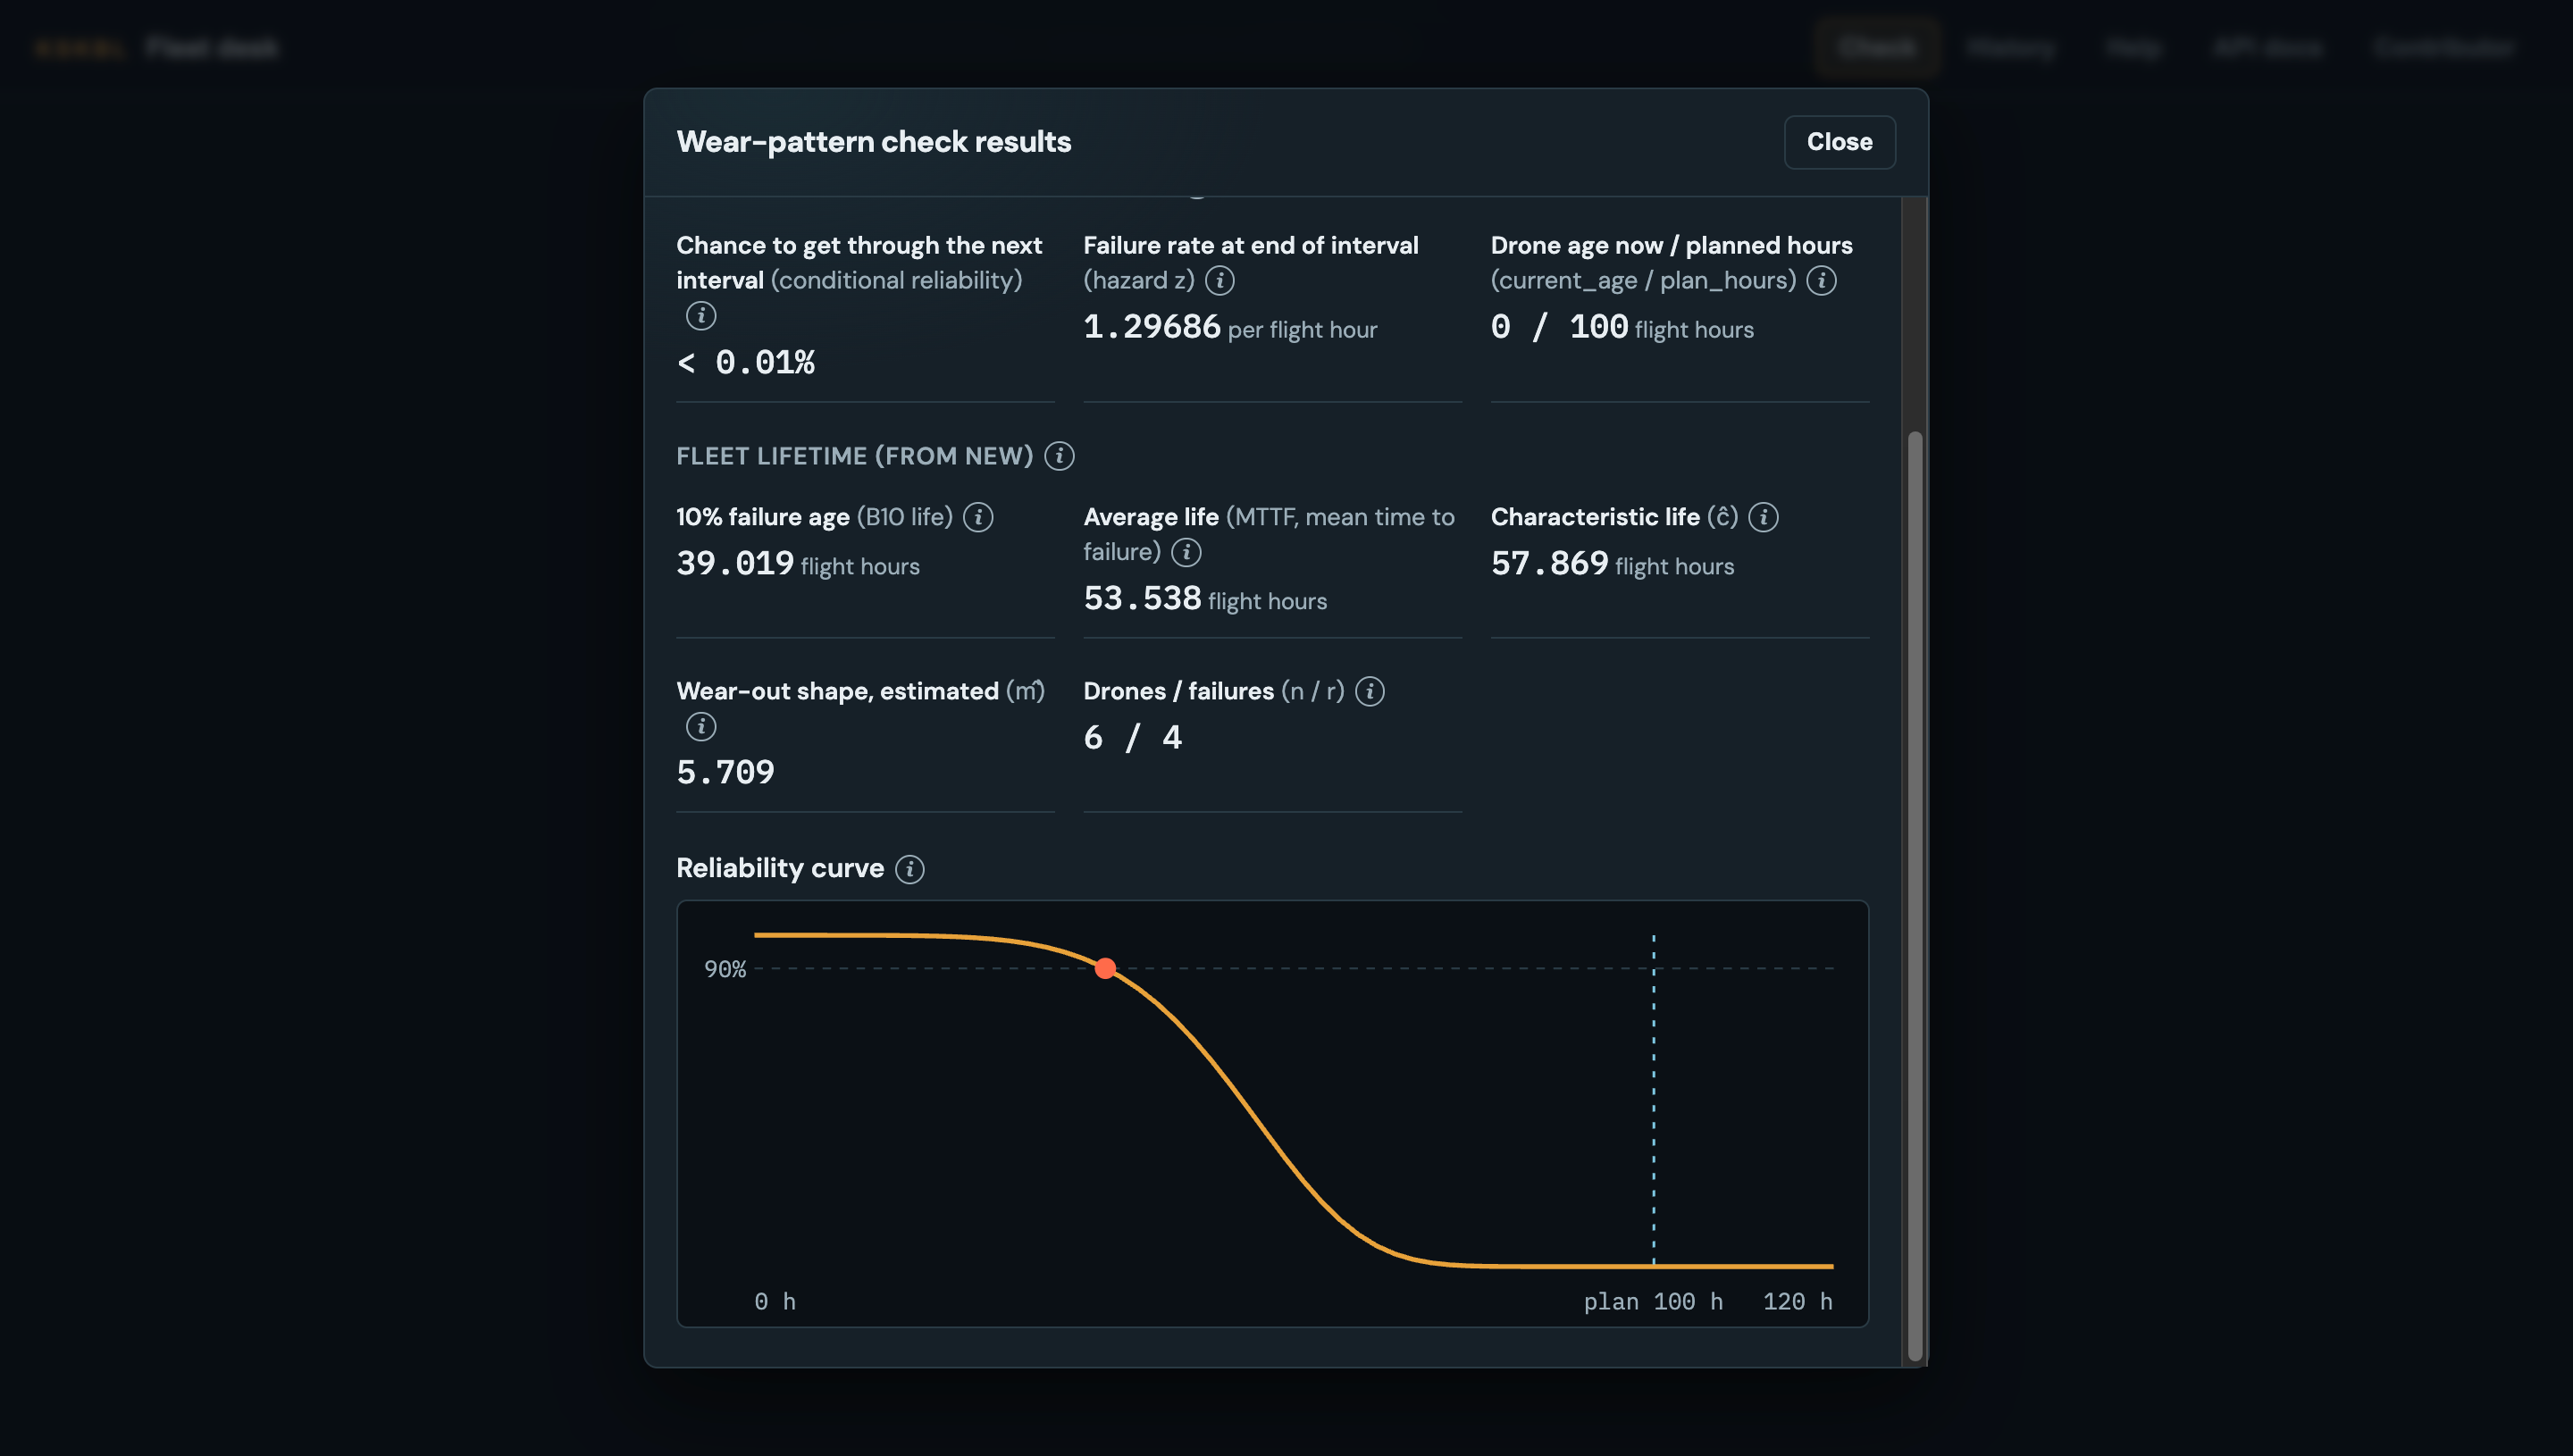
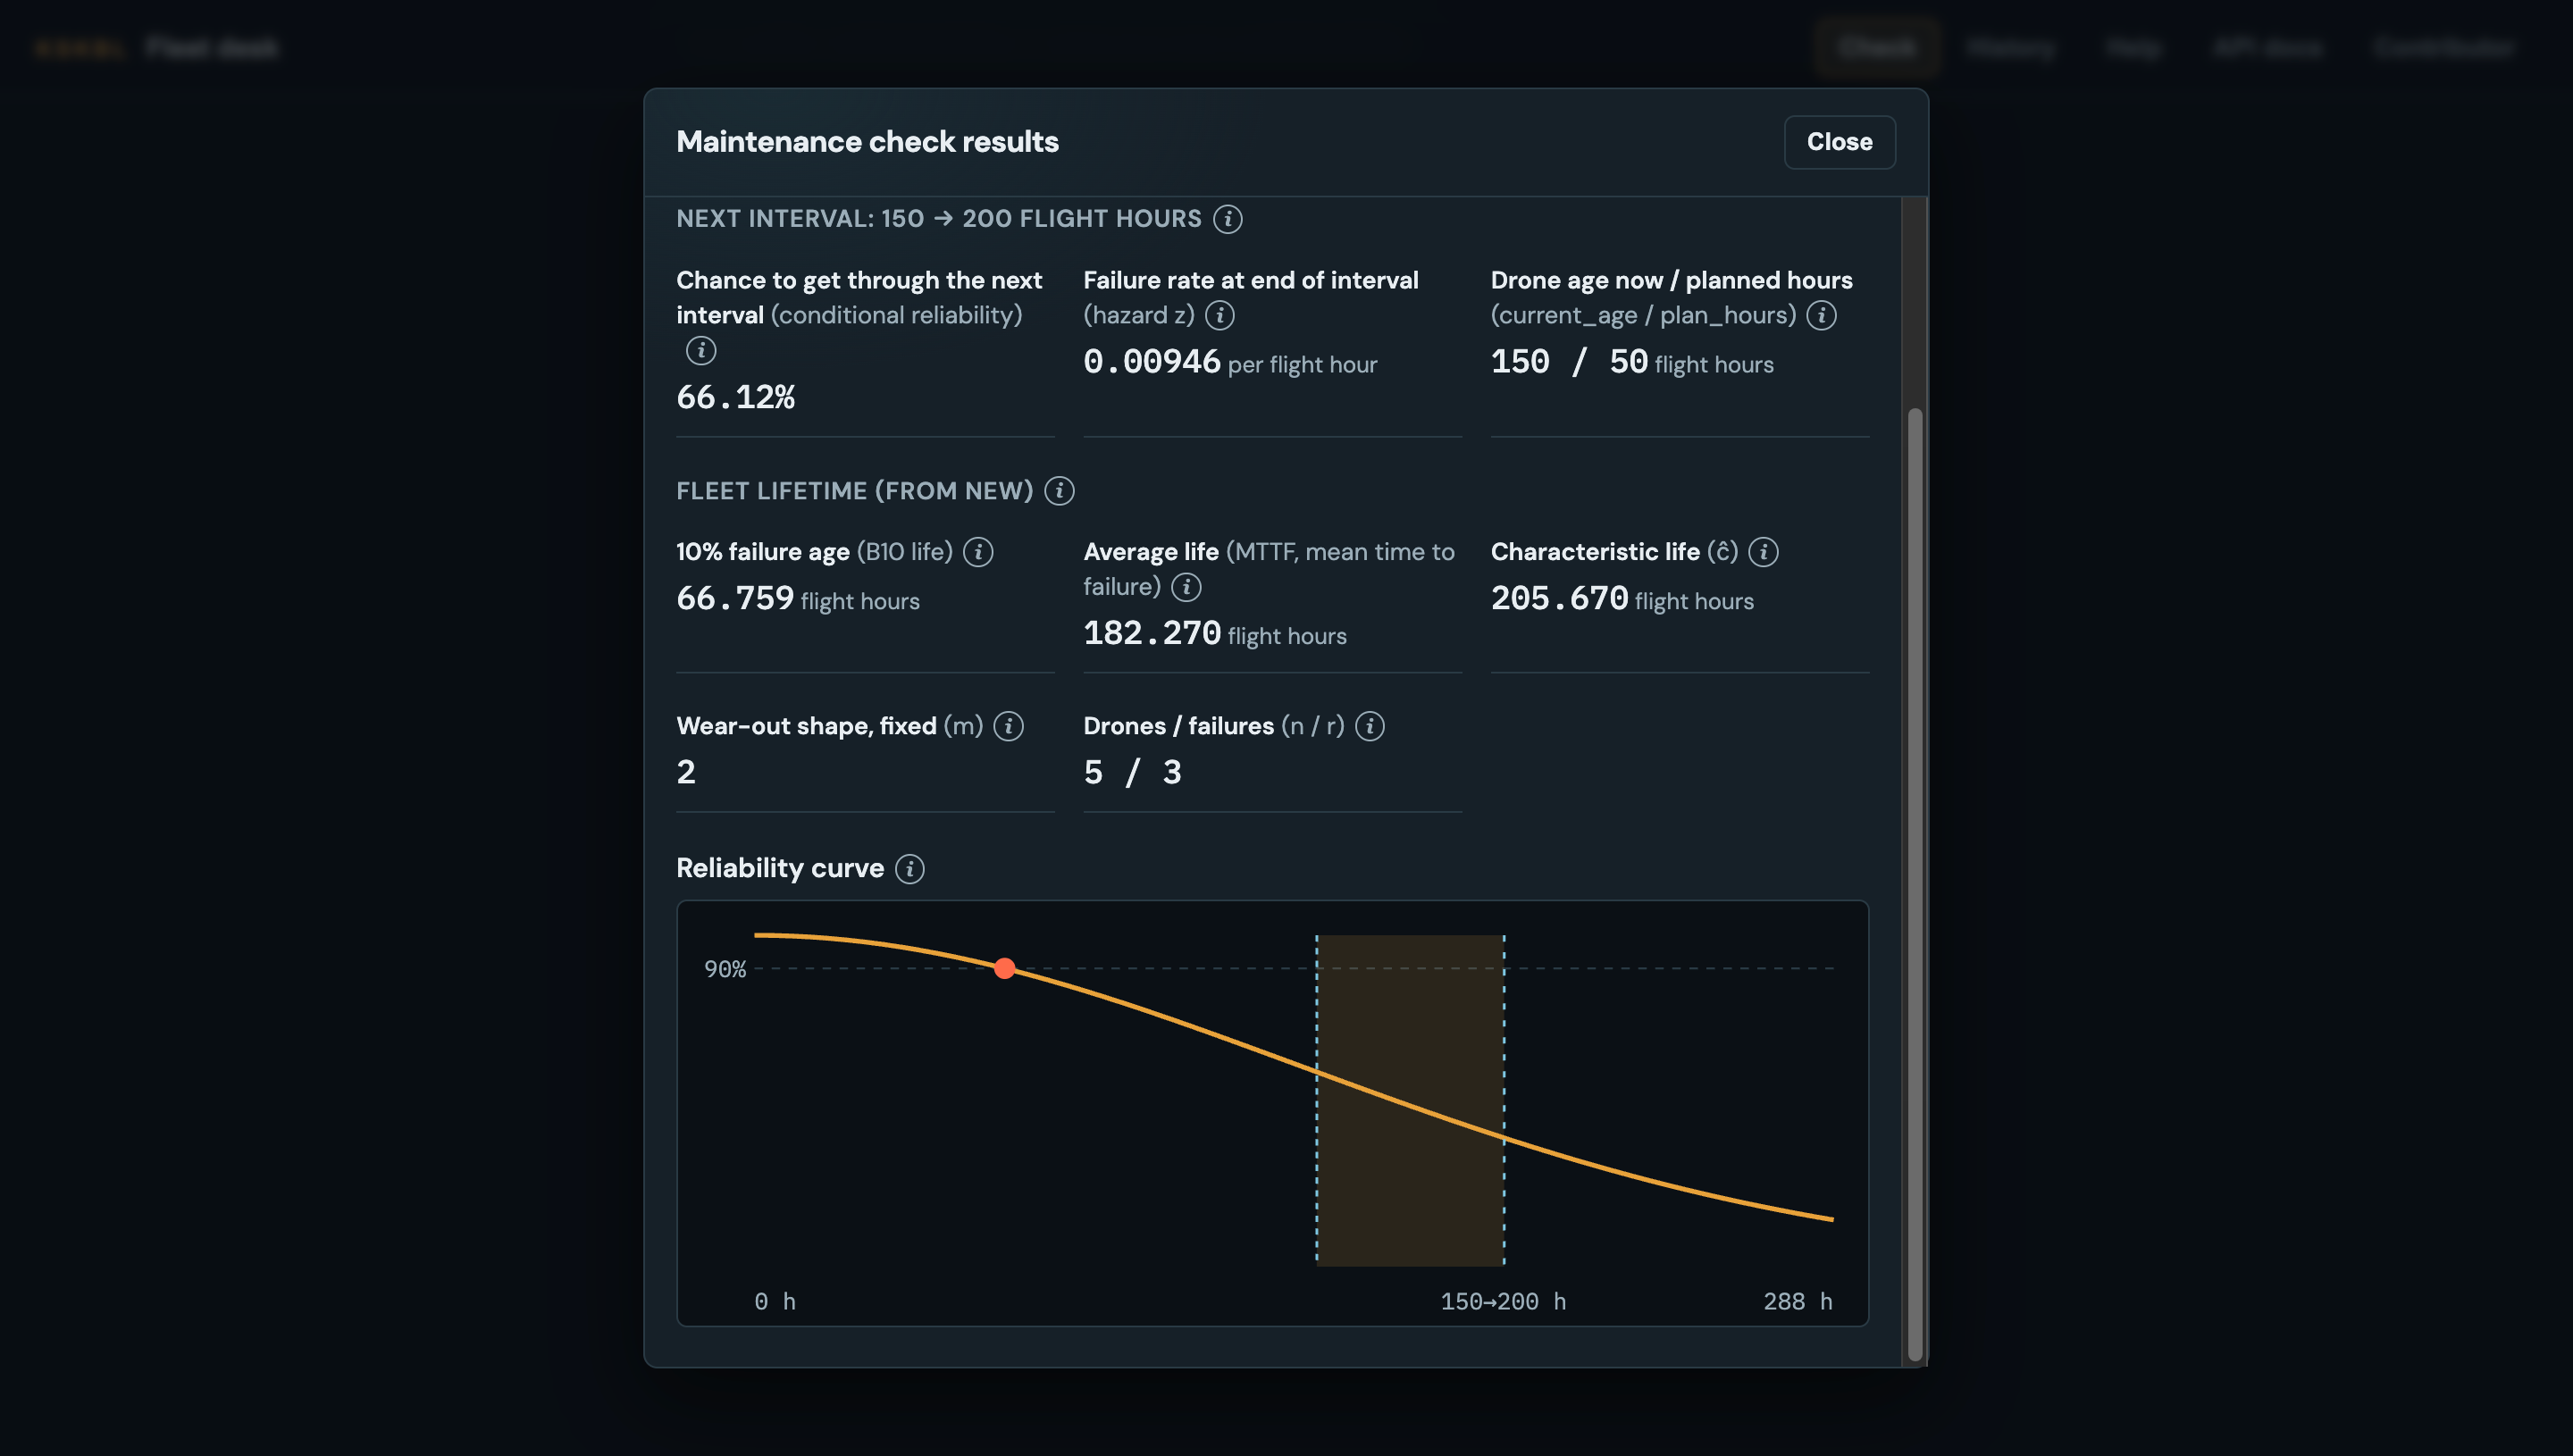
The kskbl Fleet Reliability Desk uses flight hours and failure records to estimate drone fleet reliability with a Weibull model. It calculates mean time to failure (MTTF), B10 life, reliability, and hazard, then provides a maintenance recommendation for a selected flight-time horizon. Its interactive reliability curve helps technicians understand how reliability changes over time.
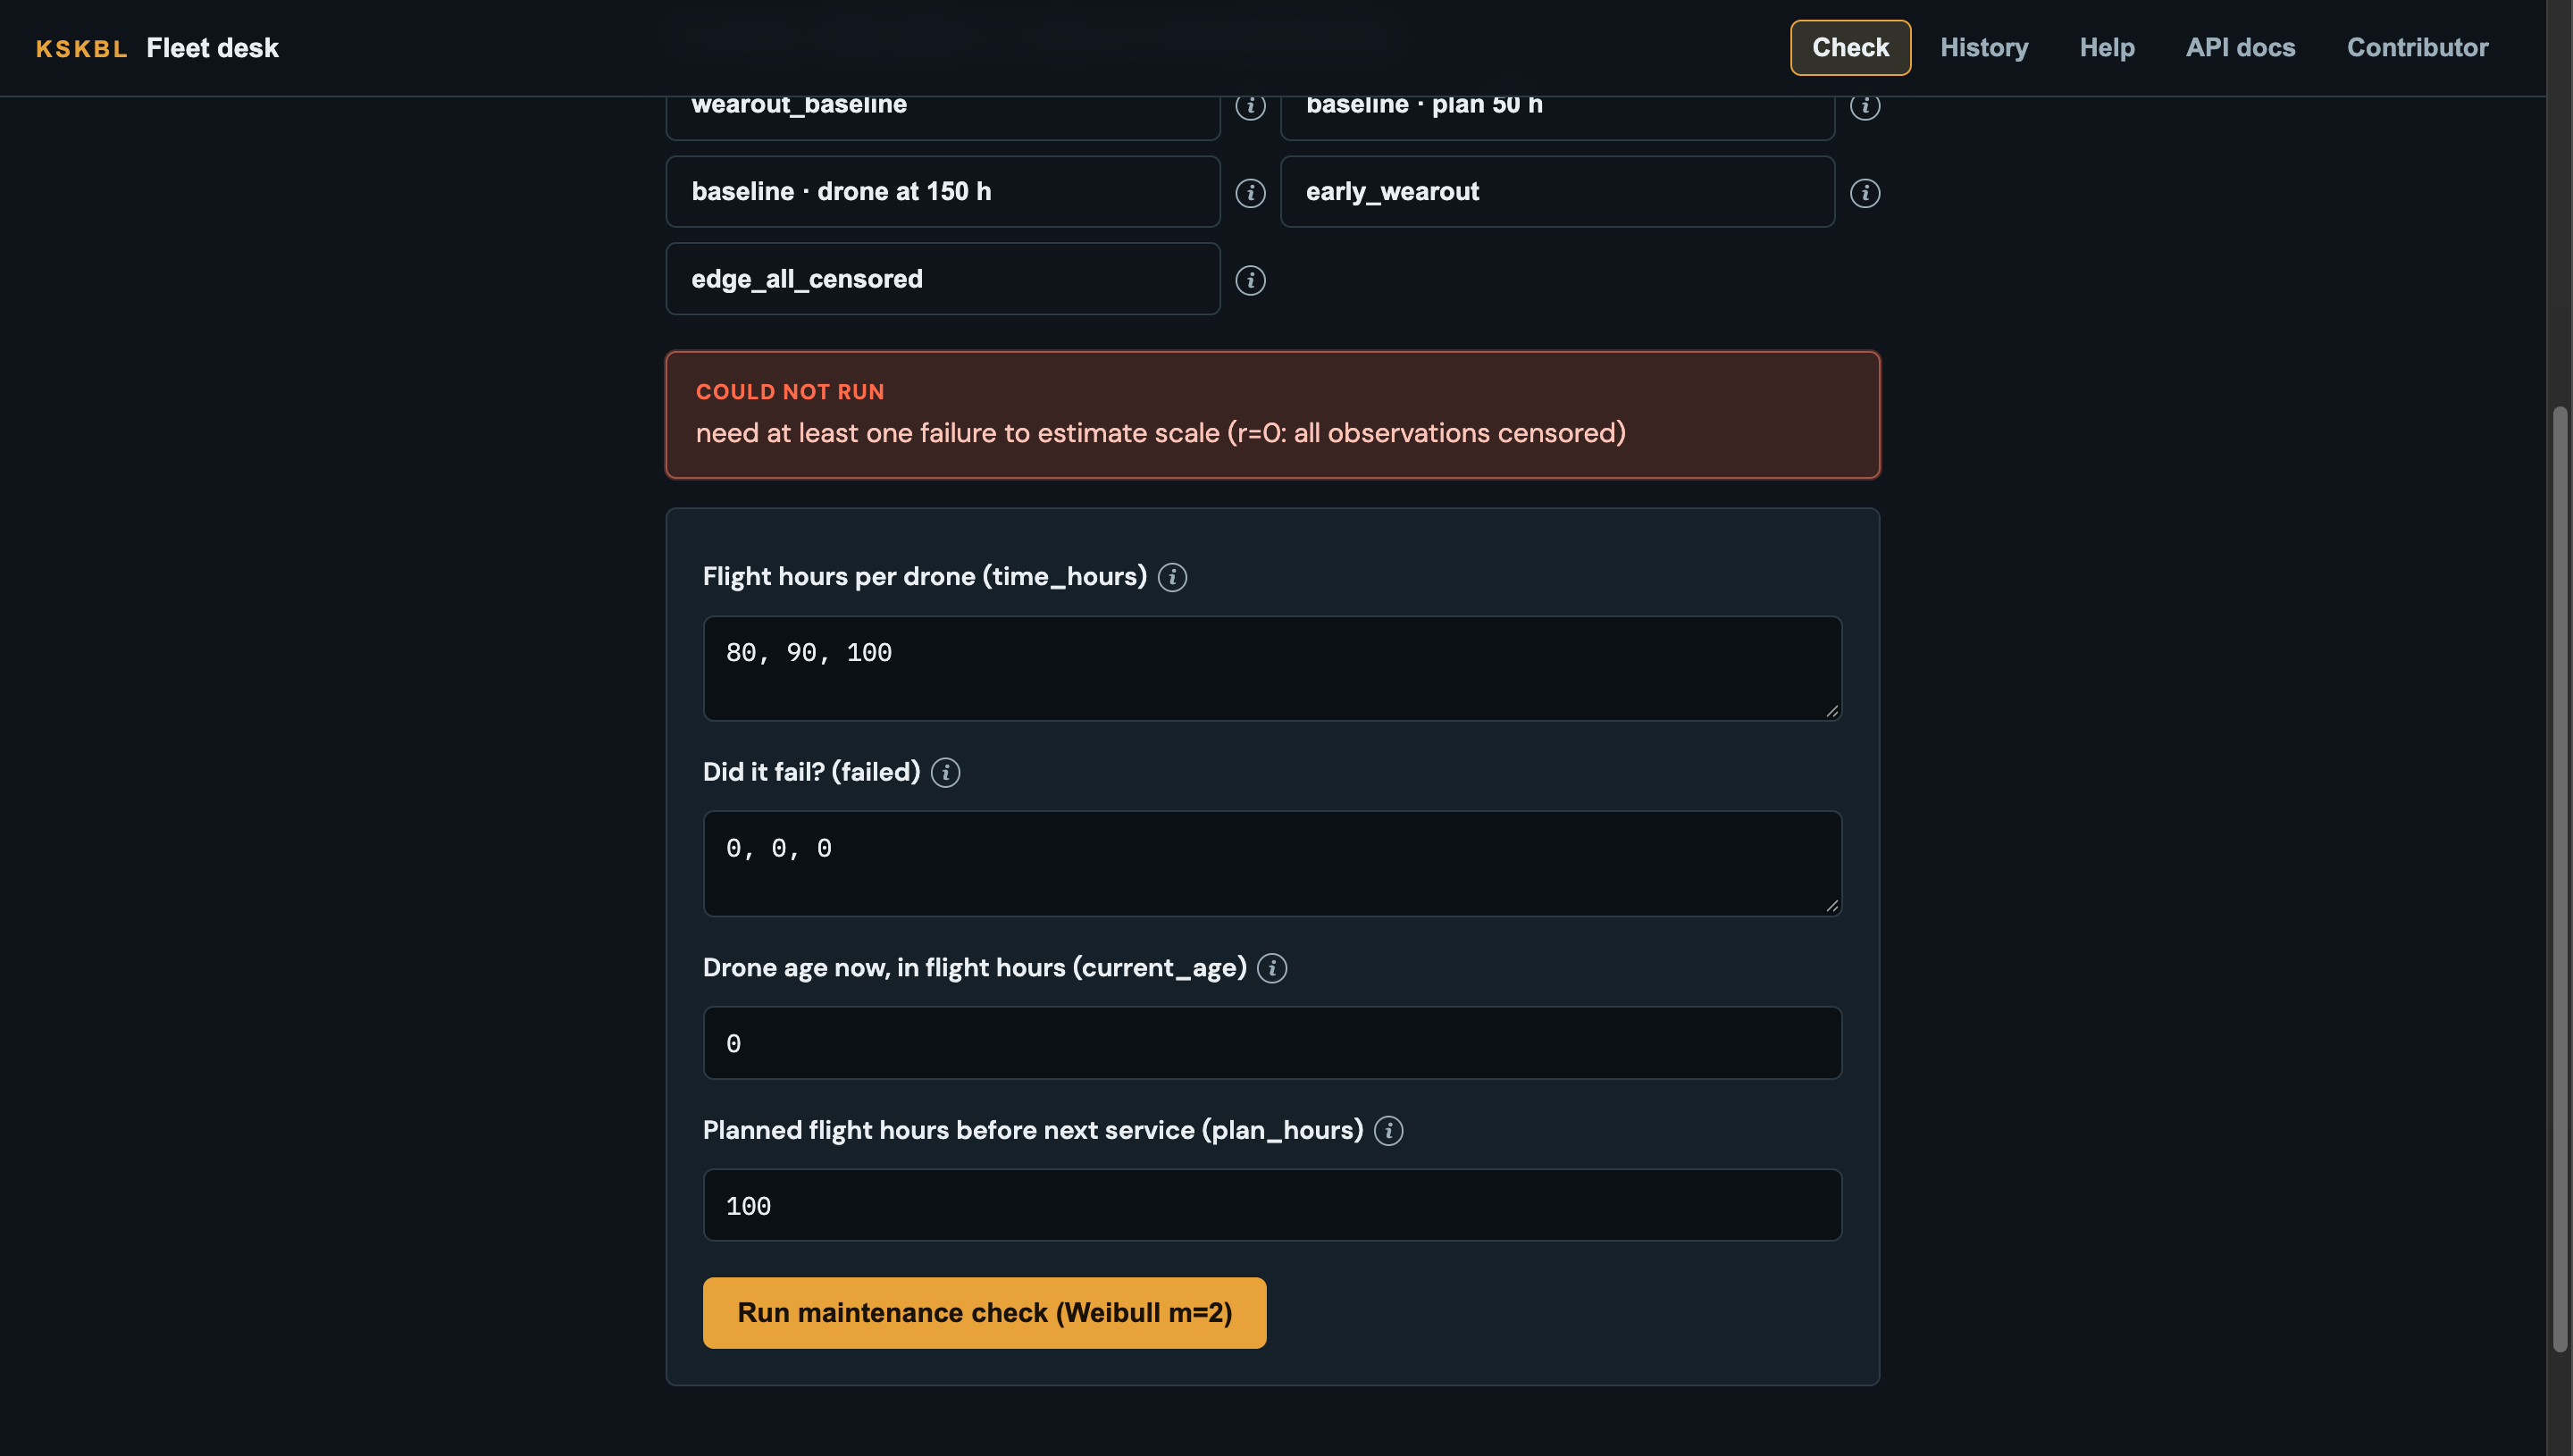
The tool includes baseline, early-wear-out, and all-censored test scenarios. It also handles cases where there are no observed failures and a reliability estimate cannot be calculated.
How we built it
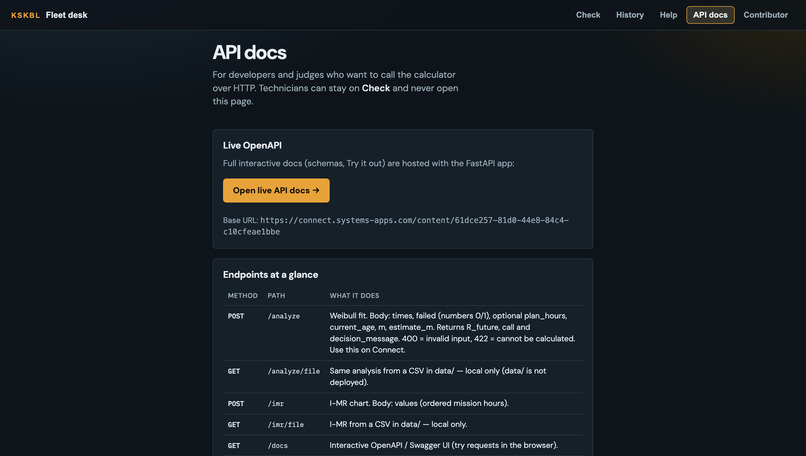
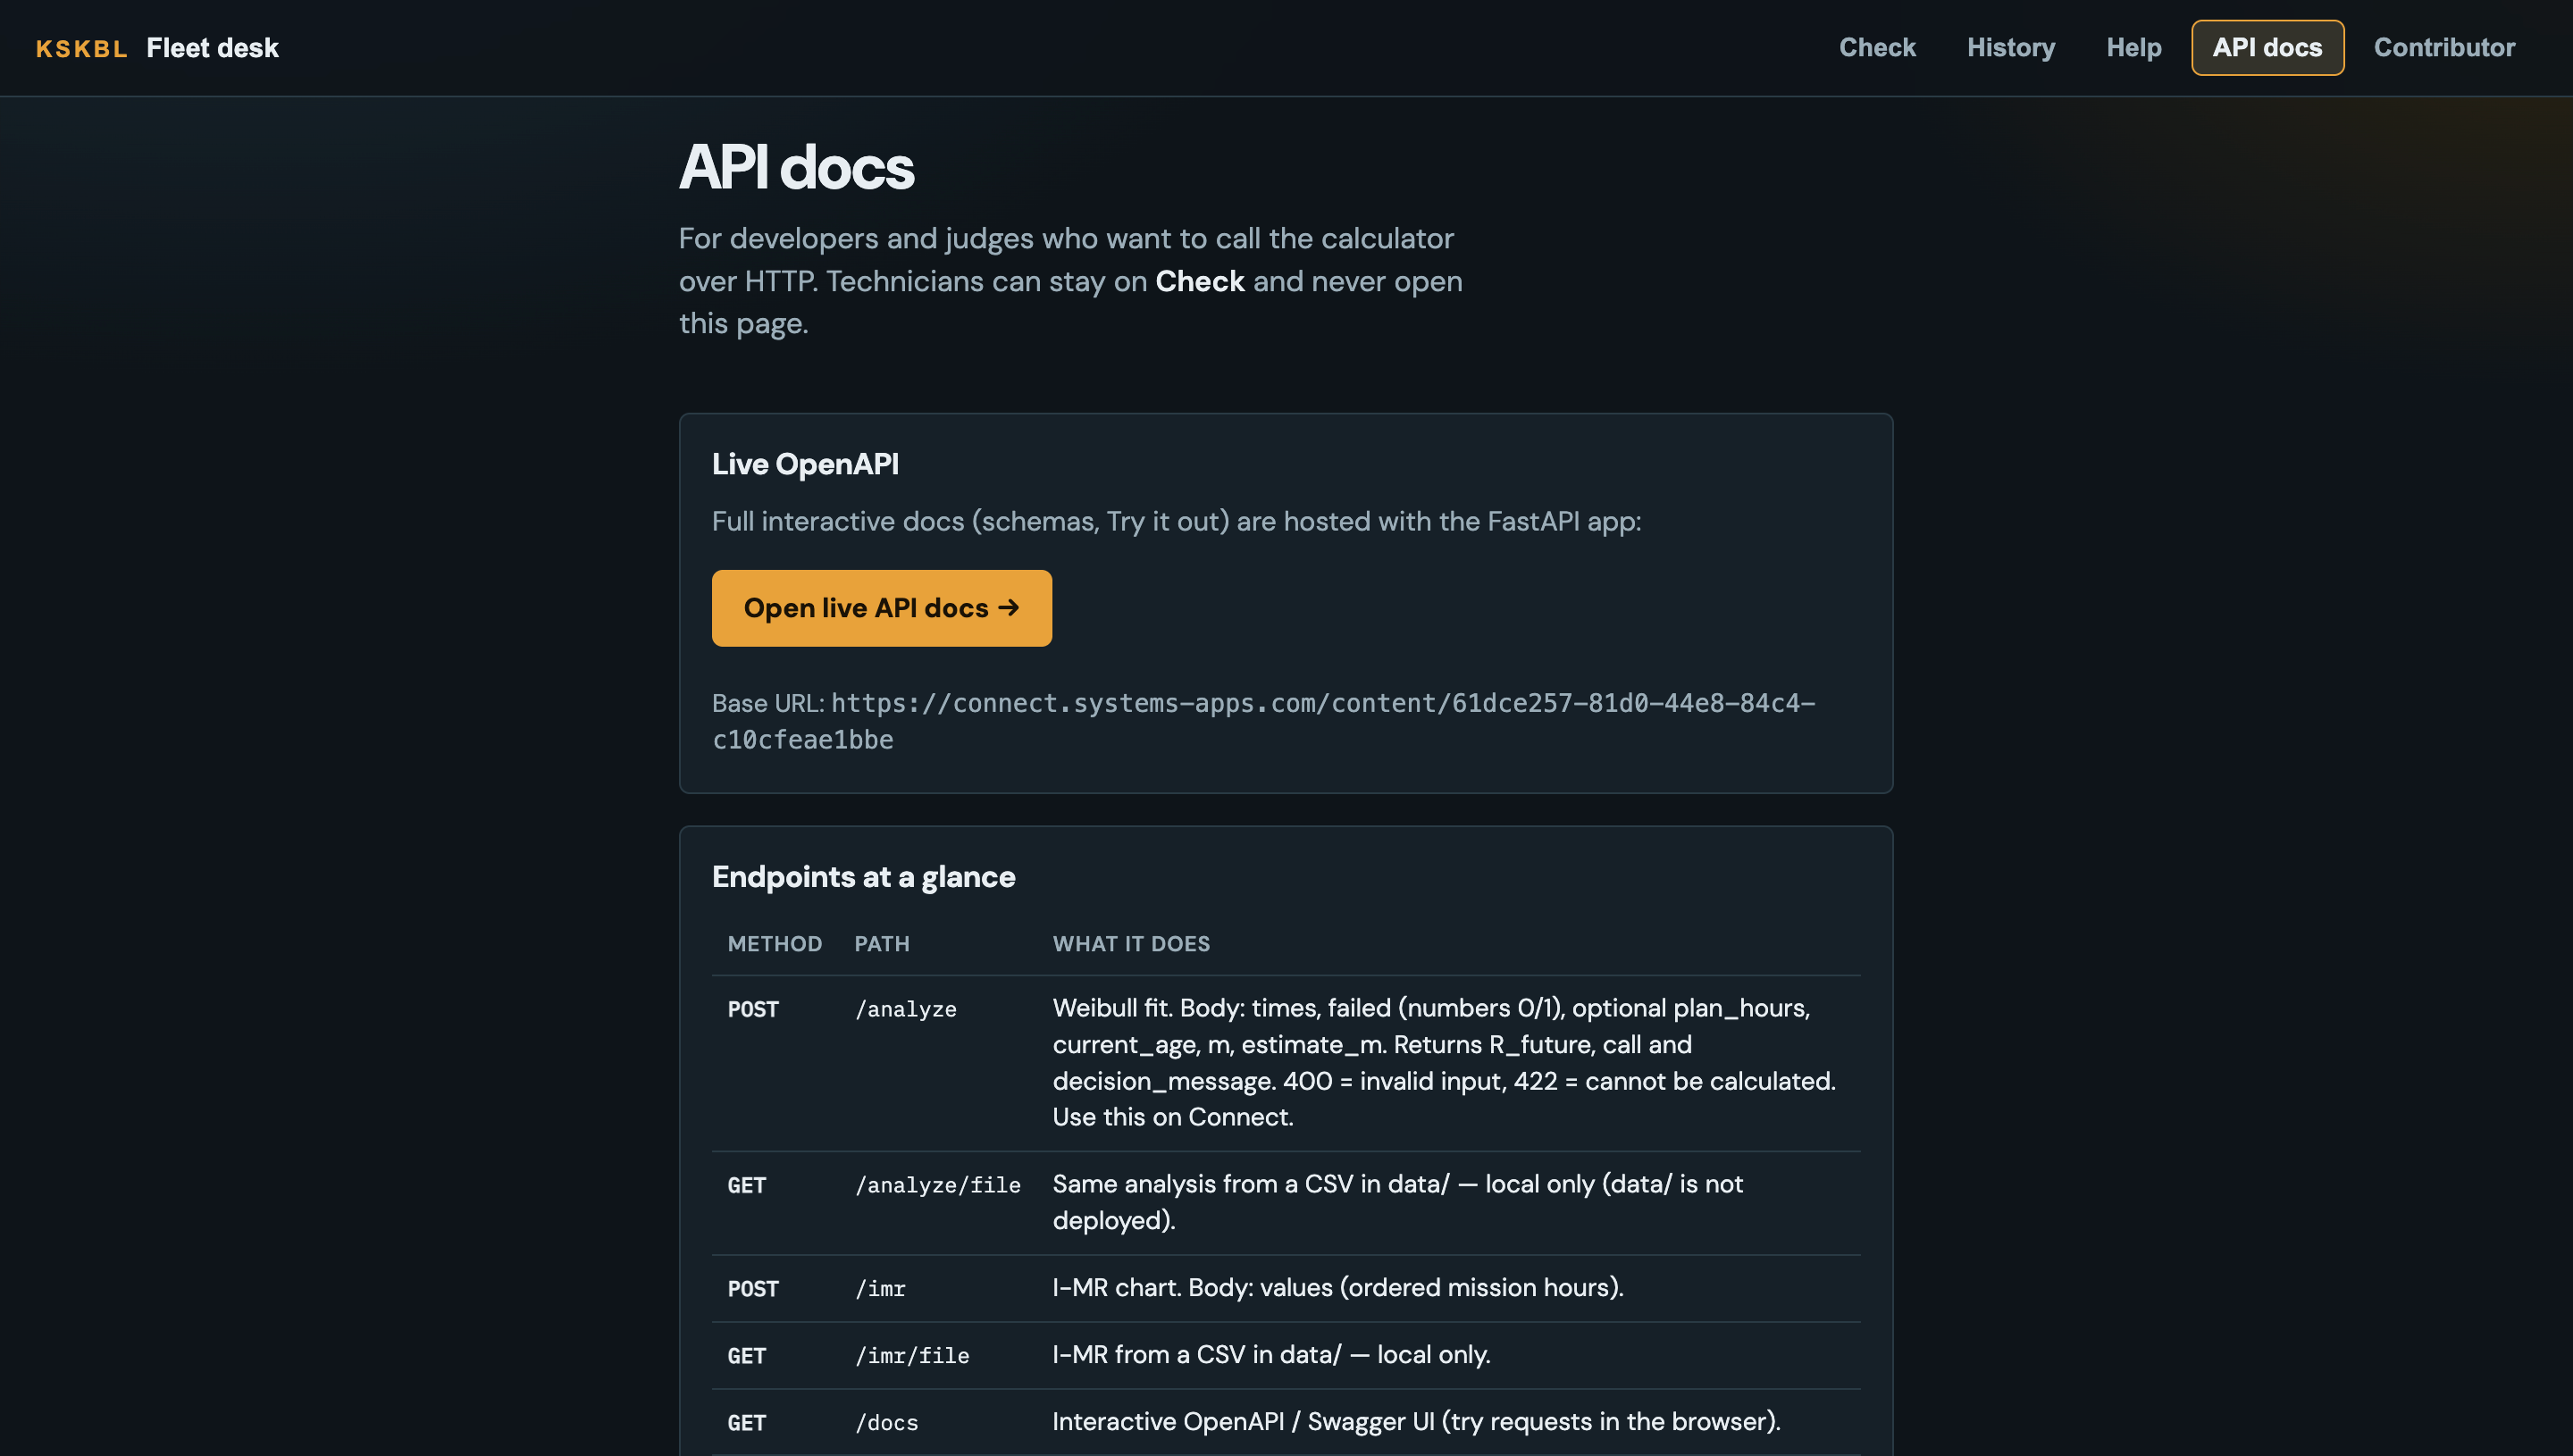
We built a Python backend using FastAPI and implemented the reliability calculations in Python. A React frontend lets users enter flight-hour and failure data, select example scenarios, and view the results and reliability curve.
The application uses a fixed Weibull shape parameter of m = 2. The project includes sample CSV datasets, a data codebook, automated tests, and a step-by-step demo guide. We also deployed the API to Posit Connect so the frontend can use the live service.
Challenges we ran into
One challenge was handling right-censored observations: a drone that is still operating should contribute its observed flight hours without being counted as a failure. Another challenge was designing clear behavior for edge cases, especially when every observation is censored and the model cannot estimate its scale parameter.
We also had to make the model's assumptions clear. Fixing the Weibull shape at m = 2 keeps the first version simple, but it limits how well the model can represent different failure patterns.
Accomplishments that we're proud of
We built a working end-to-end application that connects a React interface to a deployed statistical API. Users can explore multiple scenarios, compare maintenance recommendations at different planning horizons, and view a reliability curve.
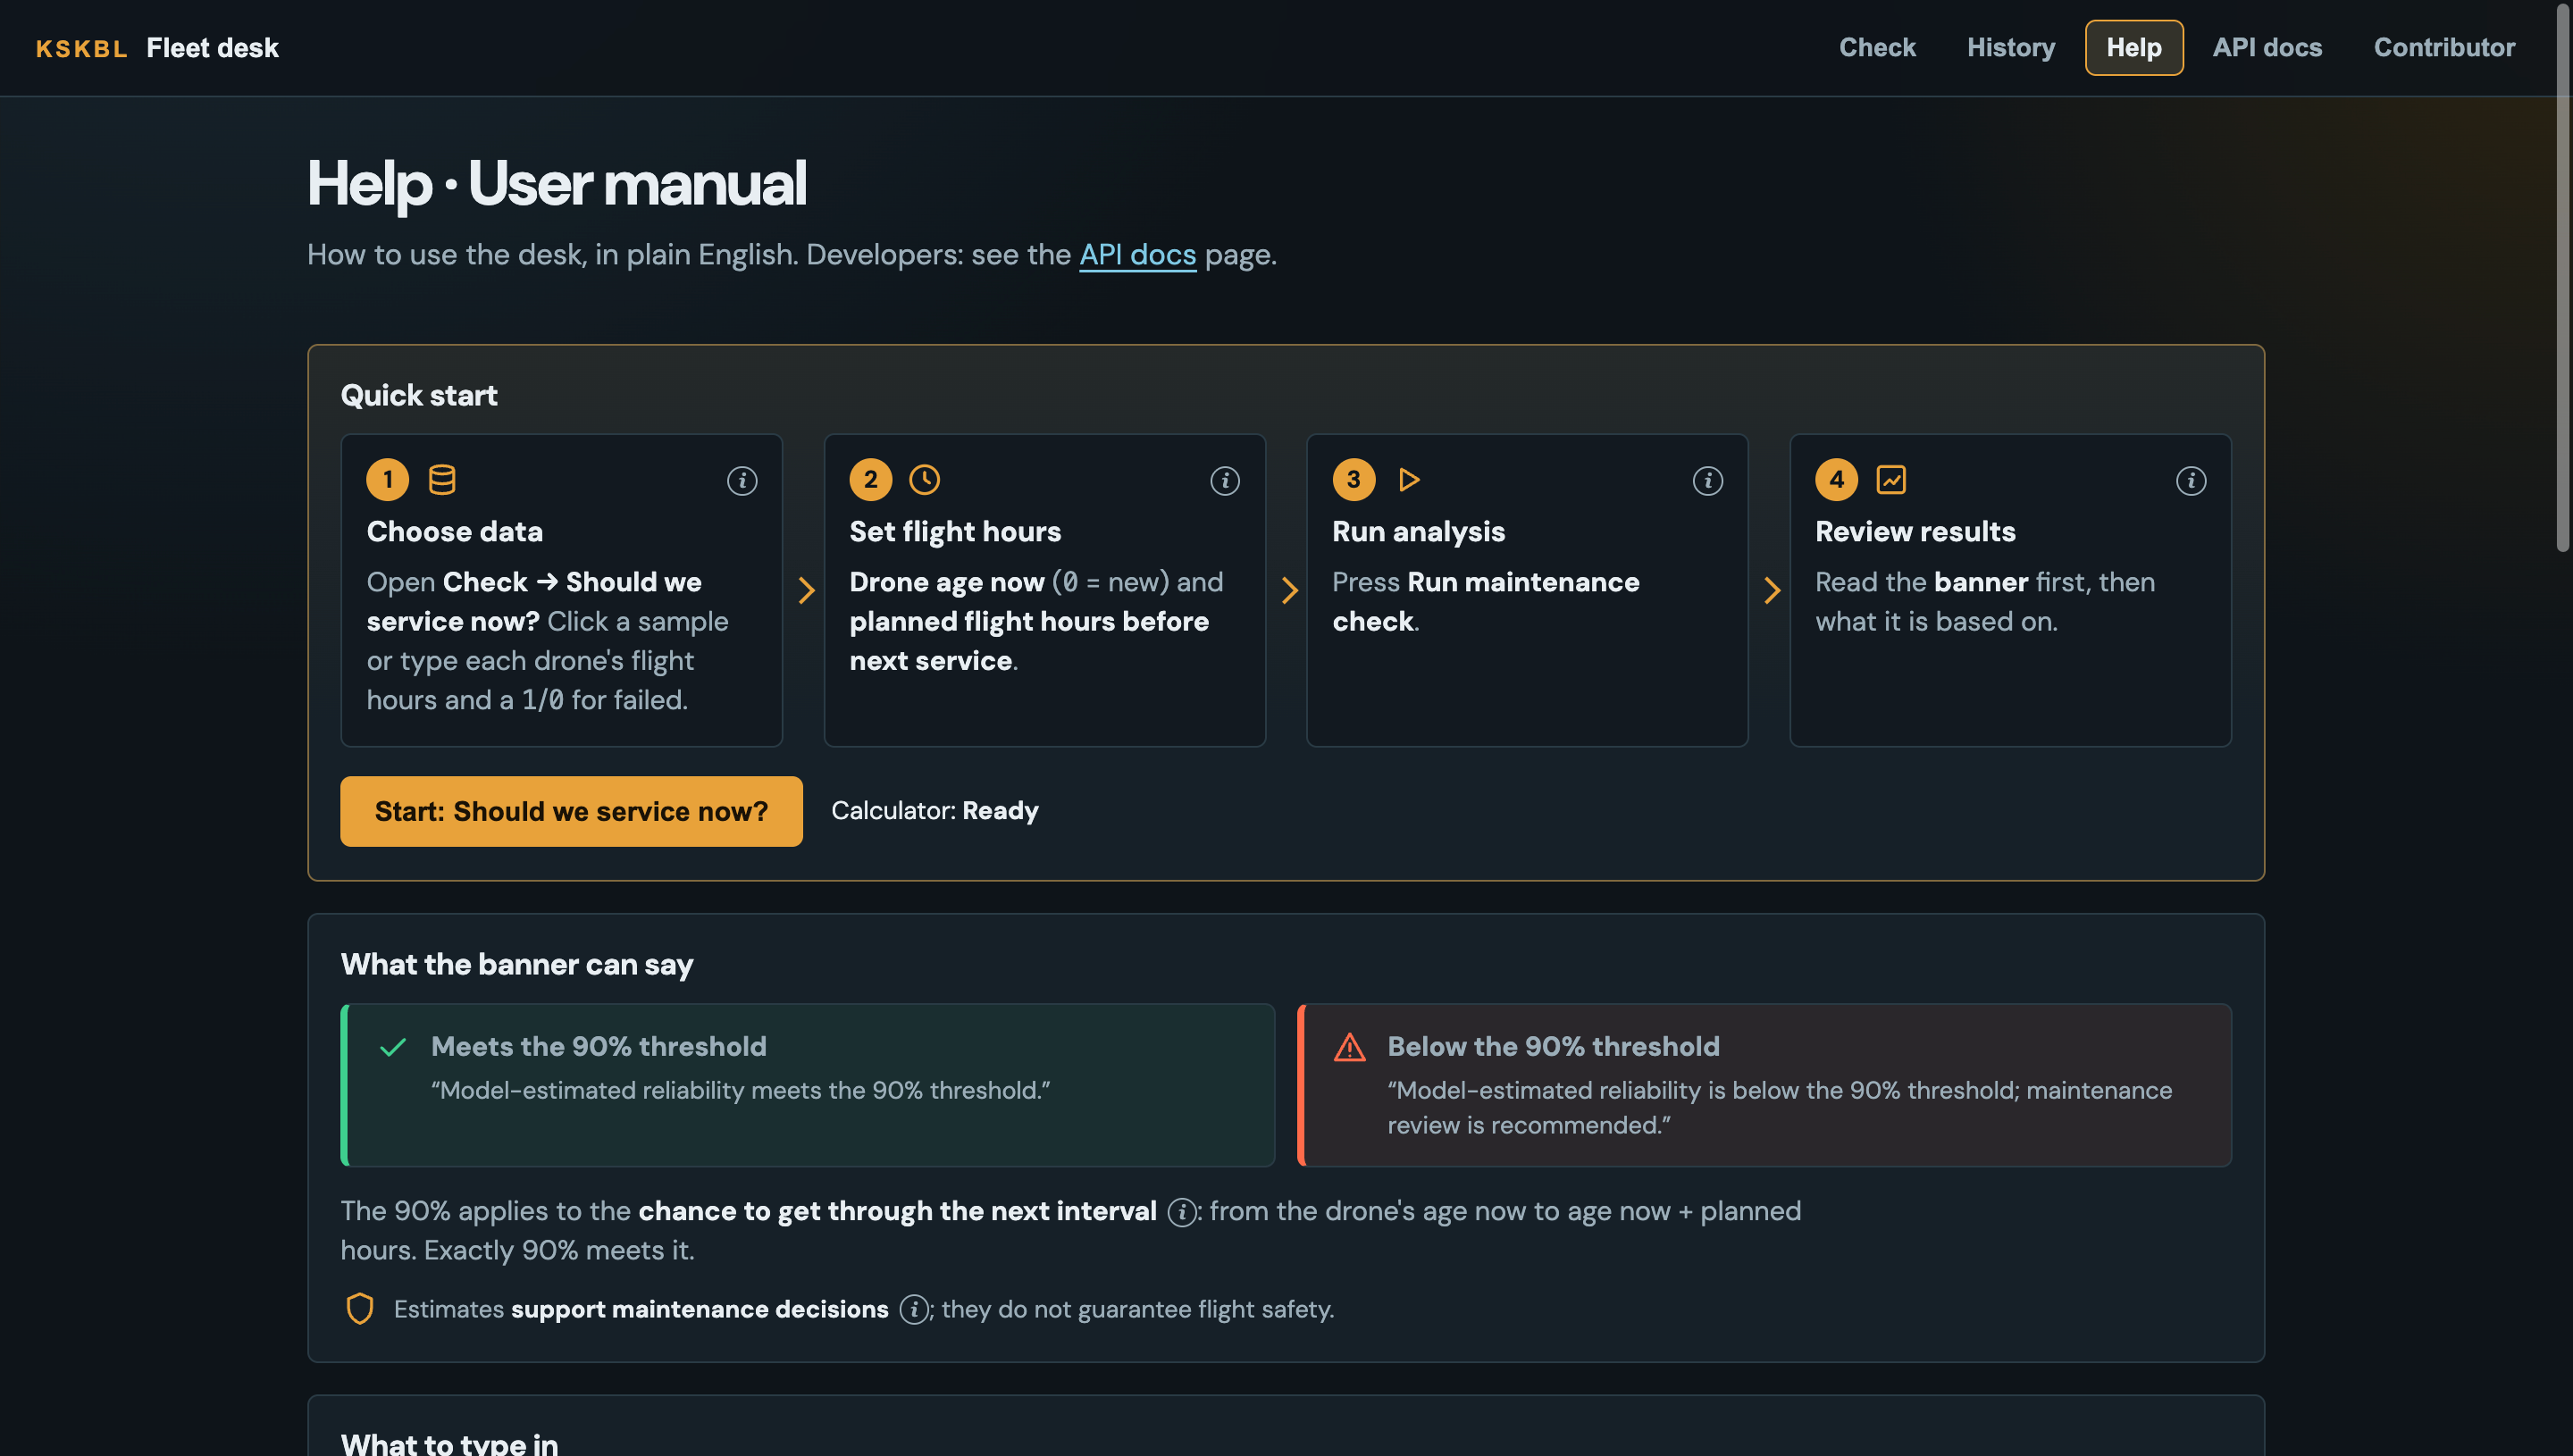
We also created reproducible sample datasets and documentation, and verified the application through automated tests and a fresh-clone walkthrough.
What we learned
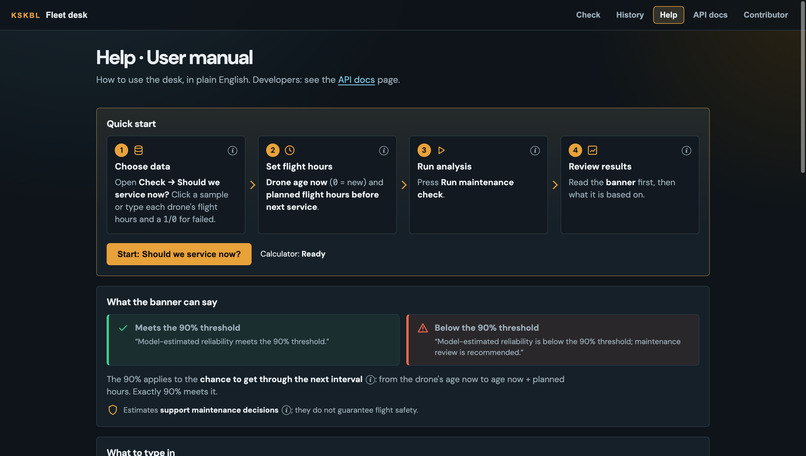
We learned that reliability estimates depend on both data quality and model assumptions. Correctly distinguishing failures from censored observations is essential, and a maintenance recommendation should not be treated as a guarantee of flight safety.
We also learned the value of reproducible testing and clear documentation: users need to understand where the data come from, how the calculations work, and what the results can and cannot tell them.
What's next
Our next step is to evaluate the model with more representative, anonymized maintenance and flight records. We would like to assess the fixed-shape assumption, quantify uncertainty in the estimates, and explore additional features such as failure-type Pareto charts and inspection trend analysis.
These improvements could help maintenance teams combine statistical reliability estimates with routine inspection records to make better-informed maintenance decisions.
Built With
- analysis
- control
- data
- drone
- engineering
- maintenance
- predictive
- process
- python
- reliability
- sigma
- six
- statistical

