Inspiration
India has about 77 million adults with diabetes, and roughly 18% of them have diabetic retinopathy (DR). Early screening can prevent about 90% of the vision loss it causes, yet rural India has roughly one ophthalmologist per 100,000 people, so screening everyone by hand isn’t possible.
AI screening tools exist, but they tend to fail in the field in three ways:
They give a bare grade with no evidence a clinician can check. They break on the blurry, glary images portable cameras produce at a PHC. Their confidence scores aren’t calibrated and they get little external testing.
We wanted a system a doctor could trust, not just one that scores well on a leaderboard. It had to work on bad images, show its reasoning, know when it is unsure, and keep a human in charge of the decision.
What it does
DrishtiSetu (“Bridge to Vision”) is an offline-first DR screening pipeline for Primary Health Centres. It runs on a standard fundus photograph:
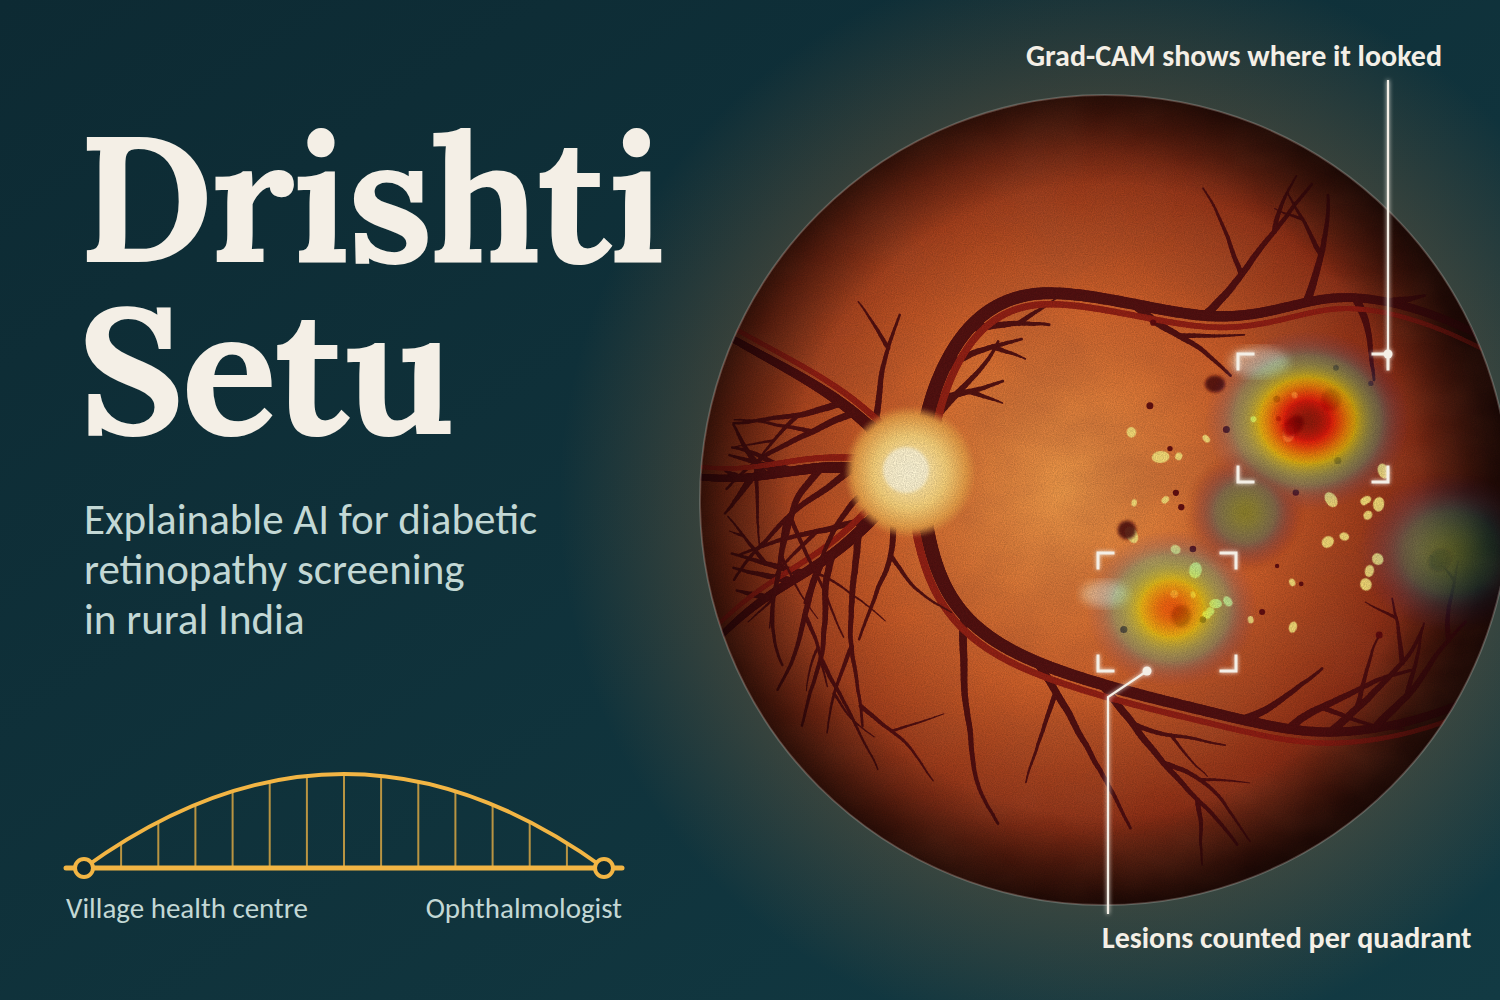
Quality gate: scores focus, illumination and field of view. Good images pass, borderline ones are rescued with CLAHE, and ungradable ones get specific recapture advice for the camera operator. Segmentation: locates the optic disc and fovea, segments vessels, and segments microaneurysms, haemorrhages, hard exudates and soft exudates, with counts per retinal quadrant. Grading: a ResNet-50 grades ICDR levels 0–4, and a deterministic ICDR rule engine (including the 4-2-1 rule) independently cross-checks it. Referable DR means level 2 or higher. Explanation: Grad-CAM attention, lesion evidence, a temperature-scaled P(referable) and a plain-language narrative are combined into one annotated PDF, PNG and TXT report. Decision policy: each case is auto-cleared, referred or escalated, based on calibrated risk, uncertainty and whether the three evidence channels agree. Level 4 is always escalated. Human review: a clinician accepts, modifies or rejects the result, and every action goes into an audit log. District simulation: a Simulink/SimEvents model of capture, quality gate, local AI, upload and grader queues, sized for 100,000 screenings a year.
No single black-box model decides alone.
How we built it
Everything is in MATLAB and Simulink, using the Image Processing, Computer Vision, Deep Learning, and Statistics and Machine Learning toolboxes, plus App Designer for the clinician workstation.
Models: a ResNet-50 grader trained on APTOS 2019 at 448 px, a lesion U-Net trained on IDRiD (Tversky + focal loss), and a vessel U-Net trained on DRIVE (Dice + BCE loss). Calibration and policy: temperature scaling (T = 2.14), fit on held-out data. Auto-clear happens only when P(referable) ≤ 0.40 and the evidence agrees. Out-of-distribution checks and entropy-based uncertainty route doubtful cases to a human. Validation discipline: fixed train, validation, calibration and test splits, a frozen operating point, Wilson 95% confidence intervals, and a sealed external set (Messidor-2) guarded by tests. Ablation: a 14-configuration harness that steps from CNN-only up to the full pipeline. Simulation: a SimEvents district model of 10 PHCs, with sweeps over grader count, bandwidth, deferral rate, quality-gate behaviour and camp-day bursts. Engineering: an orchestration layer around one shared result object, an offline case registry, and a test suite of 40 test files.
Challenges we ran into
Honest evaluation. APTOS has no patient IDs, so we use each image ID as a conservative stand-in for patient and keep the splits fixed. We then froze the operating point before touching test data and built tests to stop sealed data leaking into training or tuning. Confidence you can trust. Raw softmax scores are overconfident, so we added temperature scaling and a policy that escalates uncertain or disagreeing cases instead of forcing a label. Tiny lesion datasets. IDRiD has only 81 images with pixel-level lesion masks and DRIVE has 20 training images, so the lesion and vessel U-Nets are trained on very little data. Teaching a CNN and a rule engine to agree. Making the grader, the lesion-based ICDR rules and Grad-CAM cross-check each other took a lot of work, and the disagreements became our escalation signal. Being honest in the simulation. We tagged every parameter in the district model as measured or assumed, because values like the quality-rejection rate and bandwidth are placeholders until real PHC data exists. Field-like latency. Median per-case time was 0.715 s on a laptop GPU, but a few very large images pushed the p95 to about 13 s, so we report the median and the tail separately. Accomplishments that we’re proud of On the internal test set (n = 183), referable-DR sensitivity was 96.0% (72/75) and specificity was 91.7% (99/108), against targets of 90% and 85%. On the validation split (n = 550) they were 98.2% and 91.7%. Every headline metric comes with a confidence interval and a frozen operating point, rather than a tuned best case. The explanation is built from evidence a clinician can verify: Grad-CAM, lesions per quadrant, the ICDR rule trace and a calibrated score, all on one report. The system fails safe: bad images trigger recapture, uncertain cases go to a human, and the whole pipeline works offline at the PHC. The pipeline is quality-aware, calibrated, explainable and validated end to end, and the district simulation connects it to real resource planning.
What we learned
Calibration and a sensible “I’m not sure” path matter as much as accuracy for clinical trust. Combining a CNN, lesion segmentation and rule-based grading catches errors that any one of them would miss. Validation discipline (frozen thresholds, sealed external data, confidence intervals) takes as much effort as modelling, and it is what makes the numbers credible. The small test set leaves wide intervals: the sensitivity lower bound is 88.9%, just under the 90% target. That is a reason to validate on more data, not a number to hide. A simulation is only as trustworthy as the labelling of its inputs.
What’s next for DrishtiSetu
Report the sealed Messidor-2 external results and compare against published benchmarks. Run a prospective study with ophthalmologists, rating the Grad-CAM and lesion explanations for clinical usefulness and timing the review against the 30-second goal. Pilot at real PHCs with portable cameras, replacing the simulation’s assumed values (capture time, bandwidth, quality-rejection rate, grader time) with measured ones. Train on larger, more varied Indian data to tighten the confidence intervals, and improve microaneurysm detection and neovascularization. Test on low-cost edge hardware, add multilingual reports for ASHA workers and GDMOs, and add macular edema grading.
