-
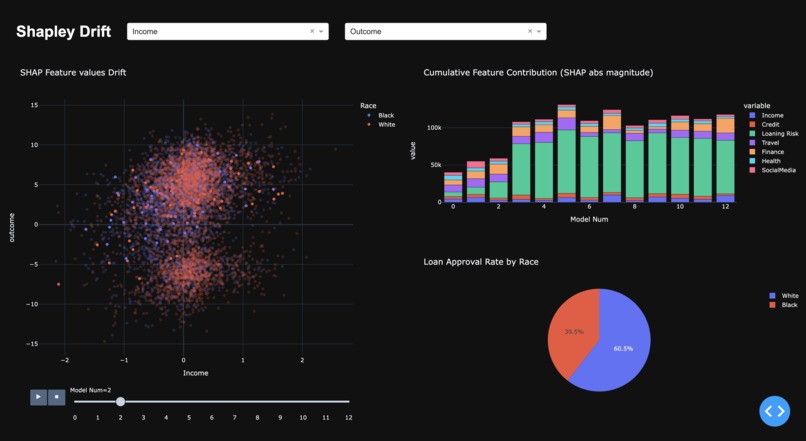
UI
-
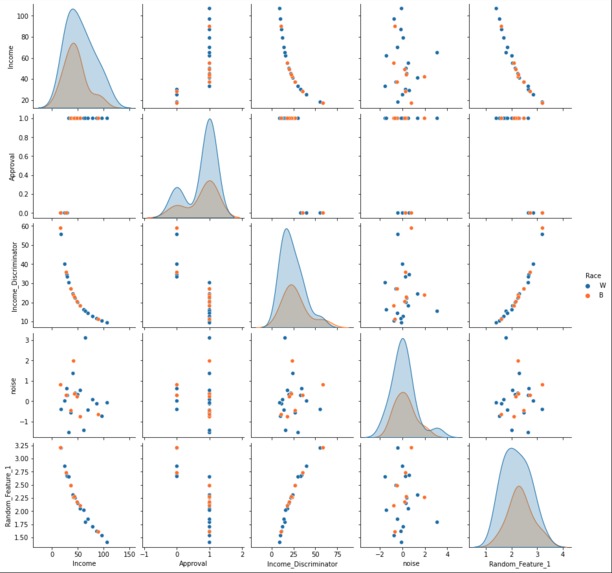
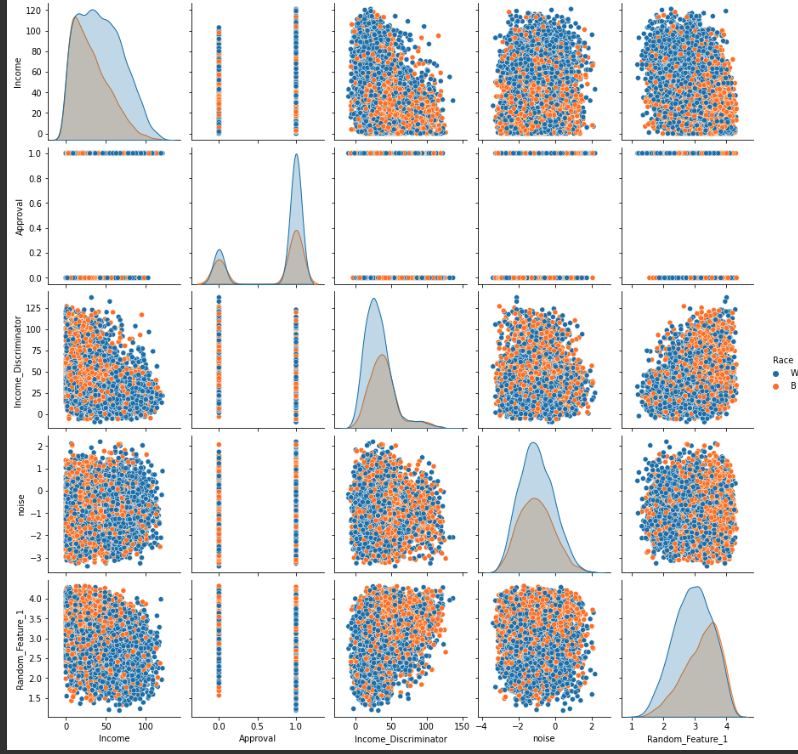
Feature Engineering Pair Plot
-
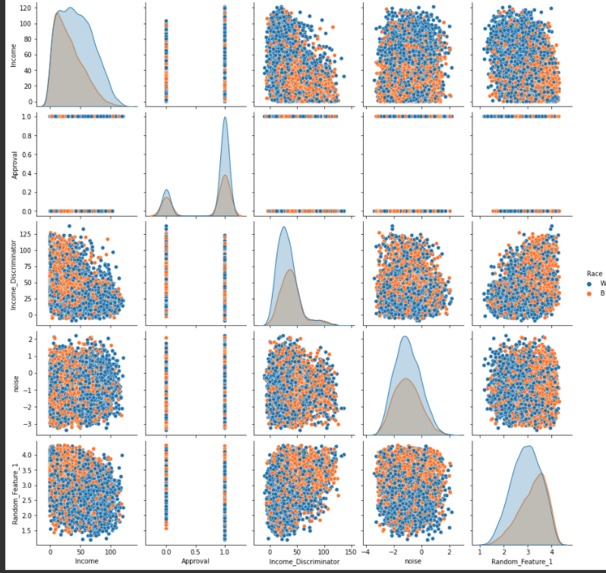
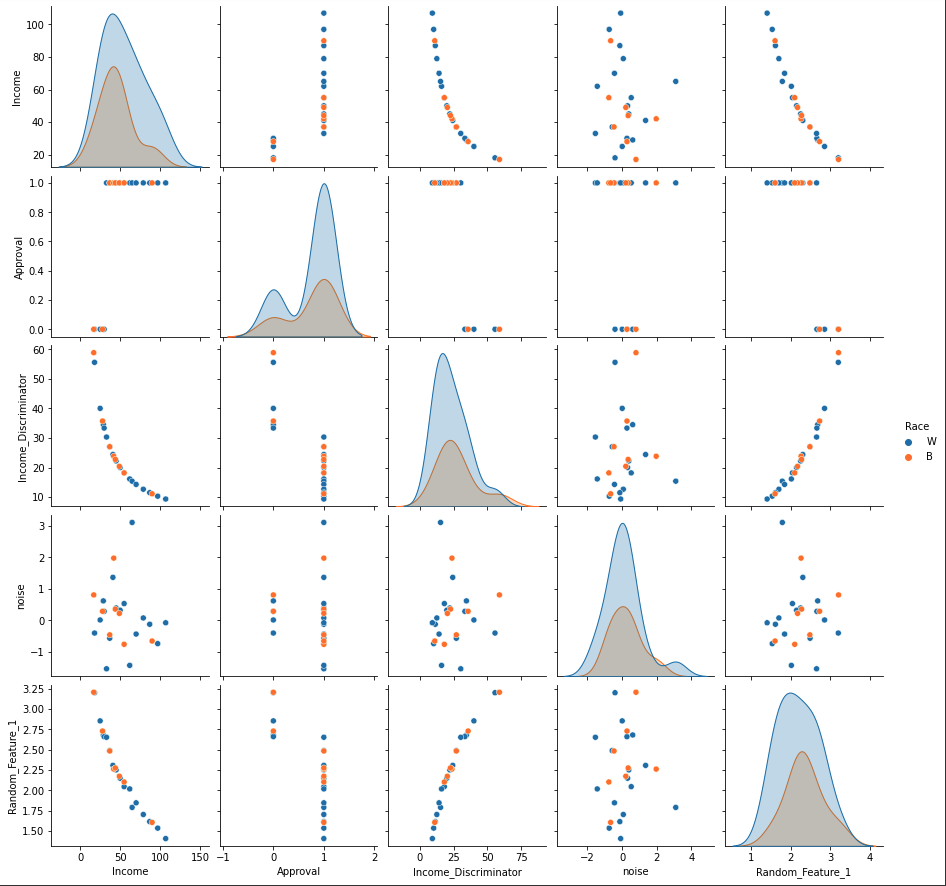
Feature Engineering Pair Plot 2

Inspiration
- In many human based ML algorithms that are based on human data there is phenomena known as drift. Drift is when the input of the model changes so the performance of the model changes as well. Drift is caused by cultural changes that occur in humanity, which therefore causes the input of the model to change. Our goal is to monitor and fix drift when it begins to occur.
What it does
- Our product analyzes machine learning results in a dash plotly dashboard. It allows us to analyze features contribution to the final output of our ML model and see how these inputs drift over time.
How we built it
- dRift was built with an end to end ML Pipeline. The overview of our processes was data acquisition, data pre preprocessing, feature engineering, cloud intake, machine learning algorithm, drift algorithm, and our frontend dashboard. Below you will find more detail in how each step of the process was built.
- Data Acquisition & Pre-Processing For our dataset we used mortgage approvals from the HMDA mortgage application dataset from the year 2017. We parsed out the fields of income, race( white or black only), and if they were approved for a mortgage or not. The dataset has 4,746,357 mortgage applications from the year 2017 that will be used to train a machine learning model aiming to mitigate bias in the mortgage approval process. The average income for a white family trying to get approved for a mortgage was 111k, and the average income for a black family trying to get approved for a mortgage was 88k.
- Feature Engineering Our feature engineering consisted of features built on top of our base income feature.The goals of our features were to show some correlation between the feature and if the mortgage was approved or not approved for the individual. The strongest correlated feature was the income discriminator, which is the income variable as the denominator of 1. We also added a feature that takes the log of income and a similar feature that squares income, this helps the model differentiate between different income classes A feature that is totally unique to this machine learning project is how the credit score of the entire population drifts downward from month to month. There are 5 different dataset of credit each later month has a deprecated credit score relative to previous months.
- Cloud Intake Our original plan was to intake data within an S3 bucket. However, since we had group members (AWS engineers) leaving our group, we had to unfortunately run our systems locally. 4.Machine Learning Algorithm The machine learning algorithm we used was our XGBoost algorithm, with default hyperparameters. The XGBoost algorithm is stored in a lambda function and is trained on the first month’s dataset, which will allow us to further see the data drift of our models. 5.Drift Algorithm ** We are using shapley values to determine the contribution of each of the features toward the final output and viewing how these contributions change over time. 6.Front - End Dashboard** Our front end dashboard is being created with Dash Plotly which is a python external library that allows data scientists and software engineers to develop visually appealing web based dashboards. This will allow us to visualize our drift.
Challenges we ran into
-Datasets: The first challenge we ran into was deciding what sort of data set we wanted to use for our drift prototype, while still finding a dataset that aims to mitigate bias in a social area. The first dataset we tried that aimed to achieve these two goals was recidivism prediction and try to perceive any bias in these algorithms that may arise from race. Ultimately this dataset did not have continuous data which was essential for our drift model. -Management: Two of our teammates dropped out on Thursday due to exams, they were both part of our AWS team, which really slowed our progress down. This resulted in us recruiting two new team members in the last 24 hours of the challenge, to help us out with AWS engineering. In addition, four out of six of team members had exams this week they had to study for which didn’t allow our full attention to be on our hackathon and instead on our studies. Due to our large team size it was also hard to manage our team members and assemble all of our moving parts.
Accomplishments that we're proud of
Model Results: We are proud of our ability to predict if the applicant will be approved for a loan or not. Our Dashboard: Our dashboard allows Machine learning engineers and data scientist to easily measure if drift is occurring in their classification models.
What we learned
Project Management: We learned how to manage a team of software engineers and data scientist to work cohesively together virtually. Data Quality: We learned the importance of data quality when it comes to machine learning. The more closely data is to reality the more applicable our results are to the real world, and the better our model results tend to be. Feature Engineering: We learned the importance of engineering quality features that have good correlation with the classification of the ML algorithms AWS Team work: We learned how to piece together different pieces of the AWS pipeline that are being developed by different data engineers, data scientists, and software engineers.
What's next for dRift
-Drift is still in development and has a few things to change before it could be used in ML Deployment Analysis workloads. -Ability to monitor categorical models -Ability to analyze deep learning and reinforcement learning deployment drift. -Fix choppiness of dashboards -Create a client interfacing web app


Log in or sign up for Devpost to join the conversation.