
Inspiration
As a group of college students approaching the twilights of our academic careers, we have been forced to start thinking about our next steps in life and where we would want to start our new careers. As we consider where to start the next chapter in our lives, it made the most sense to create an application that provided the best combination of personally tailored living conditions. Thankfully for us, the HPCC Challenge at UGAHacks8 allowed us to fulfill some of our personal goals while simultaneously competing with others and learning new ways to code. In part, we were fortunate enough to be able to attend two HPCC workshops, where we learned about ECL and the possibilities that lie within the infrequently used coding language.
What it does
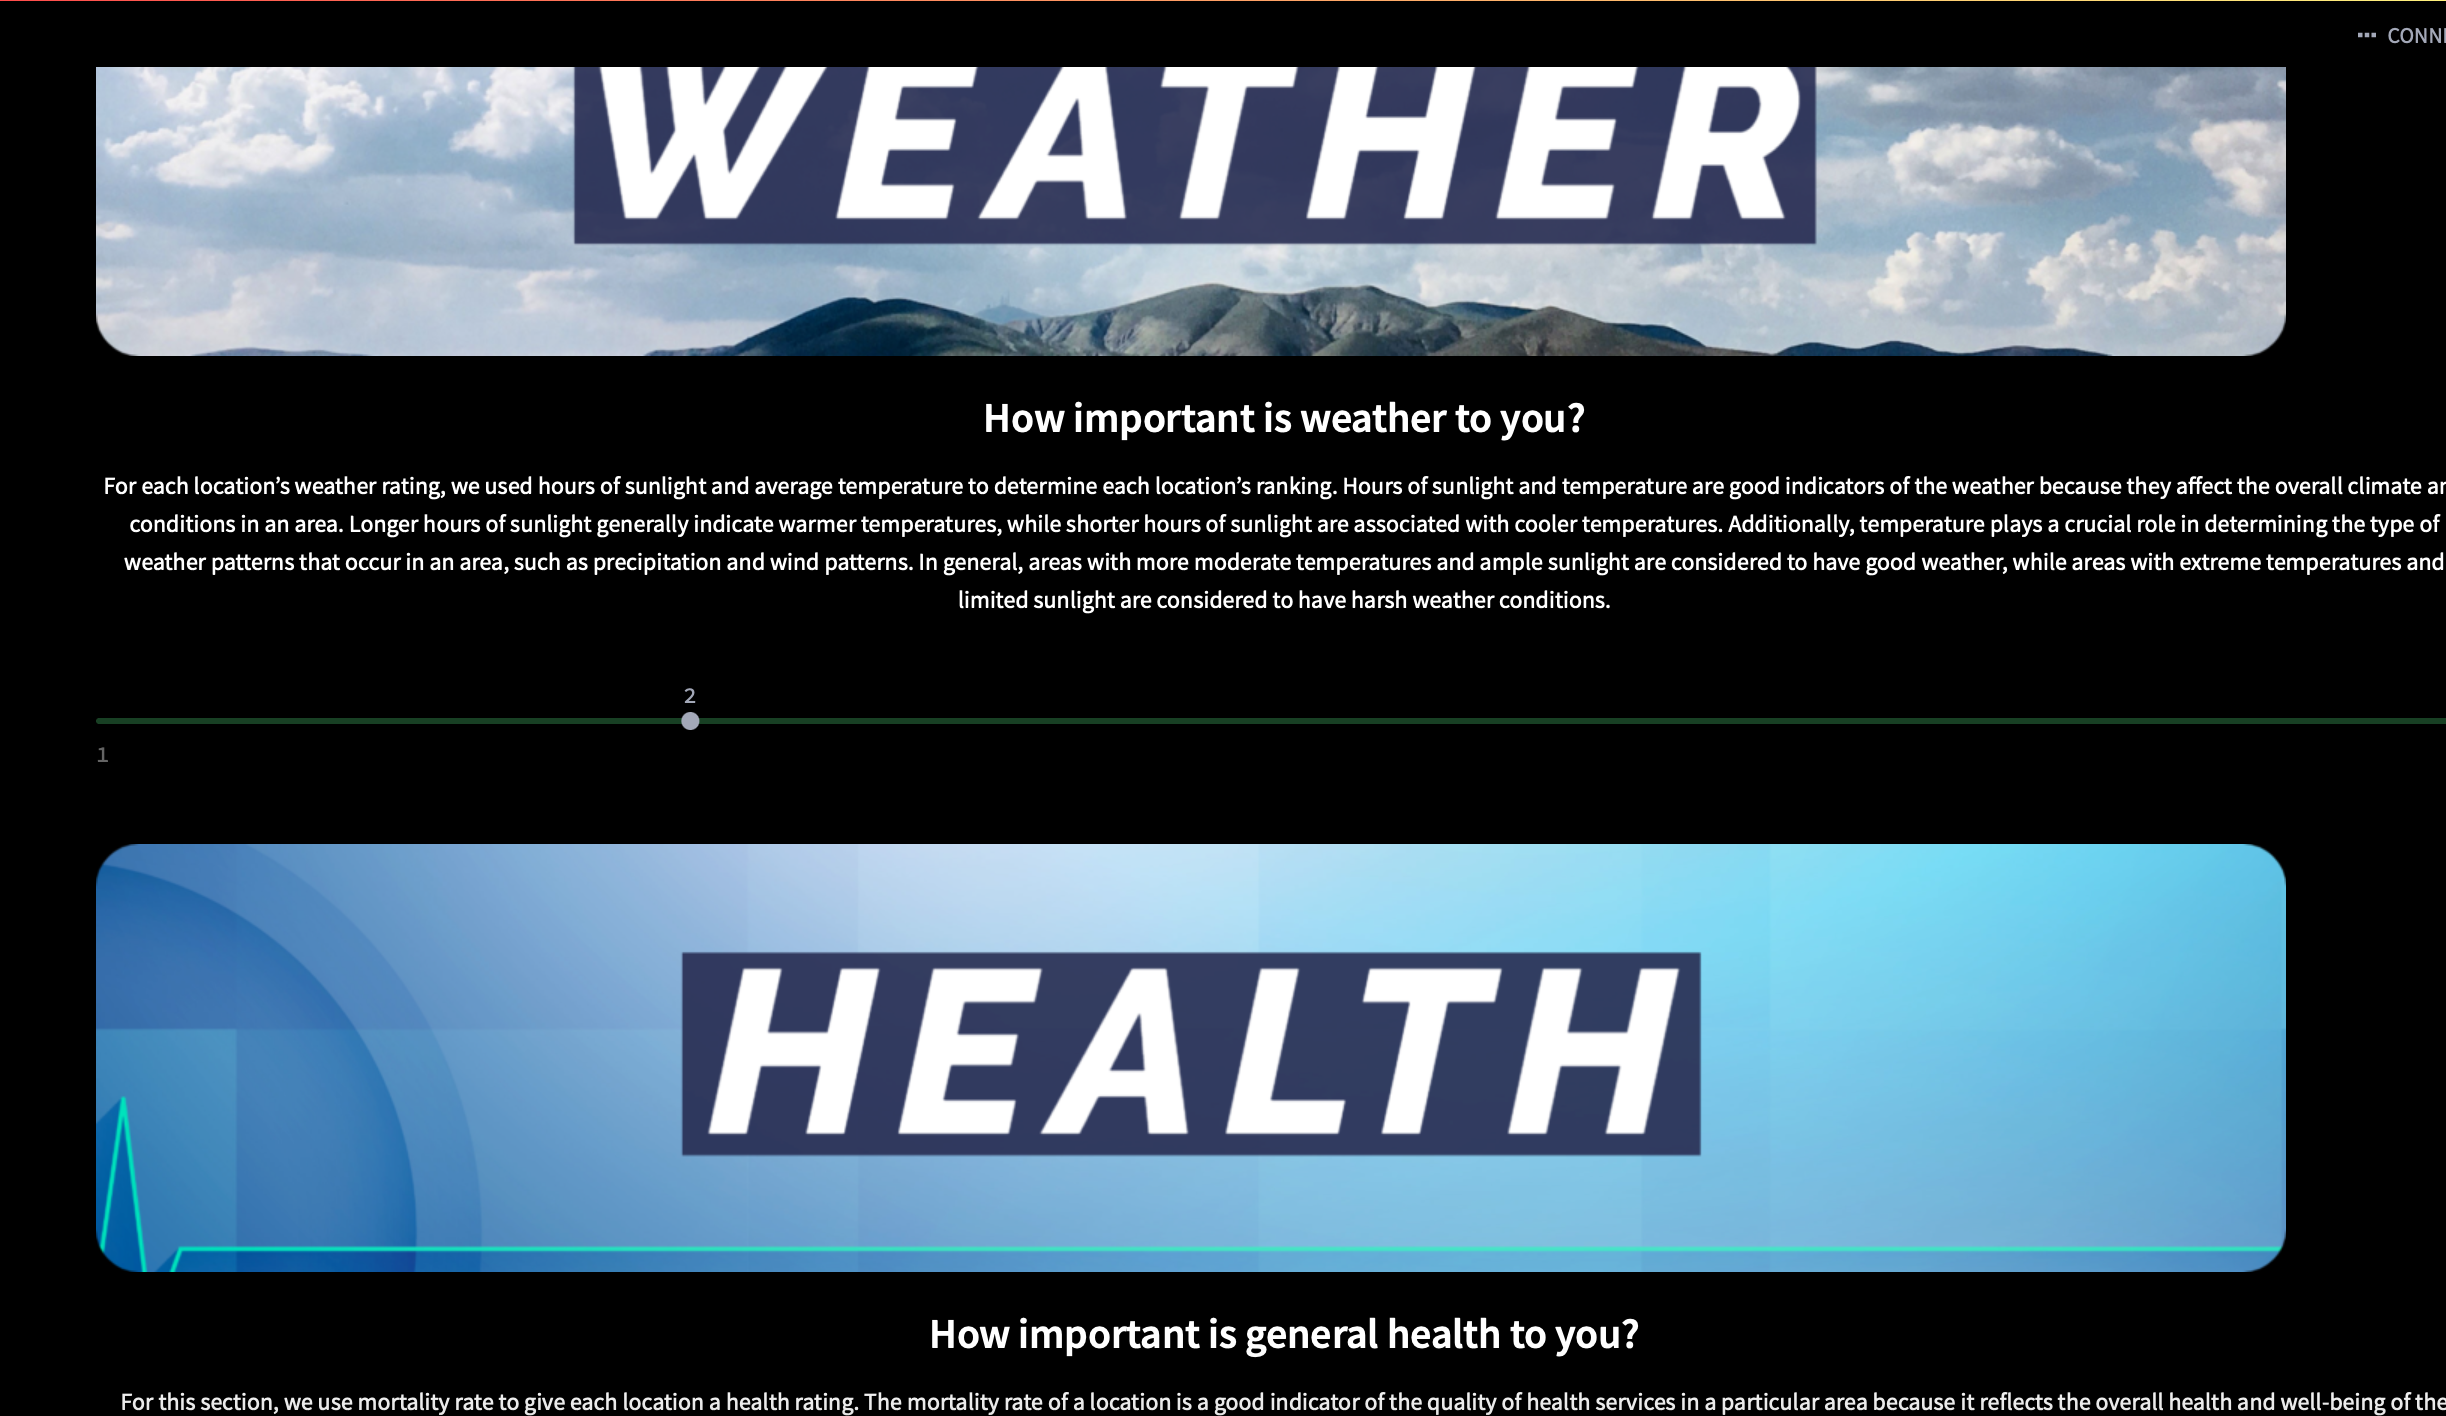
DreamHaven is the ultimate solution for those seeking a new destination. Our platform is visually appealing and easy to use, making the process of finding your ideal location a breeze. Simply take our short quiz that assesses your preferences in categories like climate and weather, healthcare and safety, and more. Our built-in algorithm will analyze your responses and provide you with a personalized recommendation for your new home. What sets DreamHaven apart from other similar platforms is its additional features. We understand that moving to a new place can be daunting, which is why we offer a state similarity feature that helps you compare your current state to similar ones that may match your needs. In just a few quick clicks, DreamHaven takes the confusion and stress out of relocating. With its visually appealing interface, easy-to-use design, and helpful features, you'll have the confidence to make an informed decision and start your new life in your dream destination.
How we built it
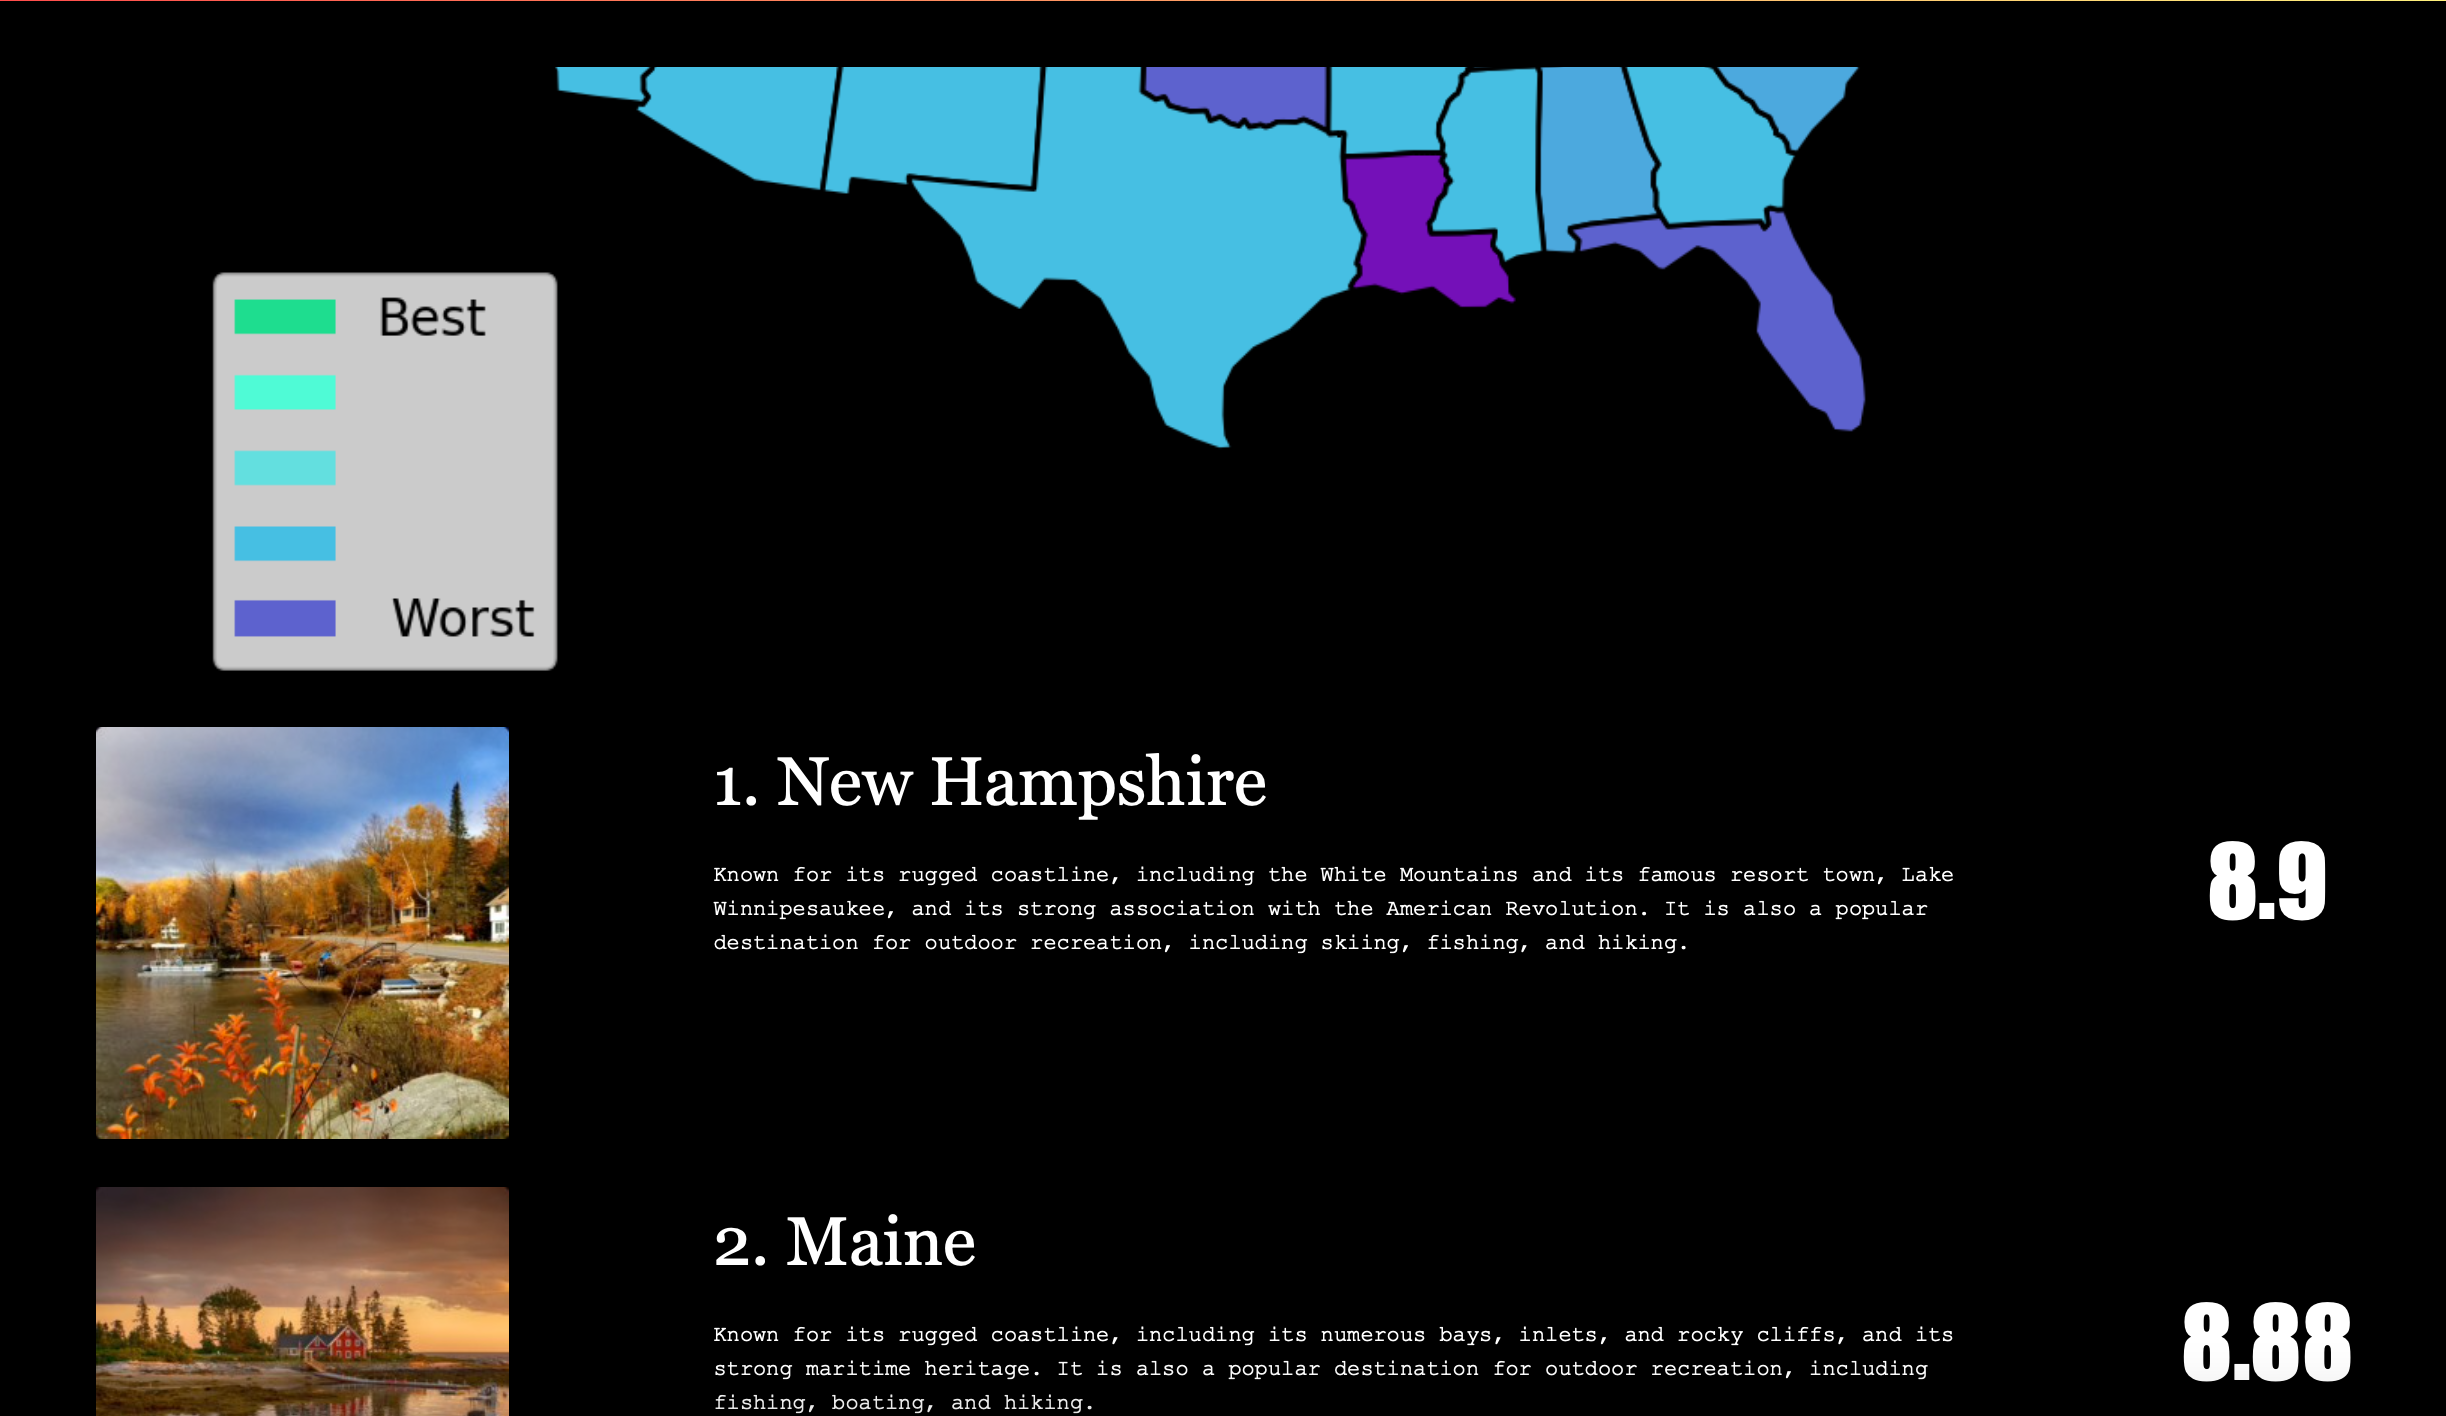
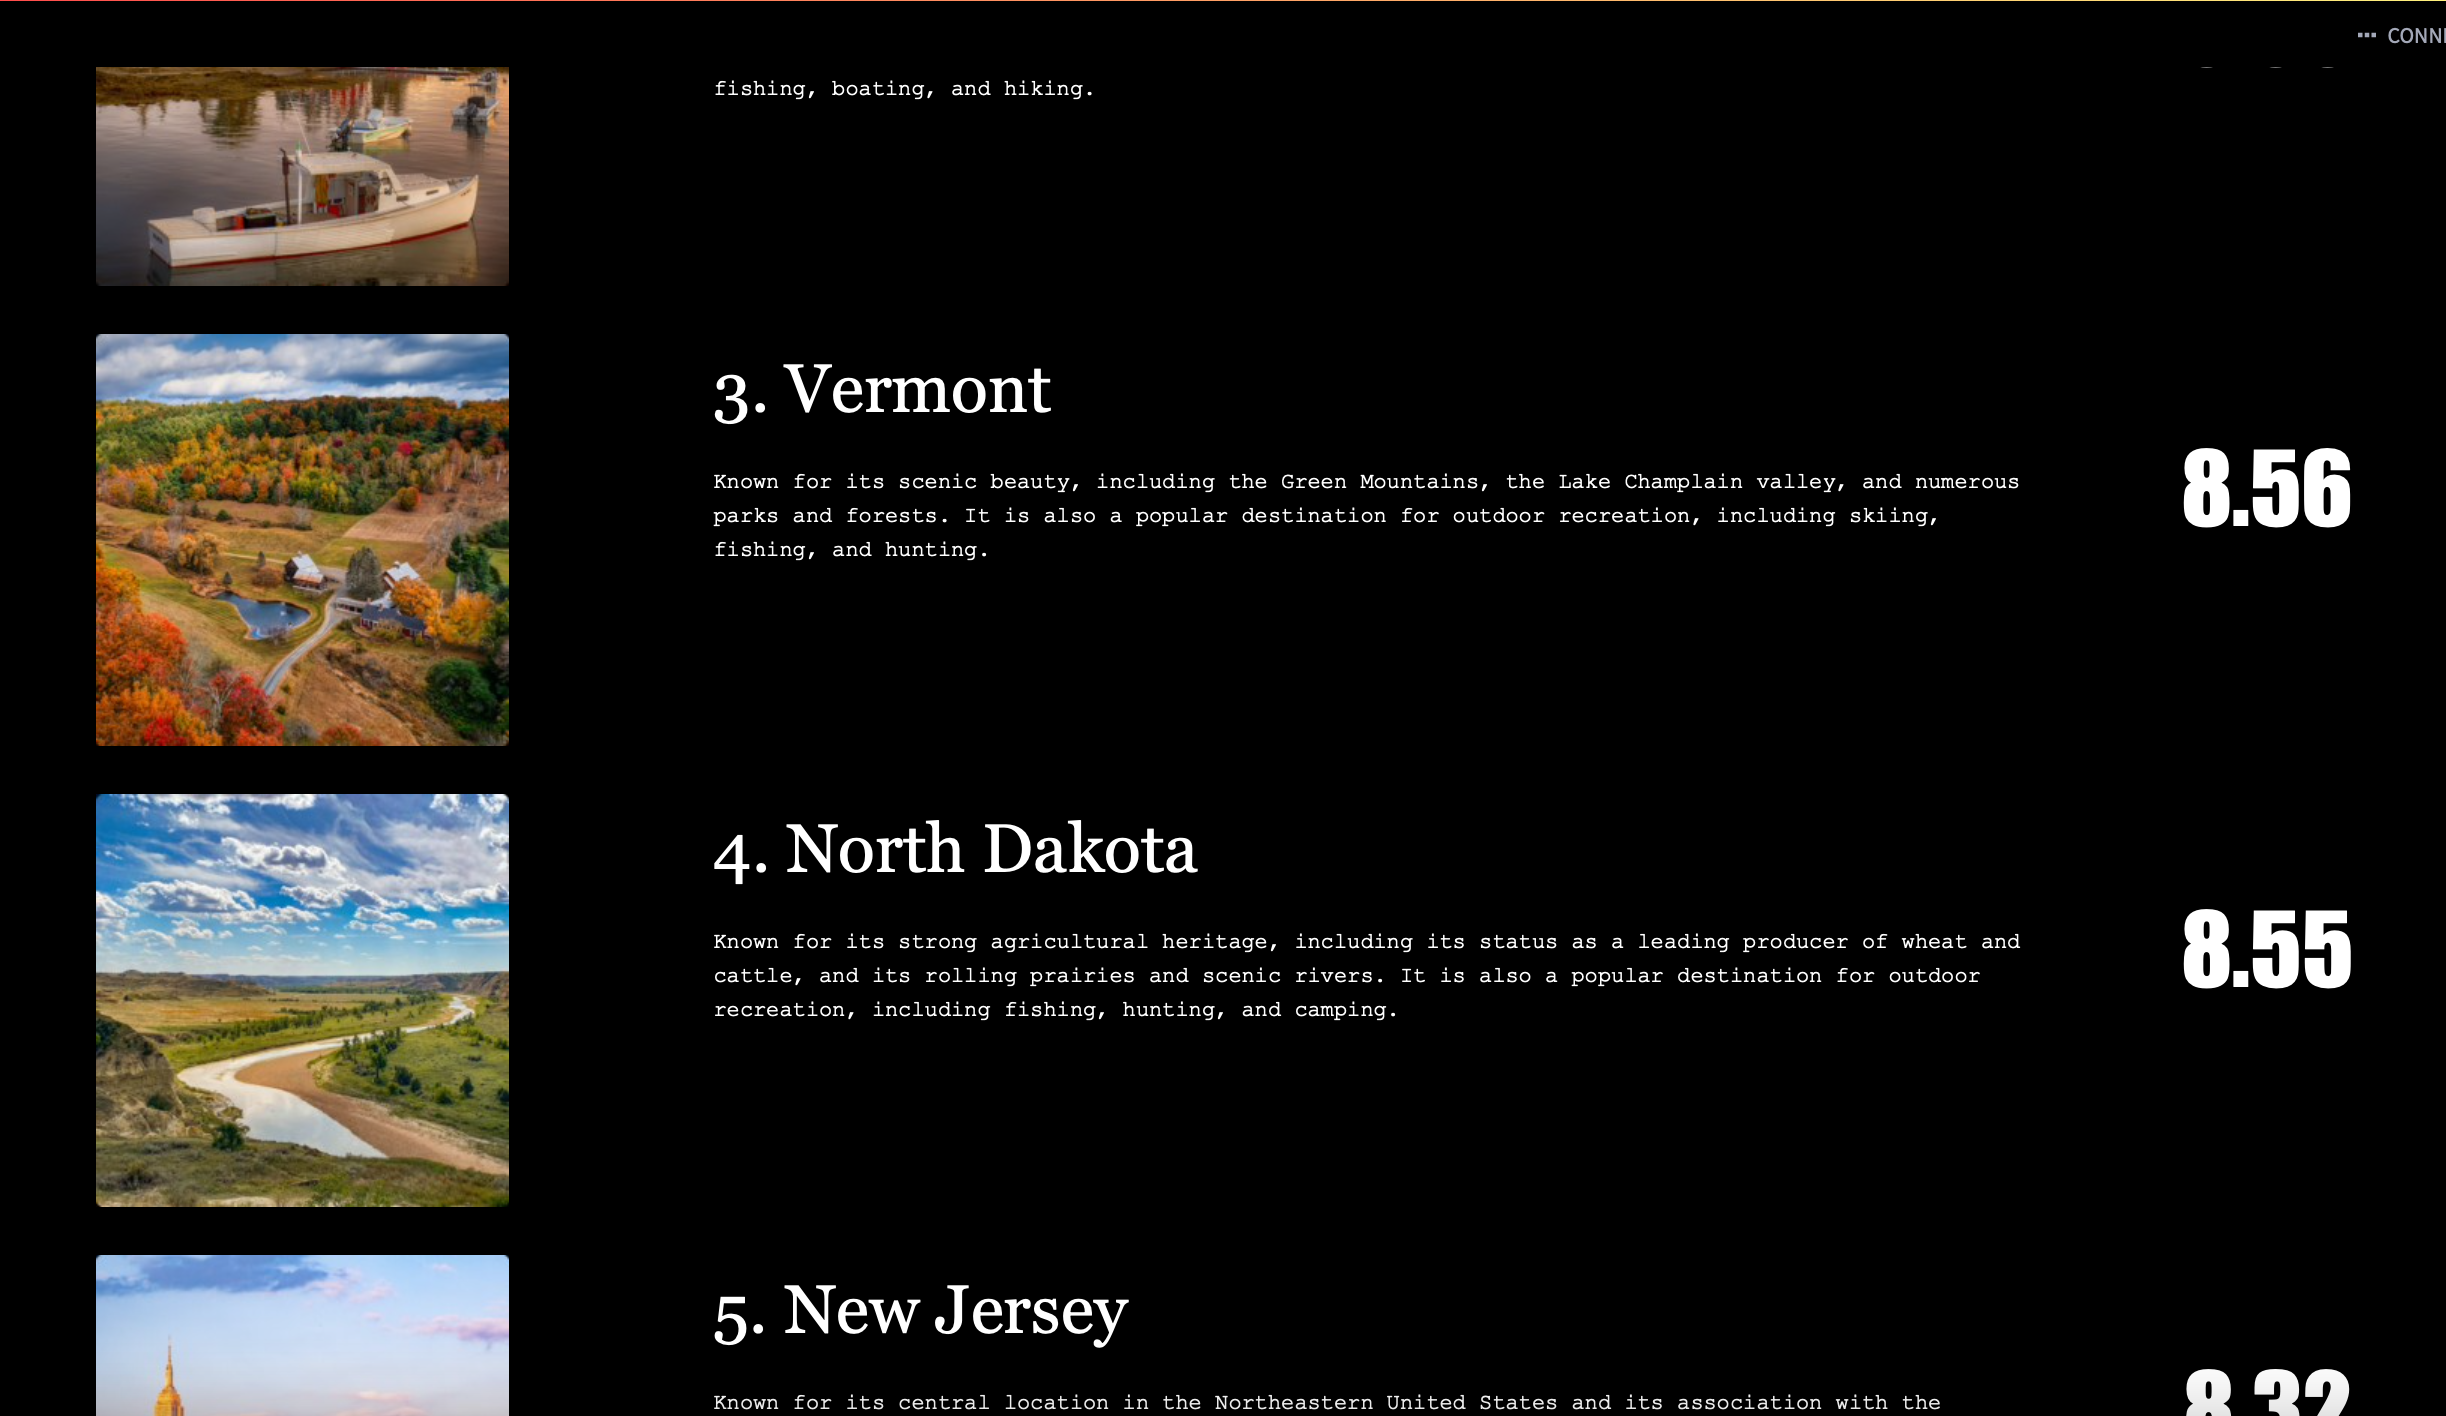
**ECL - We decided to use some of the cleaned data to create some normalized scores with a mean of 0 and a standard deviation of 1. We decided to normalize our data so that the extra wright could be assigned by the sliders that the user enters on the website. We standardized mortality in 2014 for health, teacher/student ratio for education, and violent crime and property crime. Outside of the provided data, we decided to use a dataset containing the amount of sunlight a state gets on average rom Current Results Weather and Science Facts), the average temperature (from Current Results Weather and Science Facts), and the mean rent price to estimate cost of living (Zillow House Prices). We normalized these variables as well. We created a visualization to get a composite score of what our “Best Overall States” were based on our criteria. This chart is discussed at length in our video. We also decided to perform KMeans Clustering in ECL, as can be found in the kmeans.ecl file. We trained this on all of the normalized data discussed above. Each state was assigned to a cluster, and every other state from the cluster is shown on the webpage whenever one state from the cluster is entered by the user. This allowed us to find the most similar states to the one the user inputted, so we were able to make effective recommendations.
We added the data by spraying it with ECL watch and then retrieving it with ECL in our code. We exported the data by outputting it as a csv to thor, from which we de-sprayed it and subsequently downloaded it to our local machines.
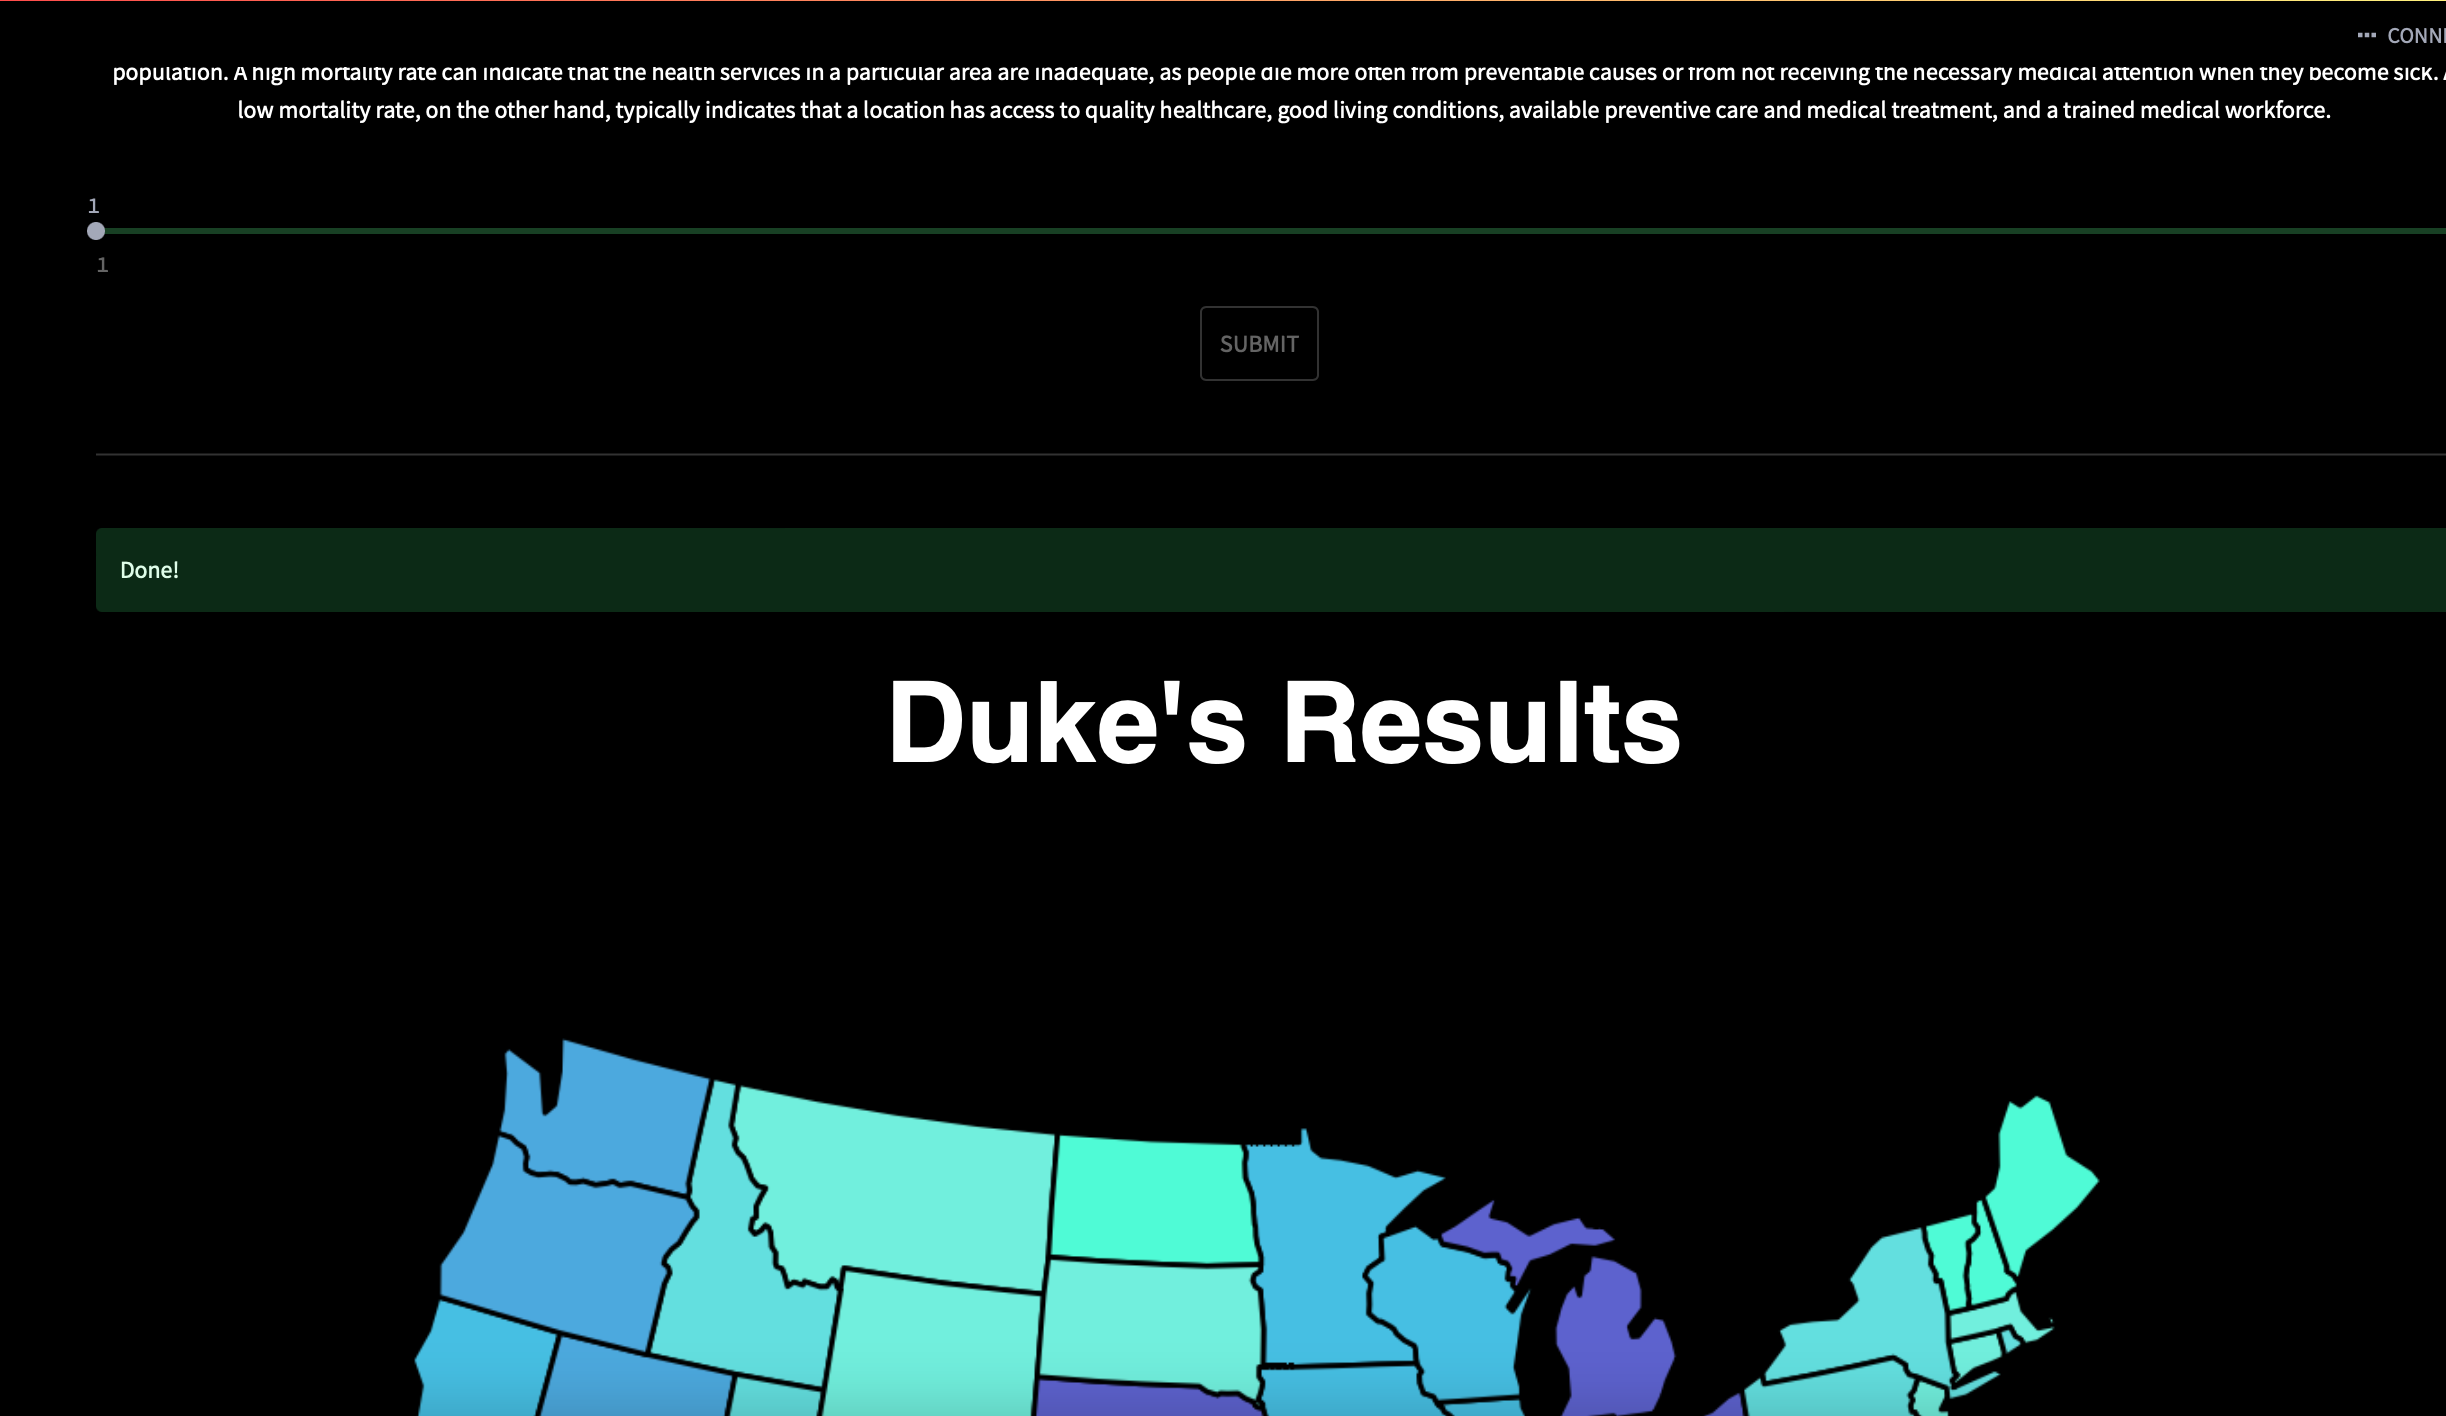
**Python - After we had done our data ETL operations with ECL, we decided to further use this data and also provide a powerful user experience with Python. We wrote functions in Python that allowed us to quickly calculate scores based on a user’s input for their sense of importance toward each category, and then queried the CSV with Python. We also wrote functionality to accept a user's input for a state, with which we retrieved the KMeans values determined with ECL to give the user a list of states that are the most similar to his desired state. We also decided to make a dynamic heat map to further help visualize the results of our ECL computations. Not only did we add this heat map, we also made it dynamic so that it’s appearance is not only based on the calculations we did in ECL, but also based on the input of the user; each time a user enters in unique values for their categories, the heat map will reflect that! We did this with a python library called “cartopy”, combined with matplotlib and other python libraries. **Streamlit- Using streamlit, we wrote an interactive program that took in user data, calculated personalized matches using the provided ECL database, and returned the results to the user in a streamlined interface. We included descriptions of all 50 states, along with images for the user to imagine their stay. Also, we added a function to allow users to find states similar to ones that they input.
Challenges we ran into
From the Python perspective, one of the most challenging parts was properly creating functionality to calculate scores and visualize the data, while maintaining the ability to communicate with the ECL data and integrate well with the front-end framework. The python functions we used had to serve as a pipeline between the data and the front-end, and there were data compatibility issues. We also had several issues with integration, especially with the several different python libraries that we used and conflicting dependencies. As Streamlit is a relatively new framework, there were many challenges that came along the way when creating the front-end interface. It does not contain the many features and design libraries provided with languages like Javascript and HTML/CSS, therefore it was a challenge for us to navigate Streamlit and use it to bring the user interface to life. Designing something as simple as a button, adding spacing to components, or incorporating a dictionary into visual elements required a learning curve.
Accomplishments that we're proud of
Learning new programming languages can be a difficult task, but learning a new one in less than 48 hours, and creating a functional application using utilized methods is an entirely different beast. We are quite proud of the fact that we were able to use ECL to gather and display data.. Learning a new coding language so quickly was a unique challenge that none of us had faced before. We are proud that we were able to push through this hardship and come out positive on the other side. This project has easily been one of the biggest learning experiences in our coding careers. Another big accomplishment was utilizing Streamlit to its fullest potential. We were able to craft a dynamic website containing malleable display variables influenced by data obtained from ECL. We are proud that we were able to display our findings aesthetically, which was only made possible through our cohesive teamwork.
What's next for DreamHaven
DreamHaven has the potential to grow into a comprehensive platform for those looking to relocate. In the future, we could add features such as cost of living comparisons, job market analysis, and school ratings to help individuals make informed decisions about their new home. Additionally, we could expand our services to include resources for renting or buying a home, as well as assistance with the moving process. As DreamHaven continues to evolve and grow, our goal remains the same - to make the process of finding a new home as seamless and stress-free as possible. By offering a comprehensive platform with a variety of features and resources, we aim to help individuals confidently embark on their new journey in their dream destination.
Built With
- adobe-express
- ecl
- ecl-watch
- python
- streamlit
- thor


Log in or sign up for Devpost to join the conversation.