-
-
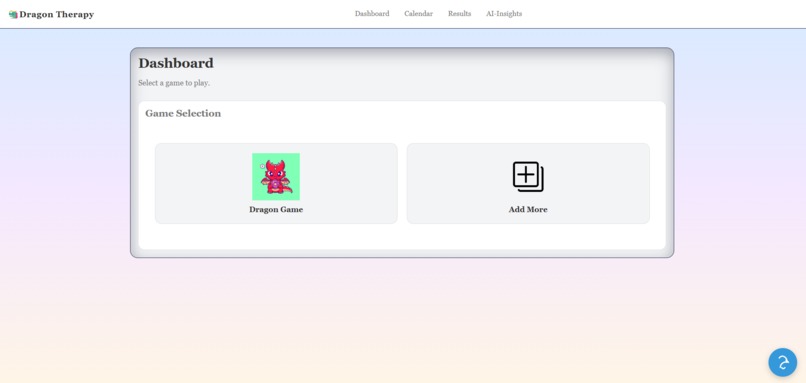
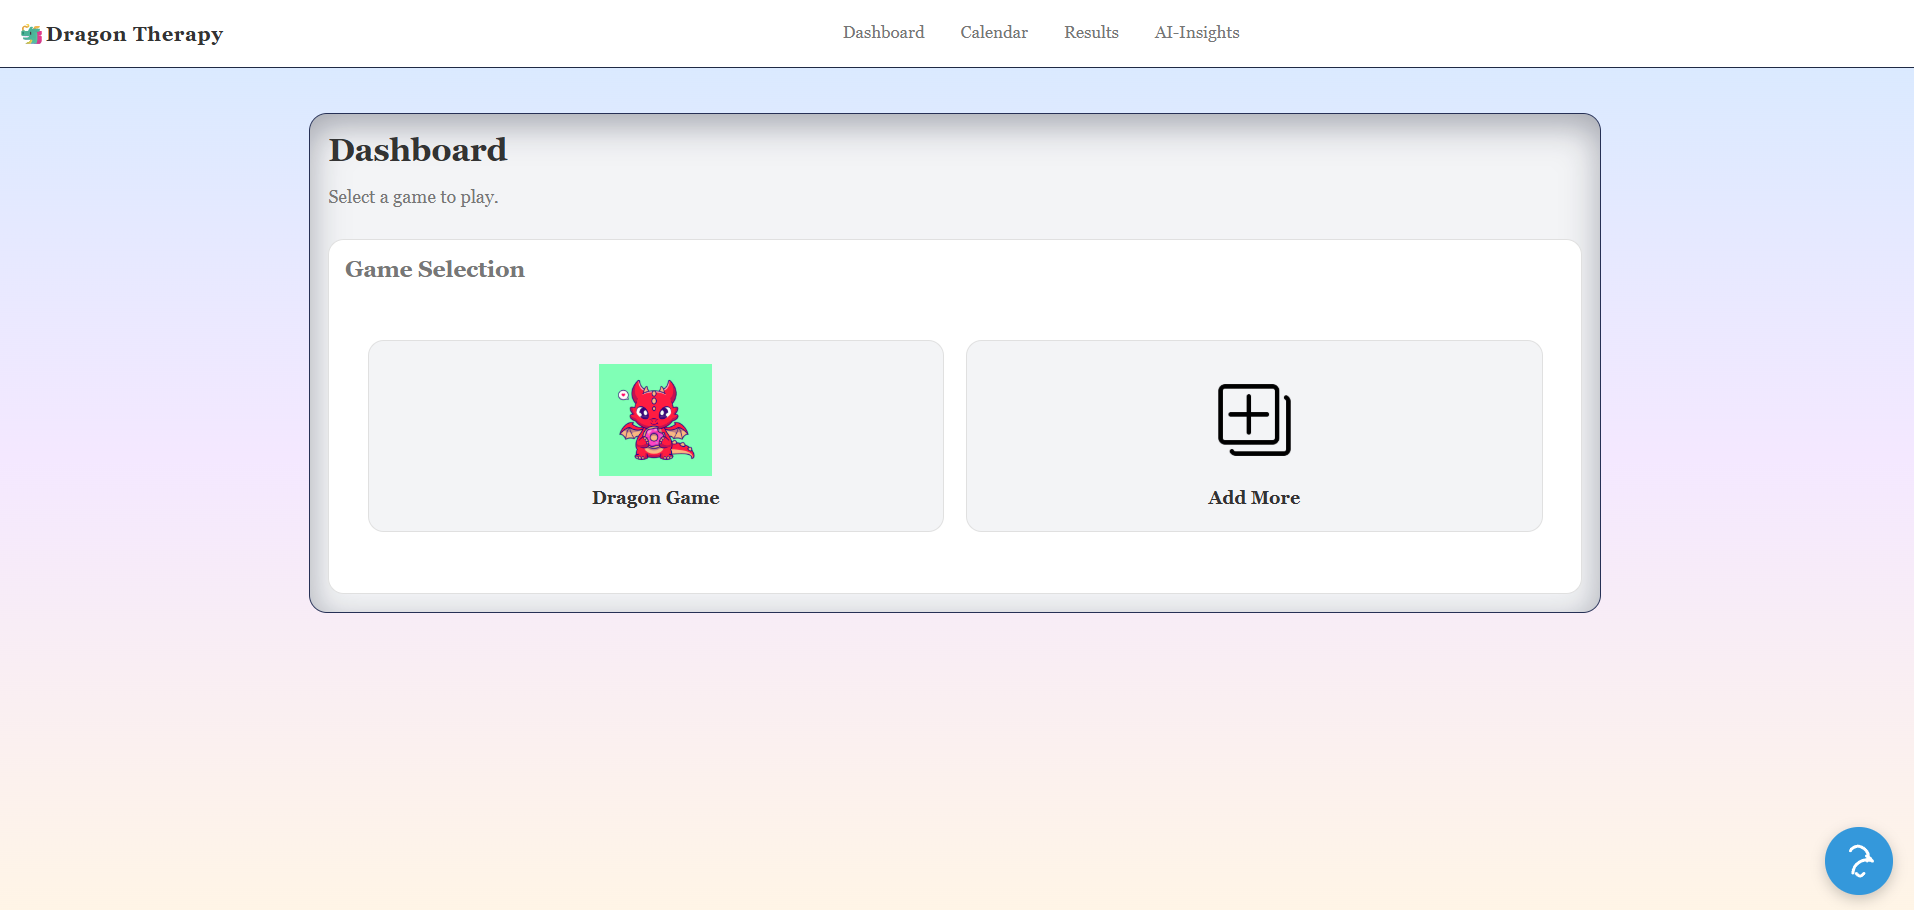
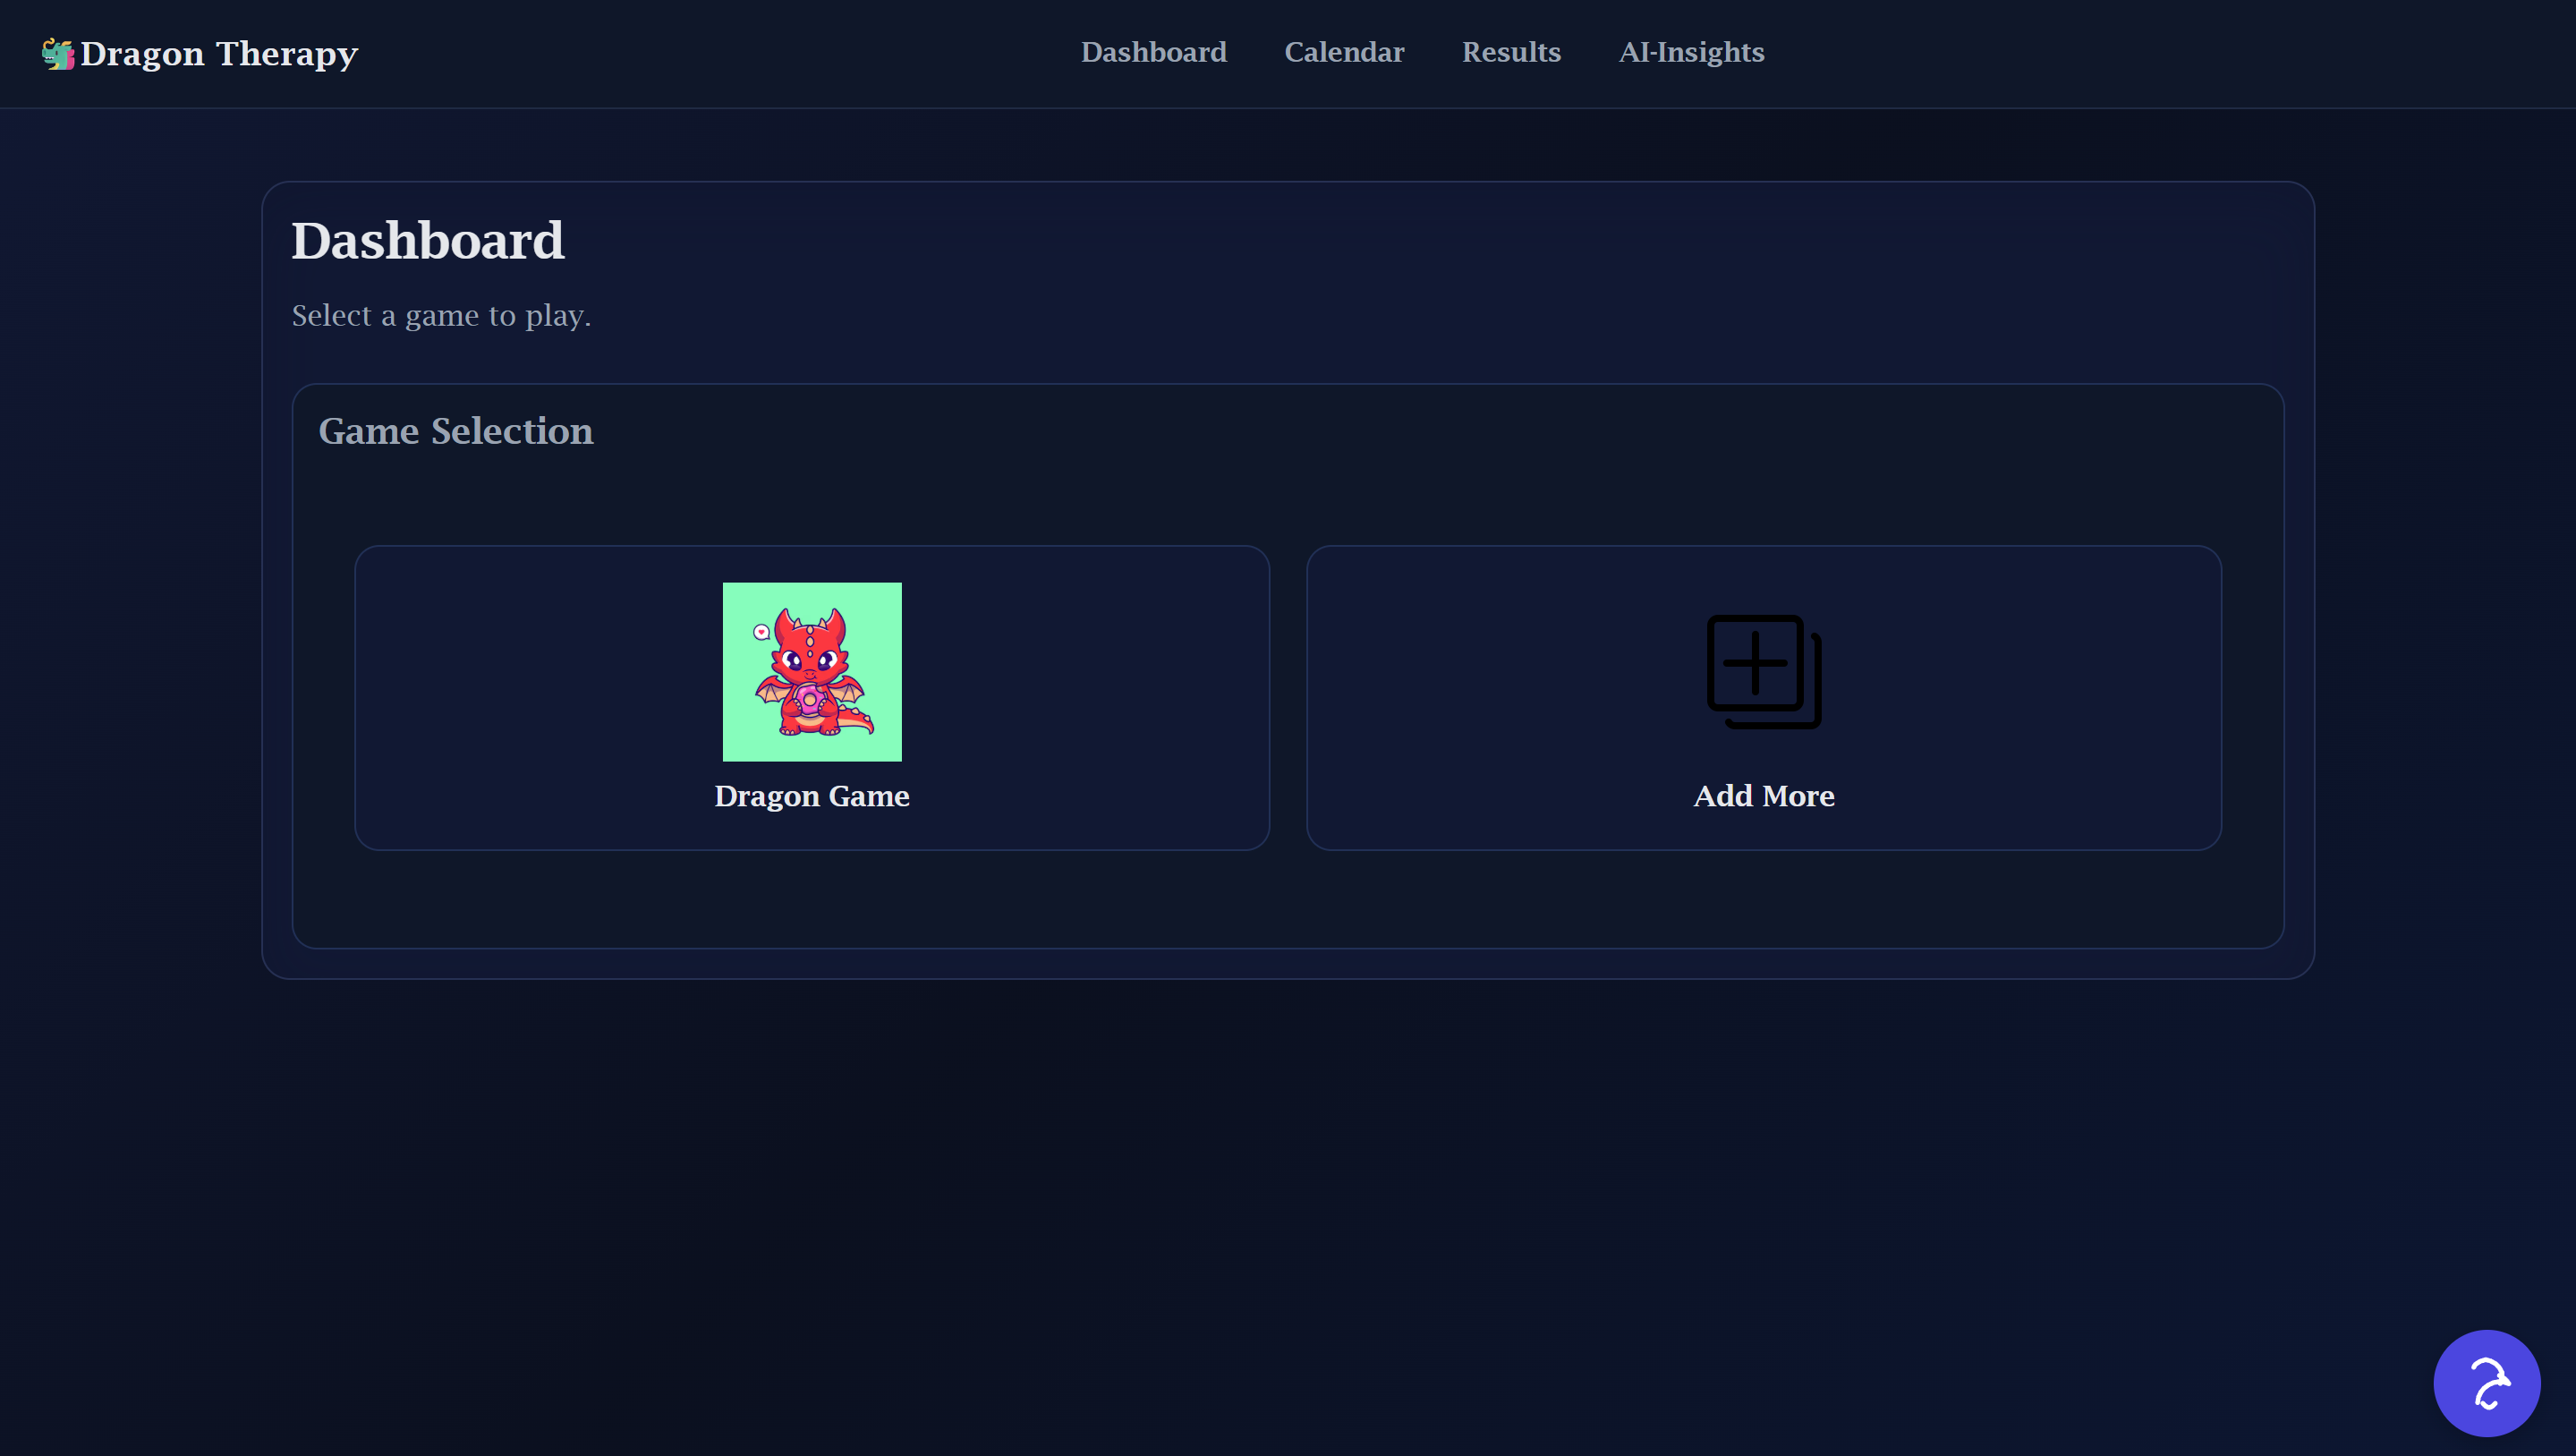
Home: Dashboard (light mode)
-

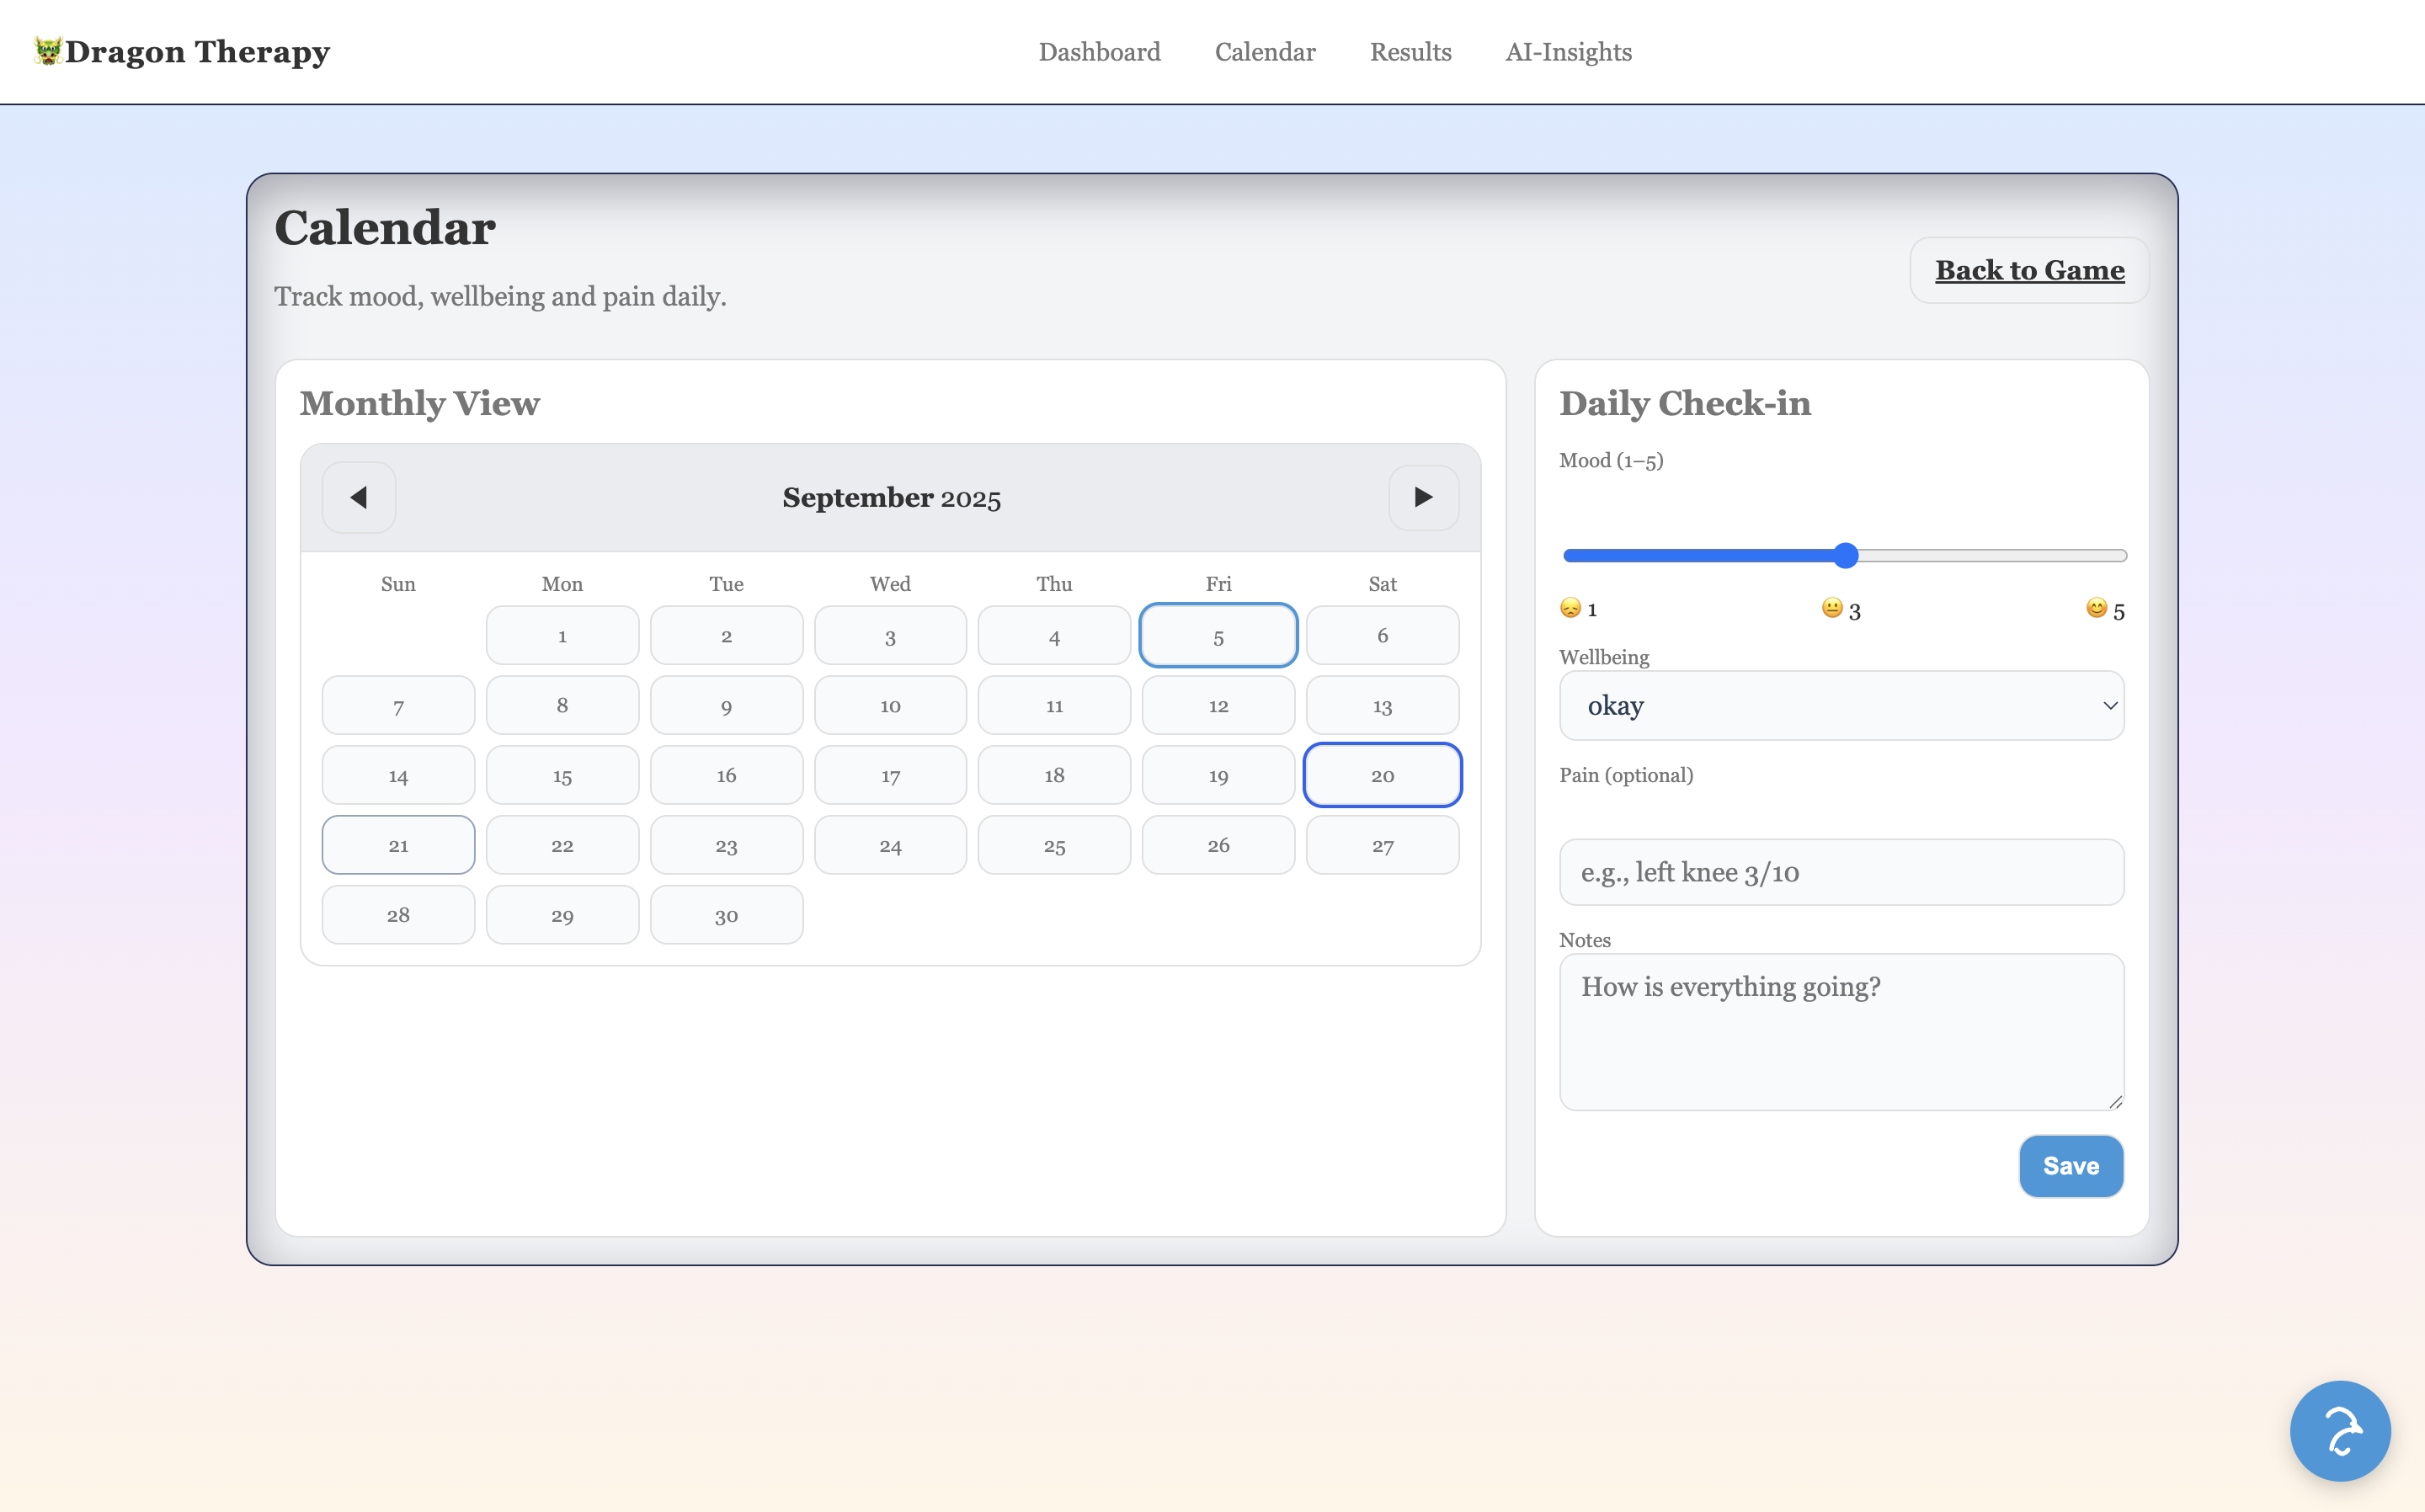
Calendar View (light mode)
-
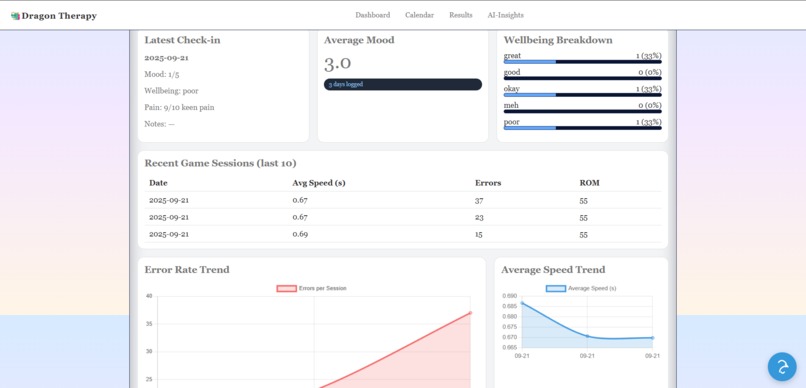
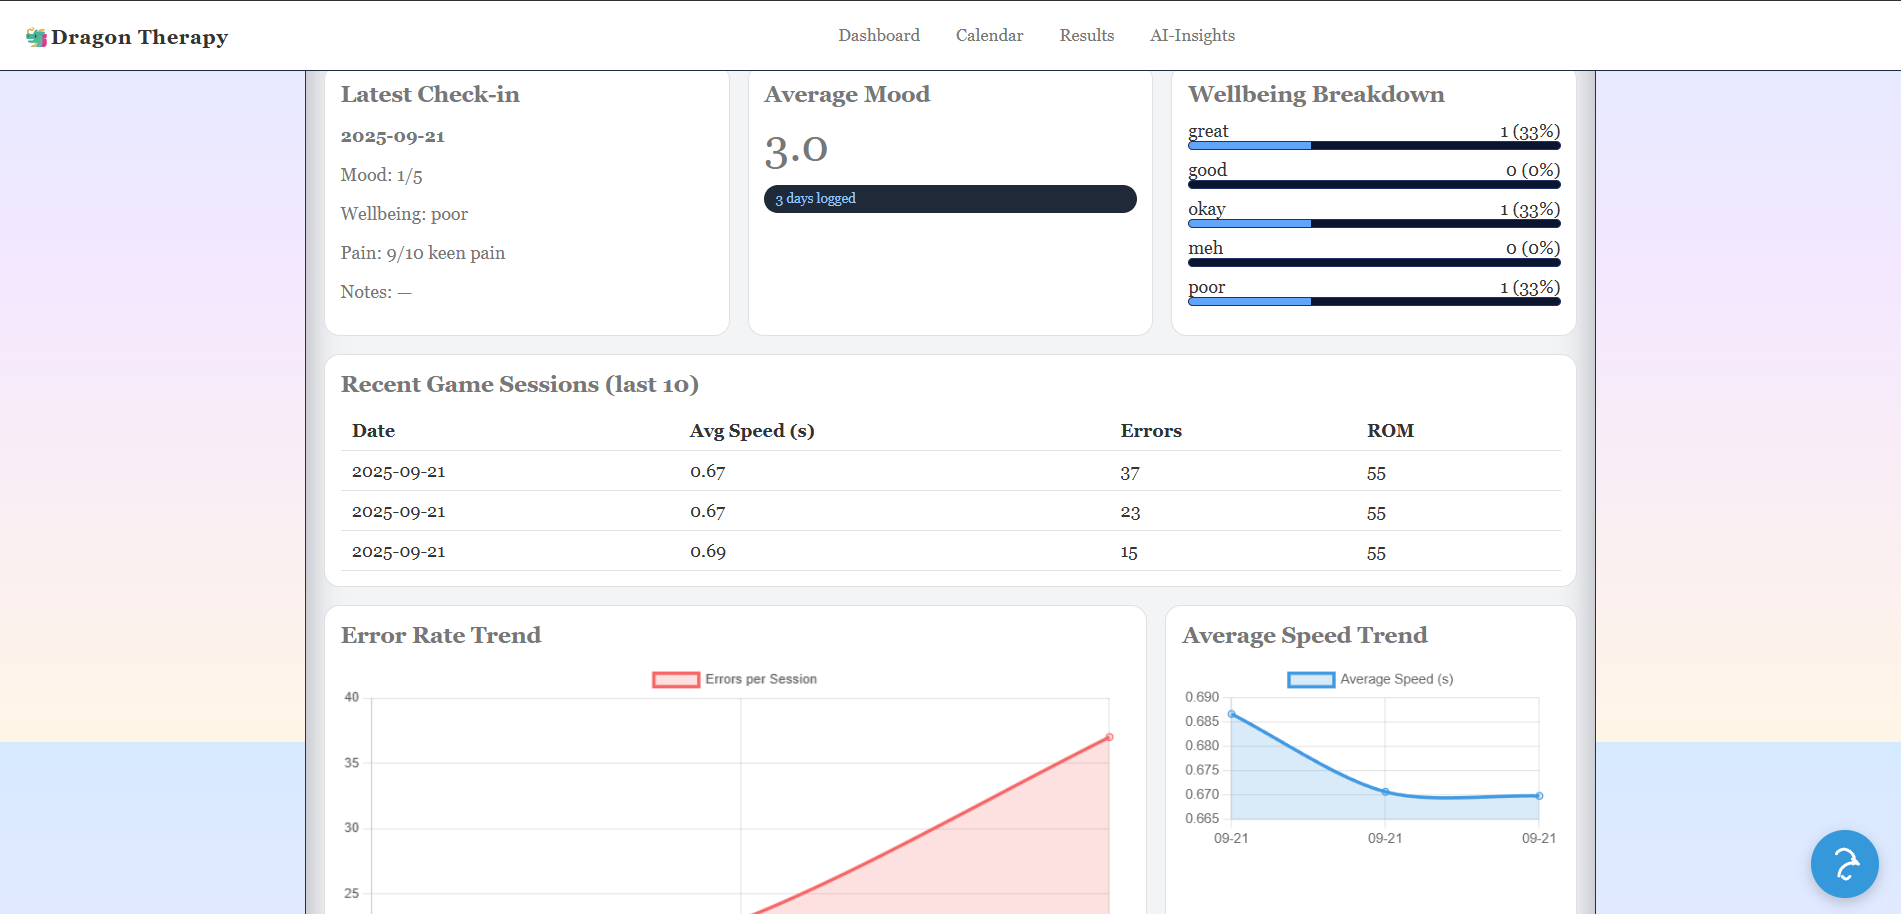
Results Page (light mode)
-
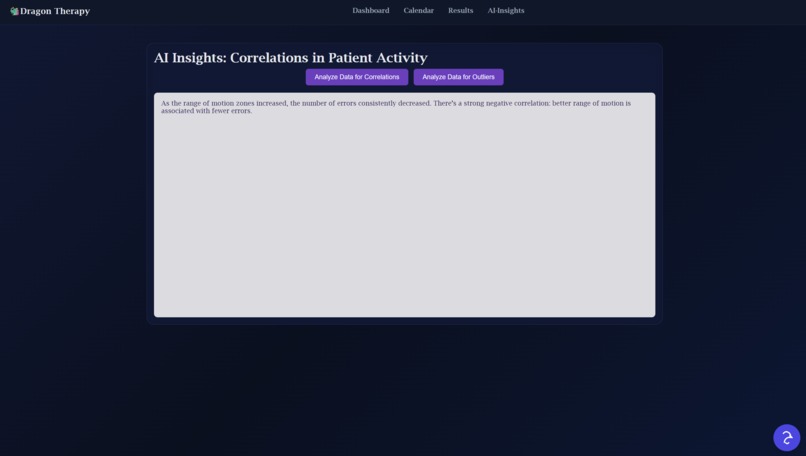
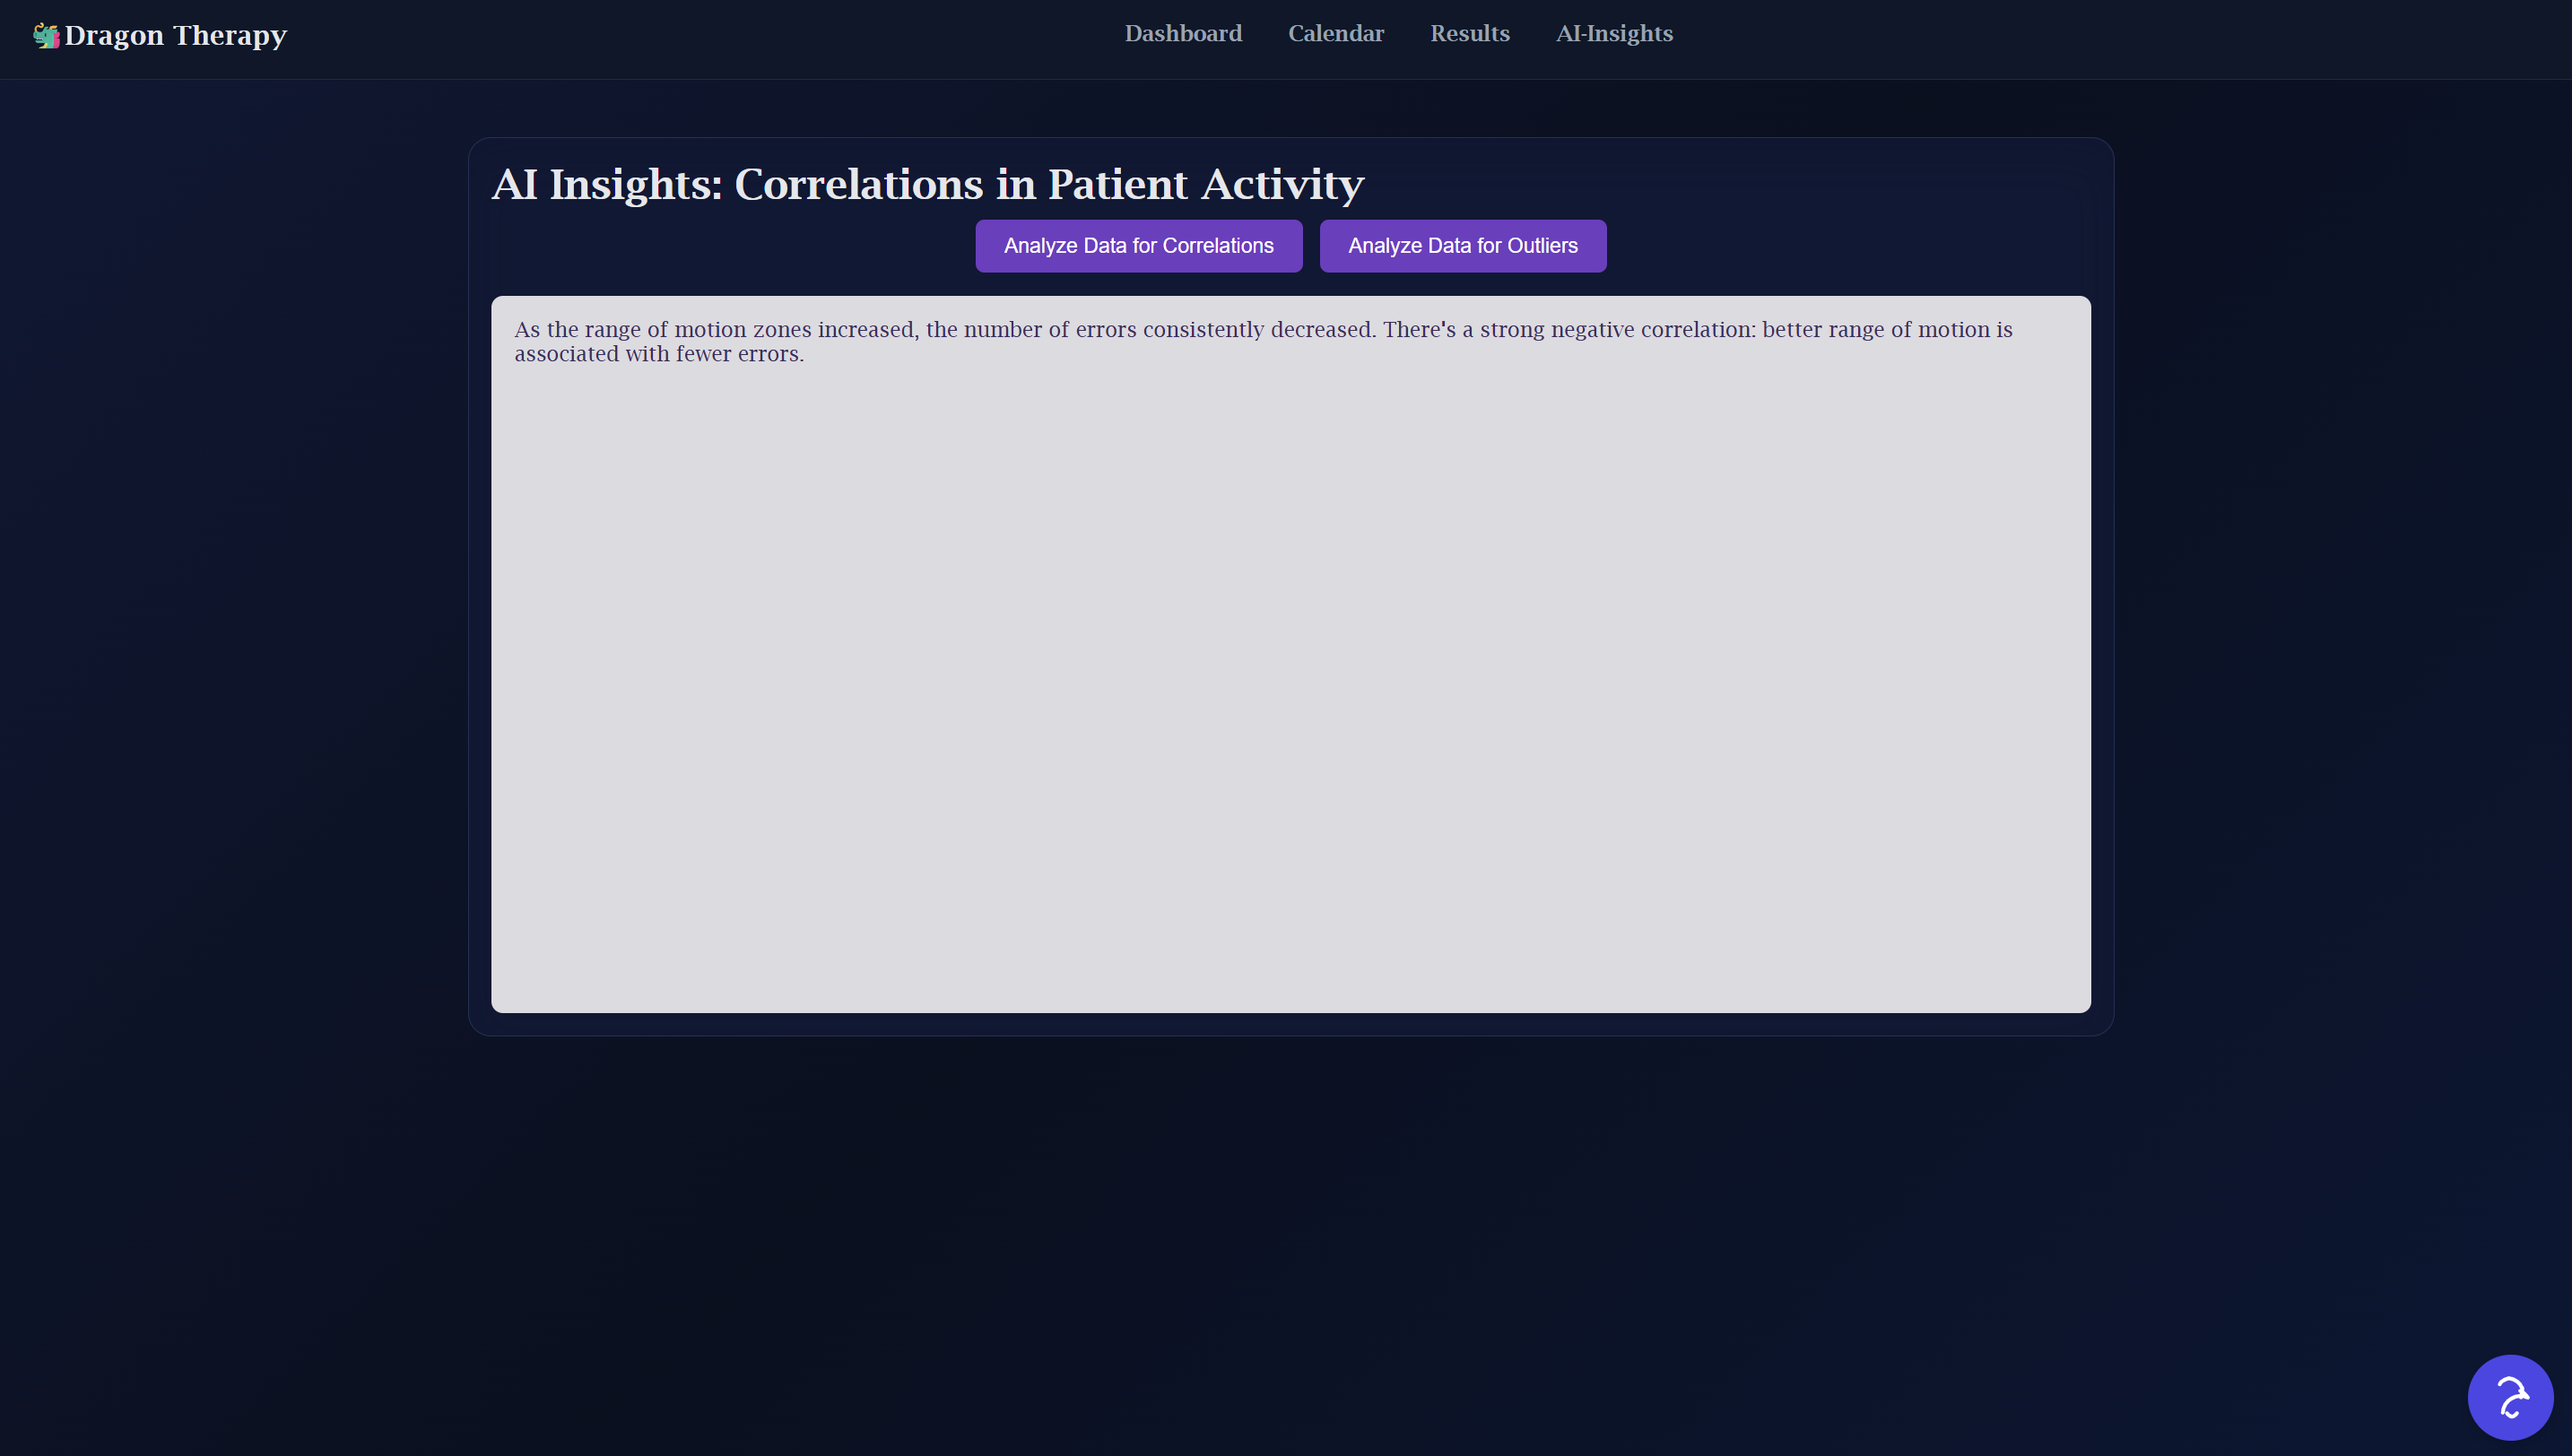
AI Insights: Analyze Data for Correlations
-
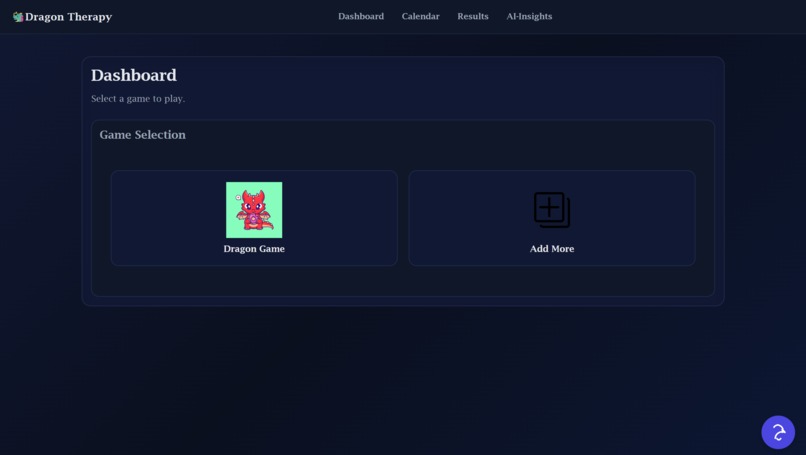
Home: Dashboard
-
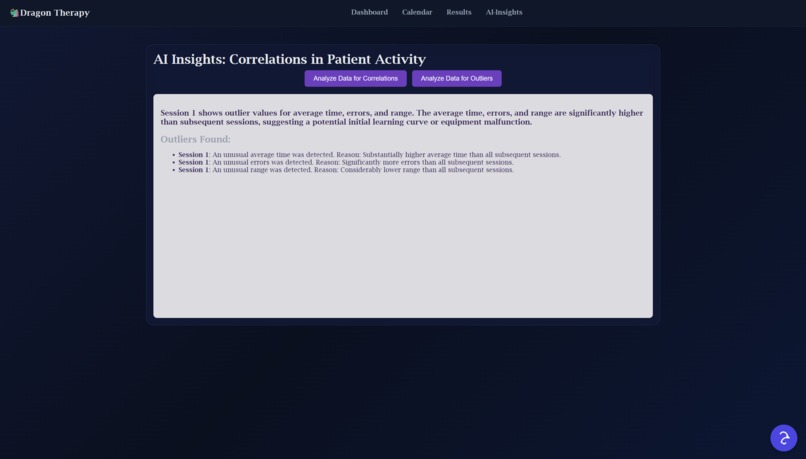
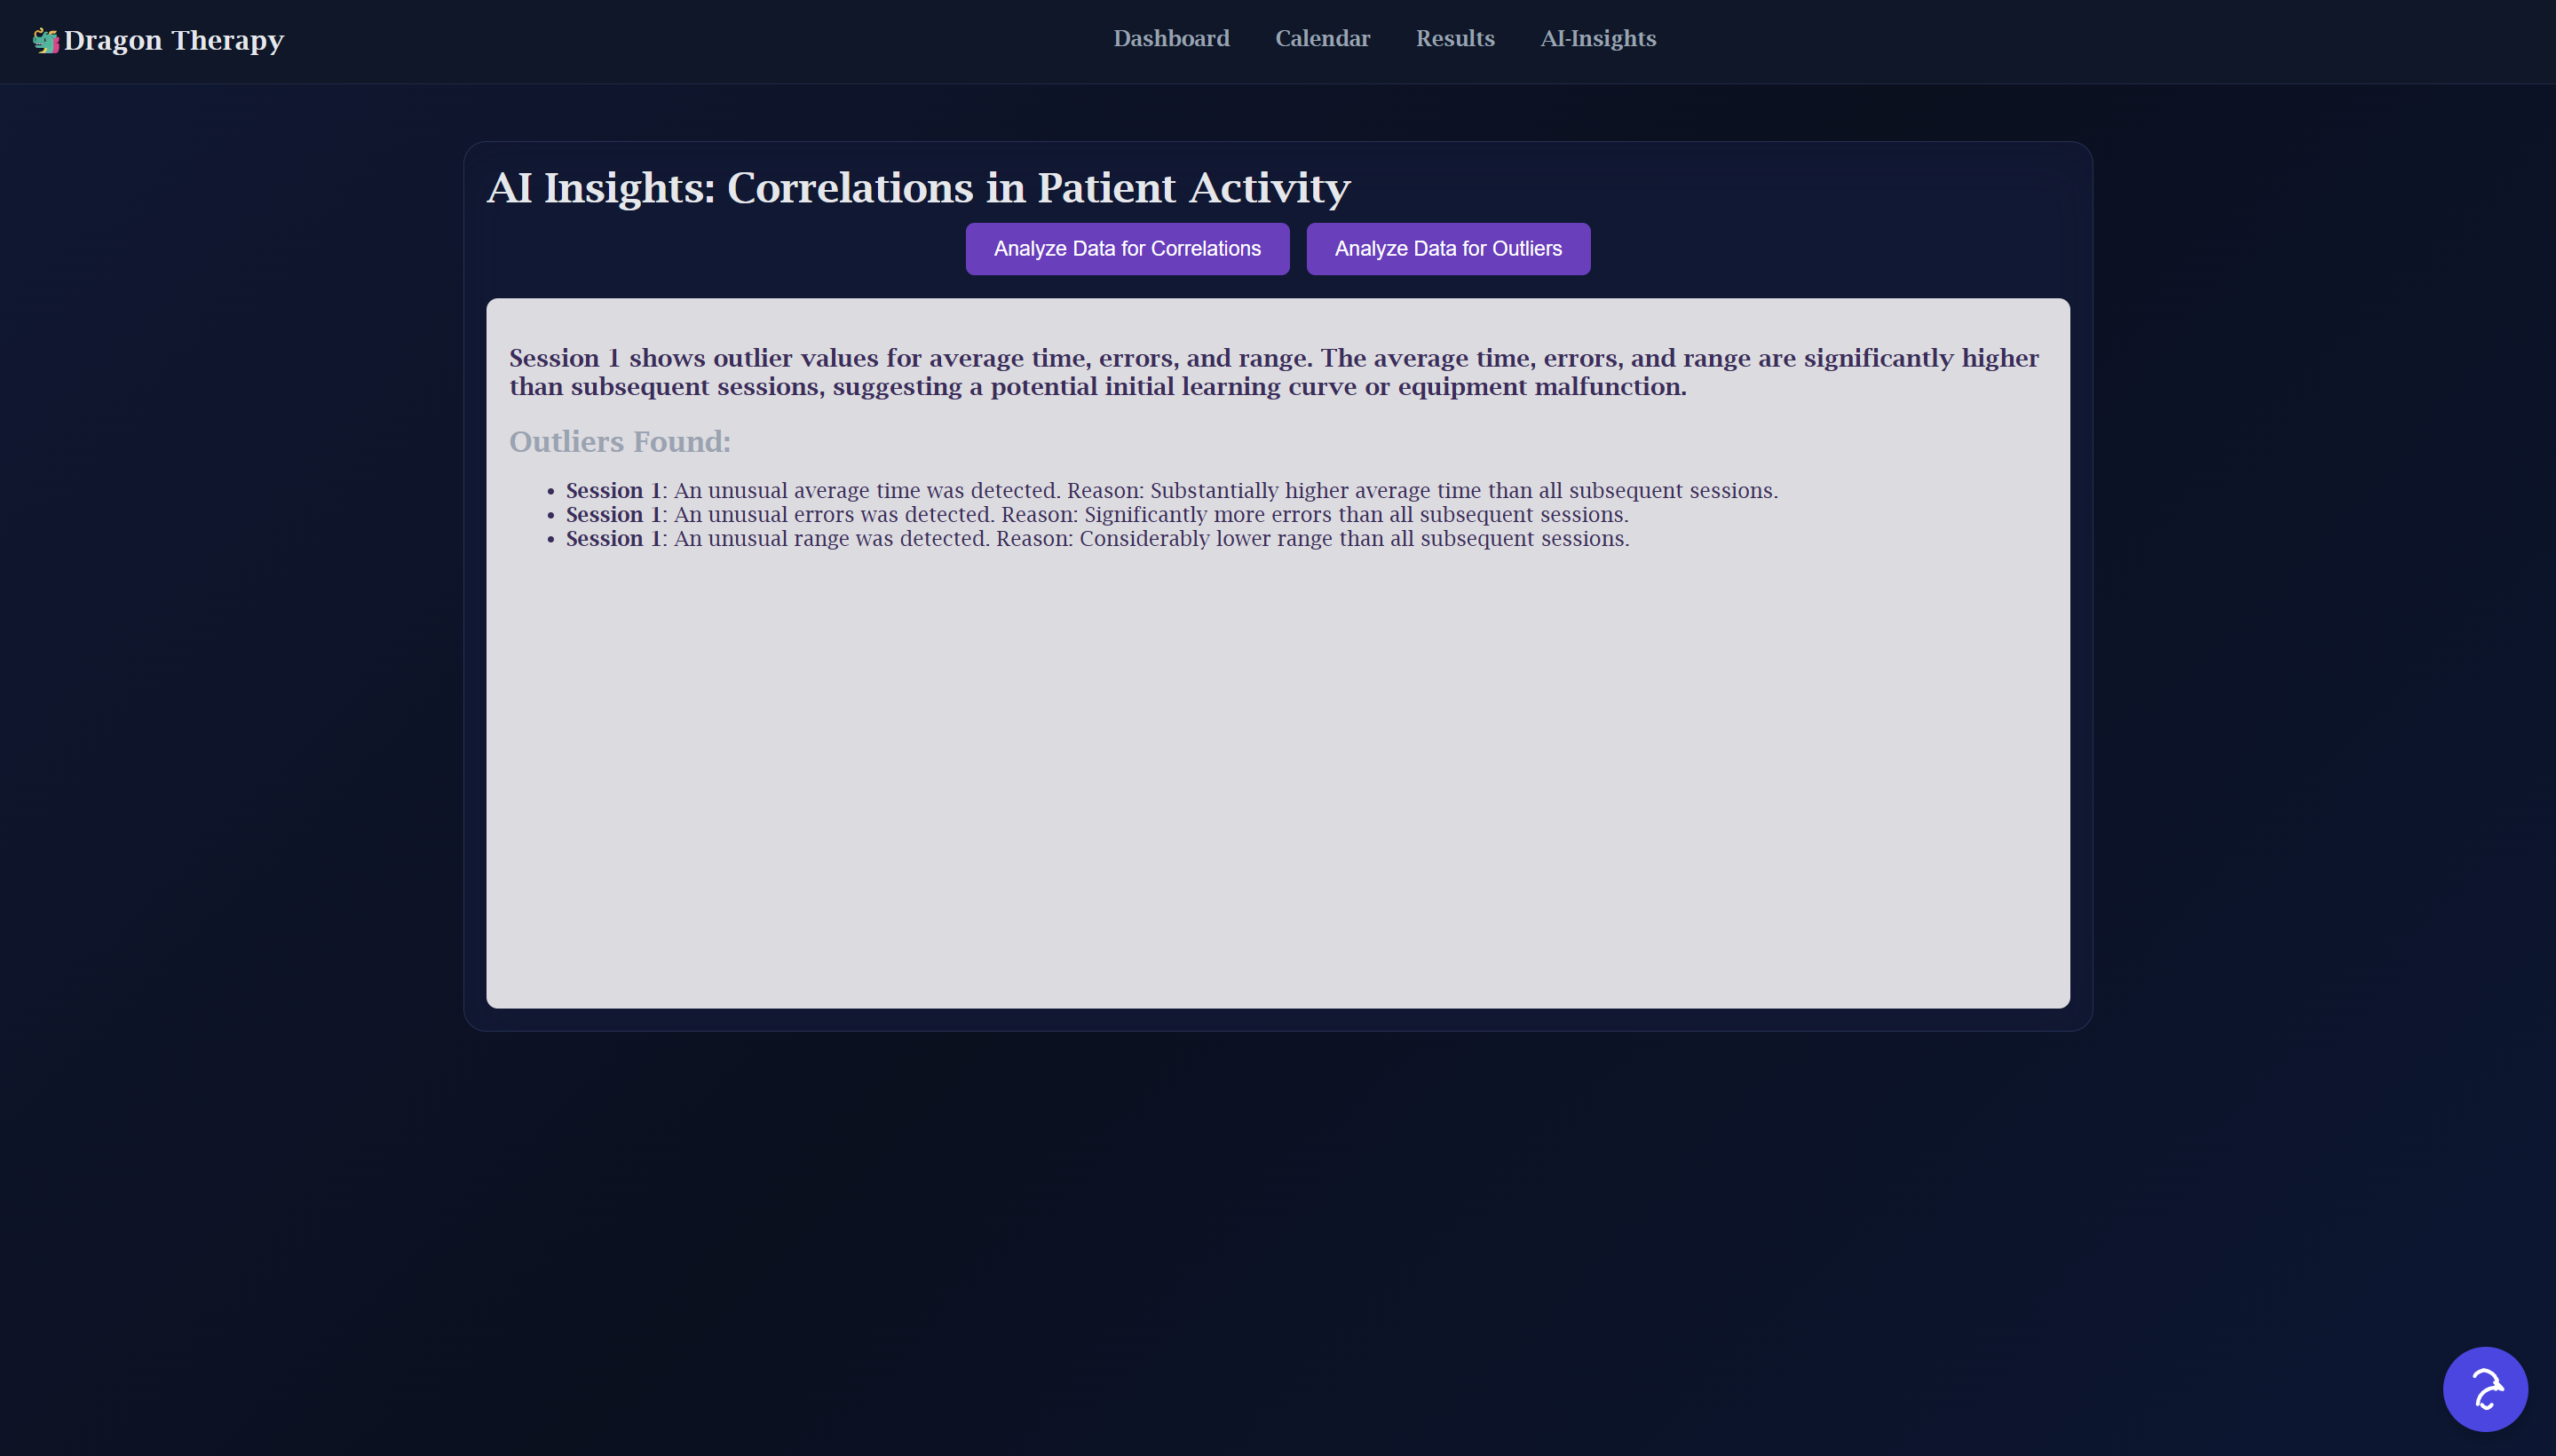
AI Insights: Analyze Data for Outliers
Dragon Therapy: Gamifying Physical Rehabilitation
Inspiration The motivation for Dragon Therapy came from observing the often sterile and repetitive nature of physical therapy exercises. We saw an opportunity at HackRice, with its focus on Healthcare and Social Impact, to create something that could transform a chore into a delightful experience. We were inspired by the idea that a patient, particularly a child recovering from a hand injury, wouldn't have to face tedious exercises but could instead look forward to playing a game—all while generating crucial data for their therapist to track their recovery.
What We Learned This project was a fascinating journey into the world of "serious games." Our biggest takeaway was how easily standard game mechanics can be repurposed into meaningful clinical metrics. We learned that with a thoughtful UI/UX, the line between a game and a therapeutic tool can be beautifully blurred.
We learned to think from the perspective of two different users: the patient, who needs engagement and fun, and the therapist, who needs clear, actionable data.
We practiced rapid prototyping, integrating a data visualization library (Chart.js) to build a functional dashboard in a short amount of time.
Most importantly, we learned that technology can be a powerful force for making healthcare more accessible, engaging, and human-centered.
How We Built It Dragon Therapy is built with a focus on accessibility and simplicity, using core web technologies:
HTML5 Canvas: The entire game interface is rendered on a element, providing a smooth and responsive experience.
Vanilla JavaScript: All game logic, from collision detection to stat tracking, is written in pure JavaScript, ensuring the application is lightweight and fast. There are no external frameworks.
CSS3: We used modern CSS for styling, creating a clean and inviting visual theme.
The core mechanic involves the user dragging "orbs" to a central "dragon" target. We track several key metrics during each session. For instance, the game constantly checks the distance between the orb and the dragon, a calculation based on the Euclidean distance formula:
d = math.sqrt((xorb - xdragon) ** 2 + (yorb - ydragon) **2)
This, along with other data points, feeds into the therapist dashboard. After a session is complete, a summary of the patient's performance is displayed.
JavaScript
function showStats() { // Calculate average speed from collected data points let speedAvg = stats.speed.length > 0 ? (stats.speed.reduce((a,b)=>a+b,0)/stats.speed.length).toFixed(2) : 0;
// Get the total area of movement
let range = stats.rangeOfMotion.size;

// Count the number of misses
let acc = stats.accuracy;

// Display the stats simply for the user
statsDiv.innerHTML = `
    <strong>Session Complete!</strong><br>
    Average Speed: <b>${speedAvg}s</b><br>
    Errors: <b>${acc}</b><br>
    Range of Motion Score: <b>${range}</b>
`;
} Challenges We Ran Into The main challenge was the classic hackathon time crunch. With less than 48 hours, we had to be incredibly focused. A specific hurdle was designing the data model. We had to decide which in-game actions were therapeutically relevant. Was a "miss" simply a mistake, or was it a data point indicating a lack of fine motor control? Translating game events into a clinical context required careful thought. Balancing the need for a fun game with the requirements of a serious medical tool was a constant design challenge we had to navigate.


Log in or sign up for Devpost to join the conversation.