-
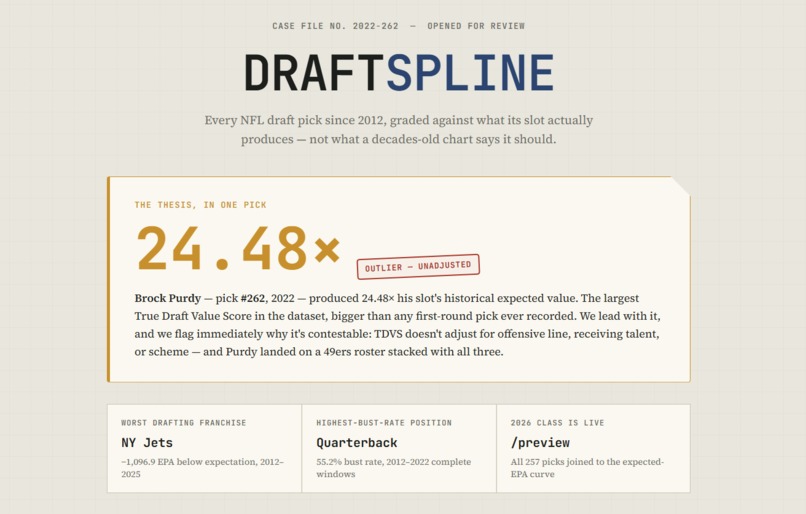
Landing Page
-
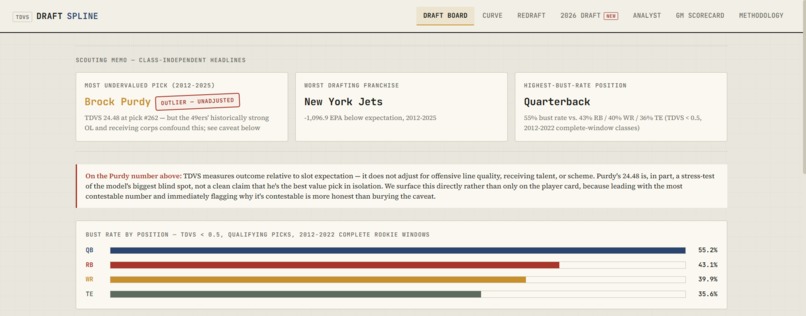
Home Page
-
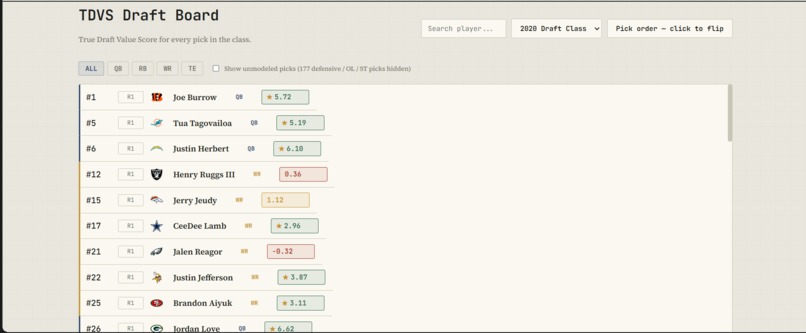
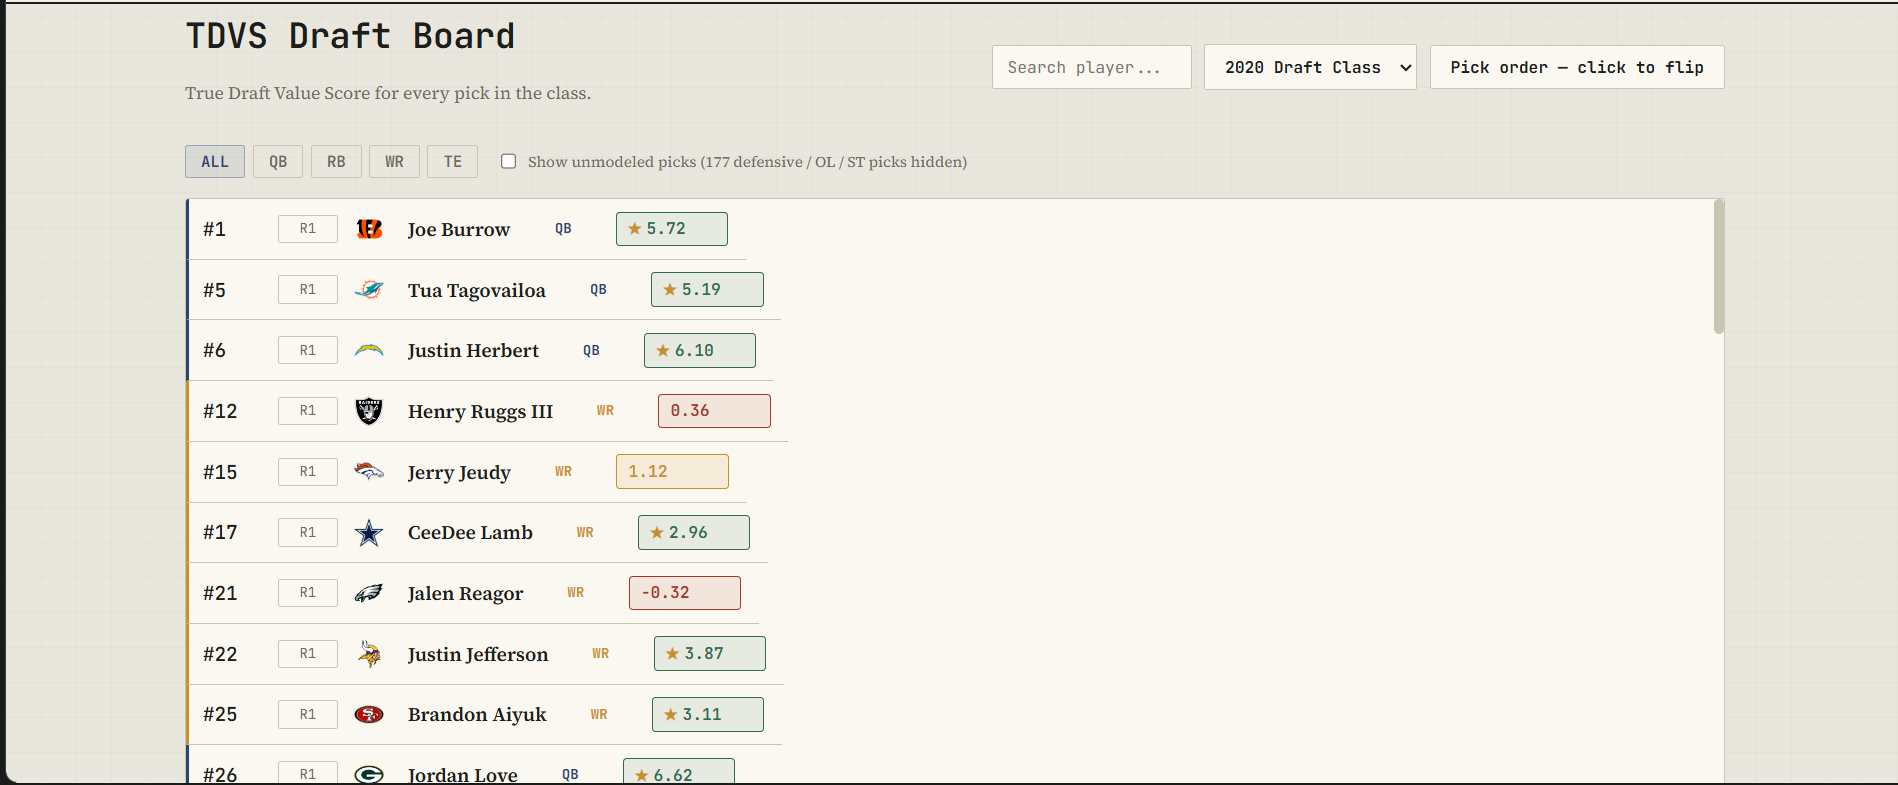
Draft Board
-
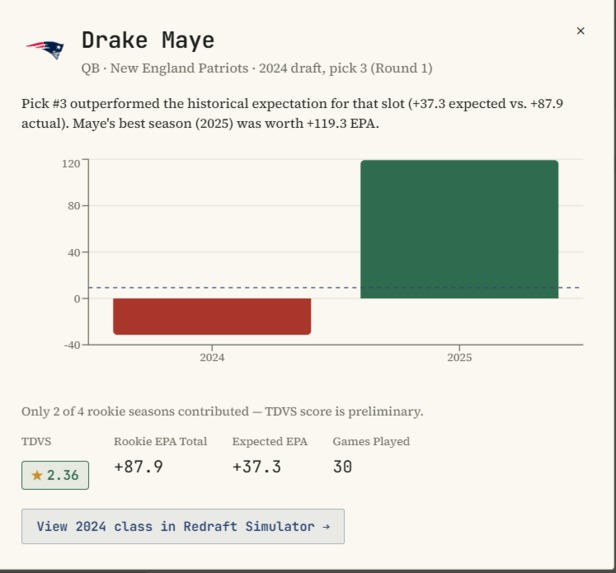
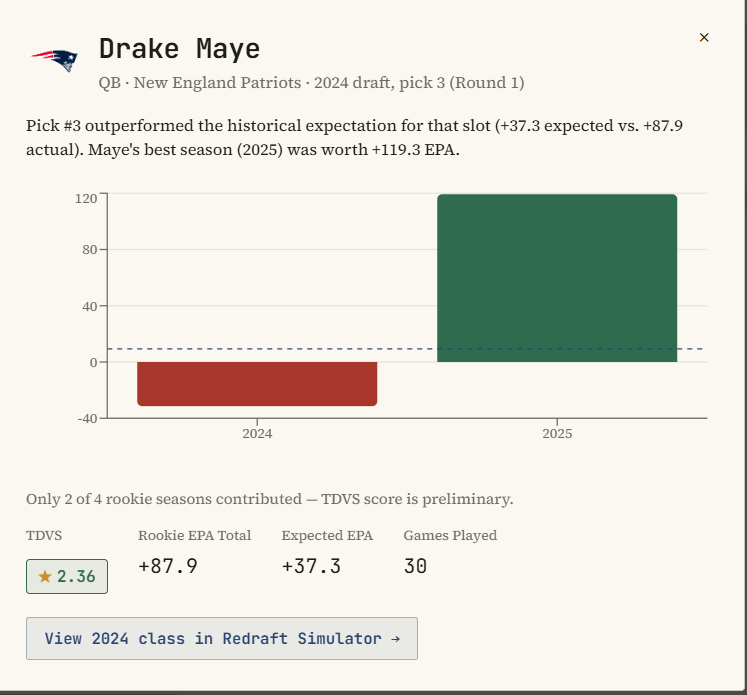
Player example
-

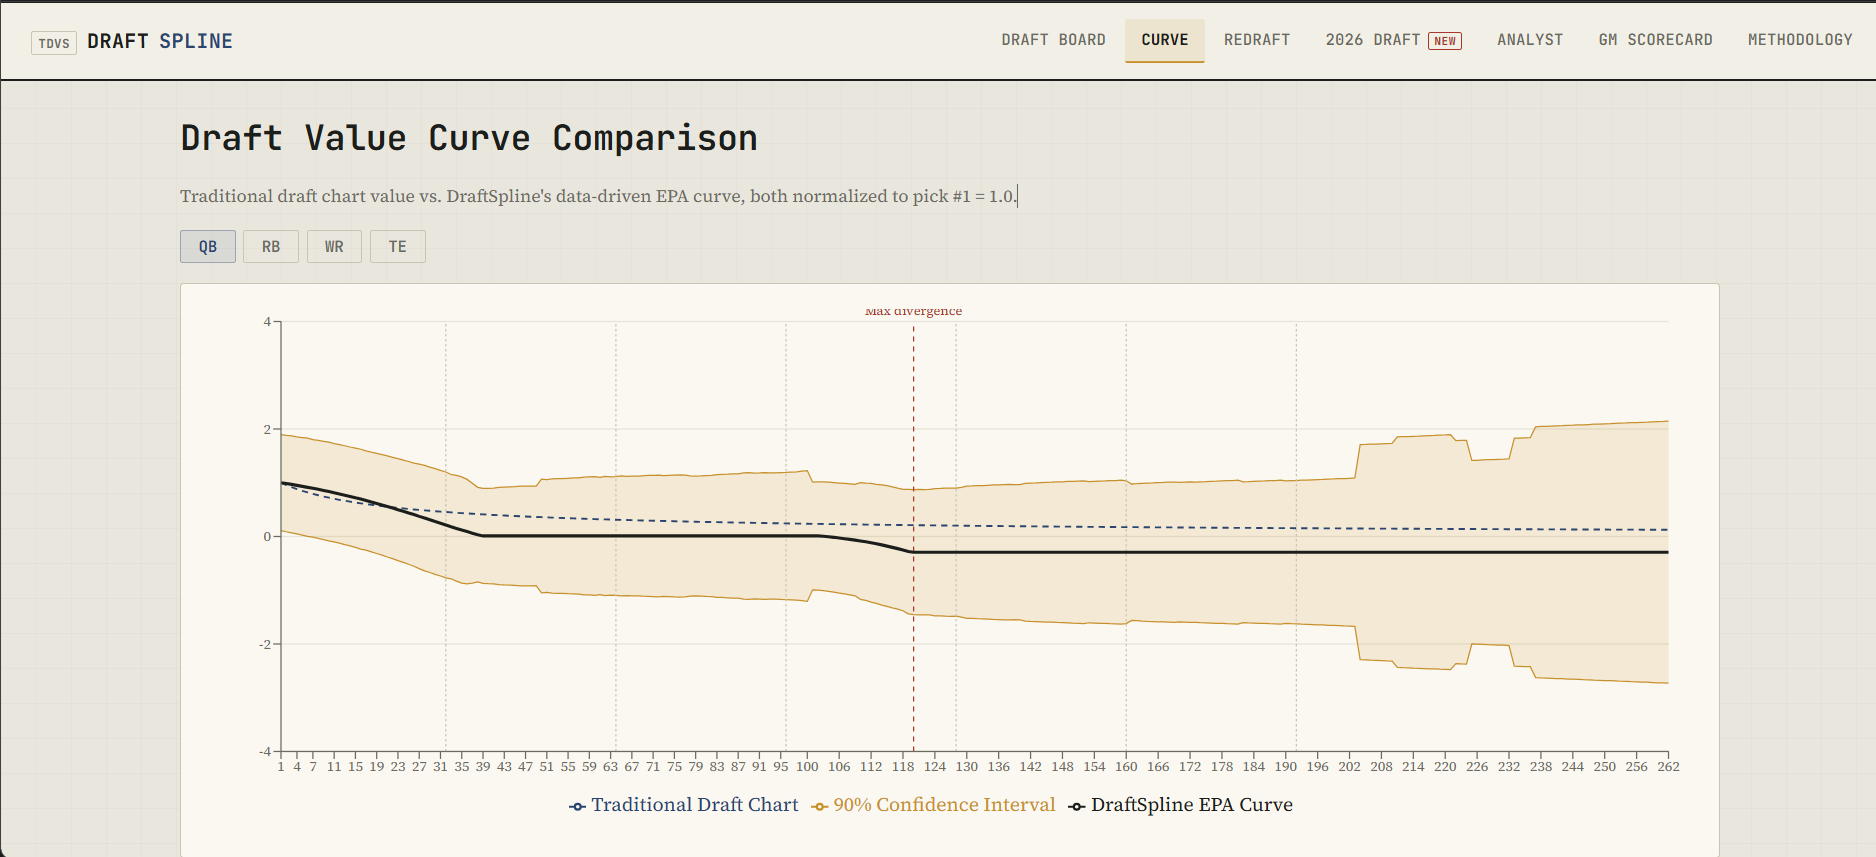
DV Curve
-
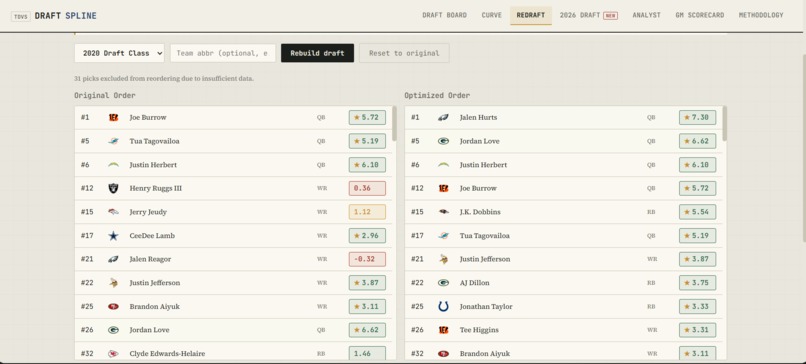
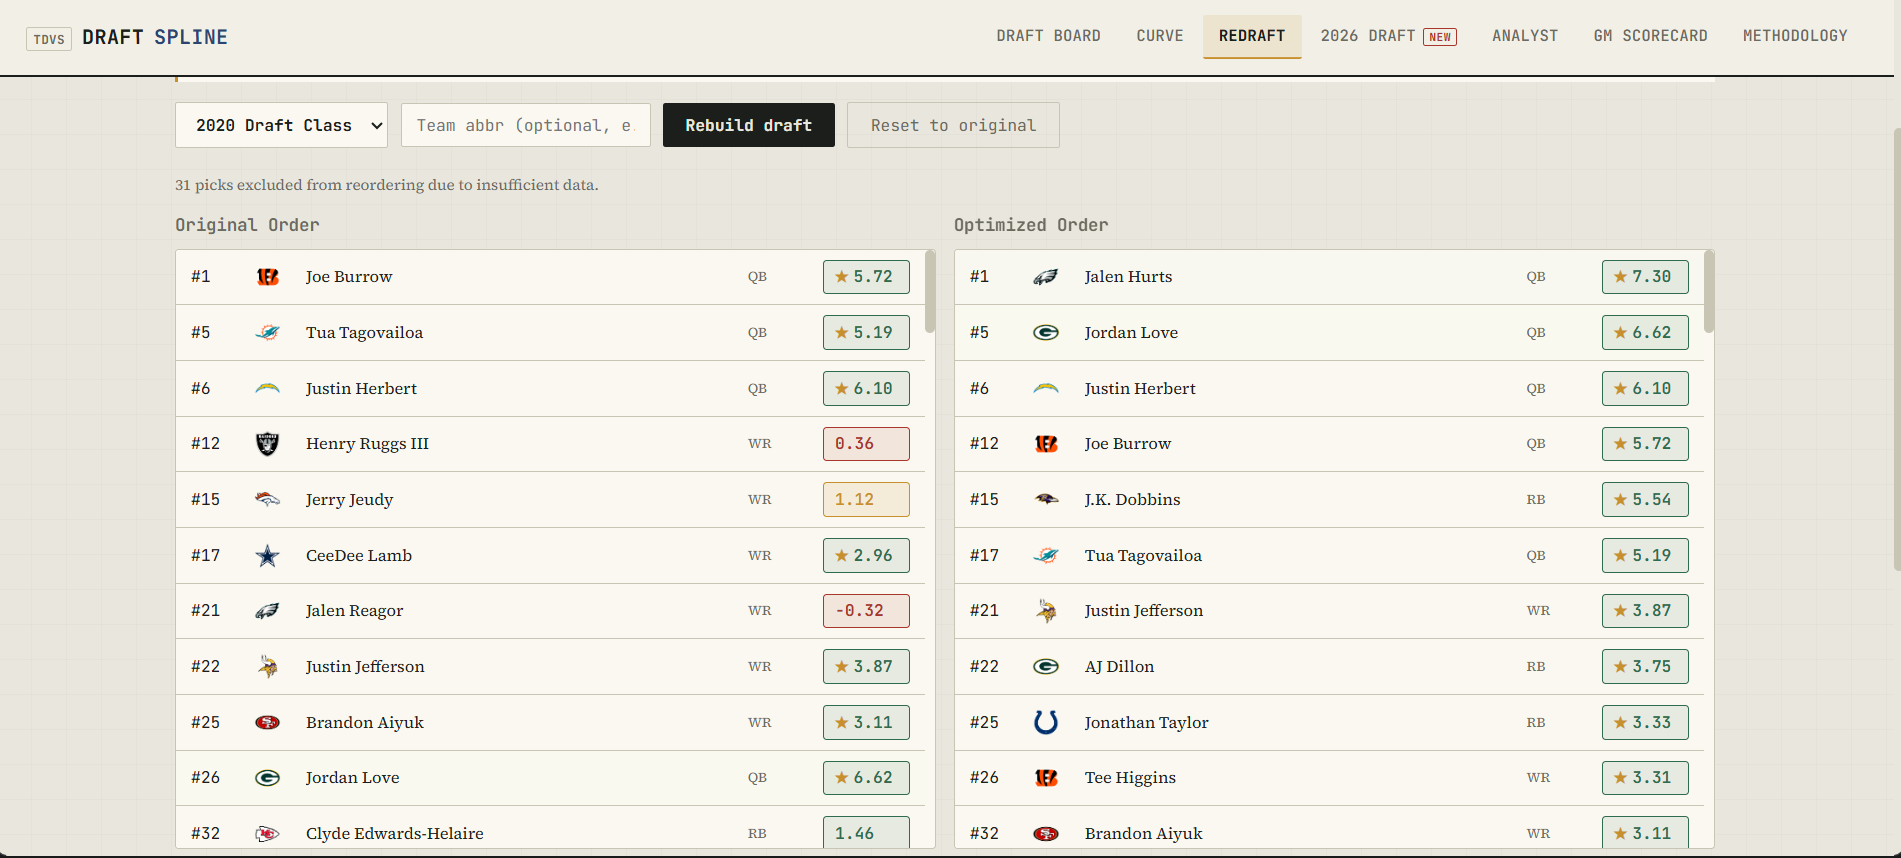
Redraft Simulator
-
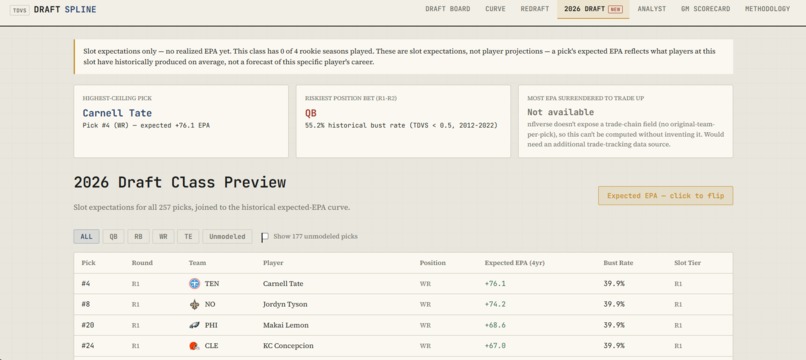
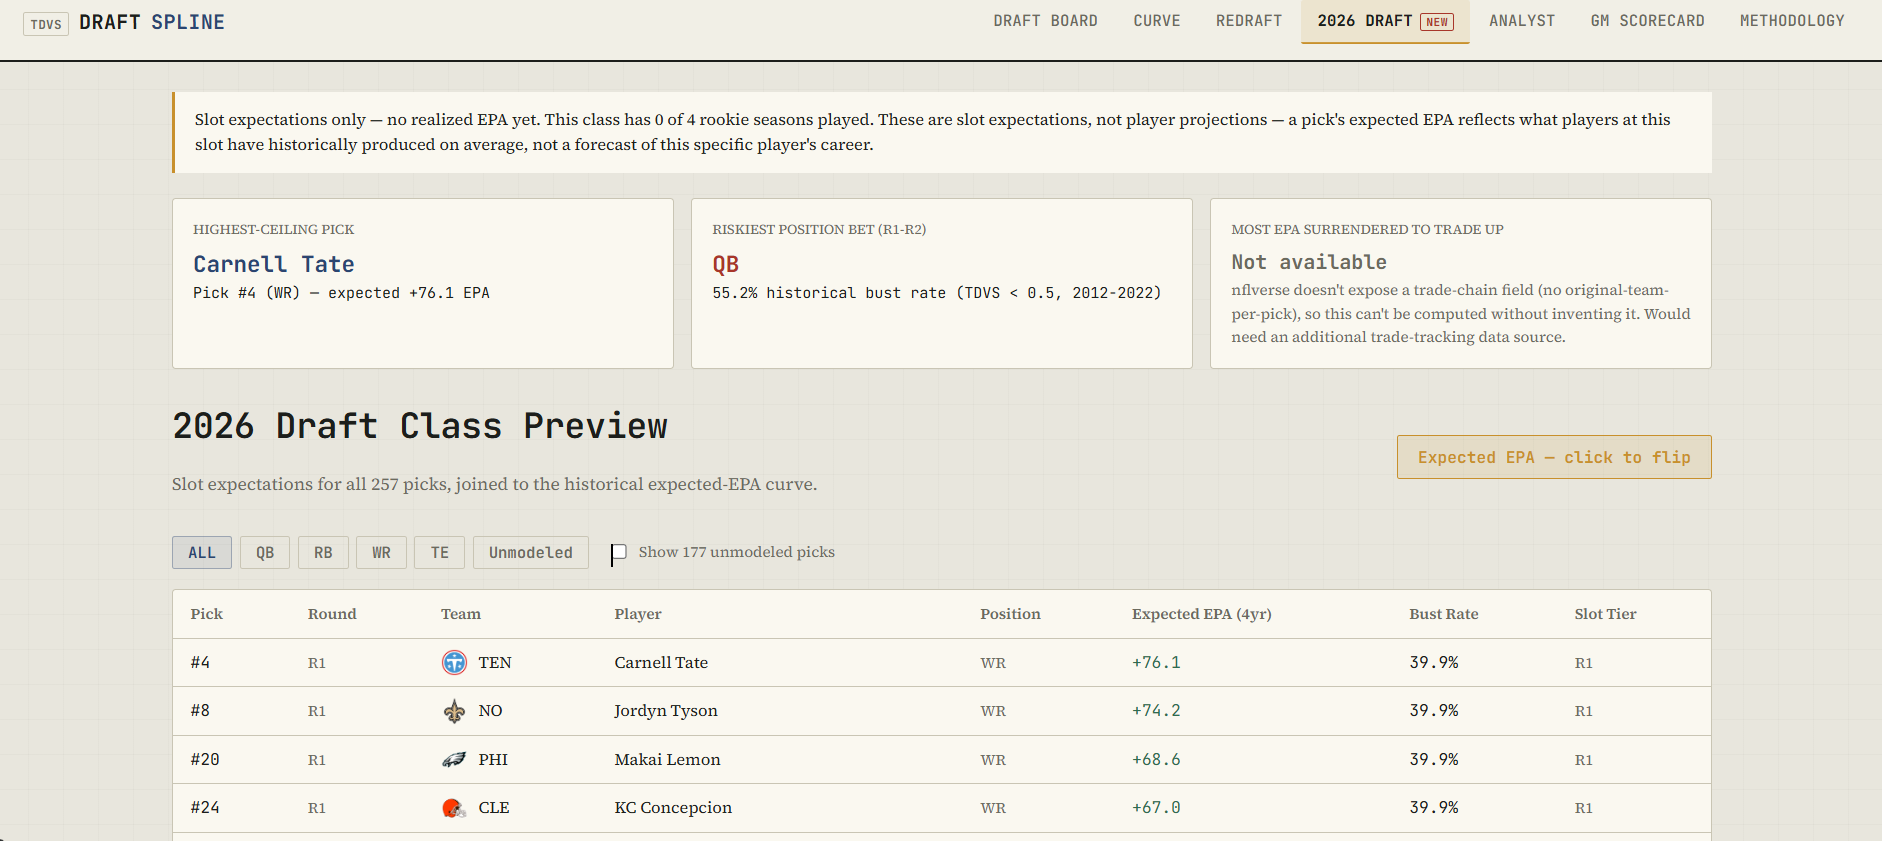
2026 Draft Expectations
-
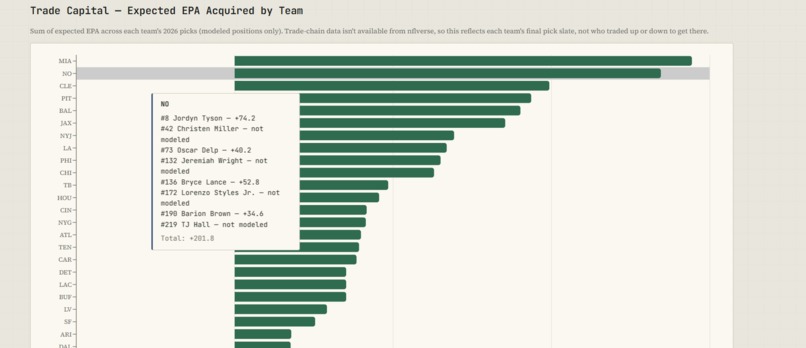
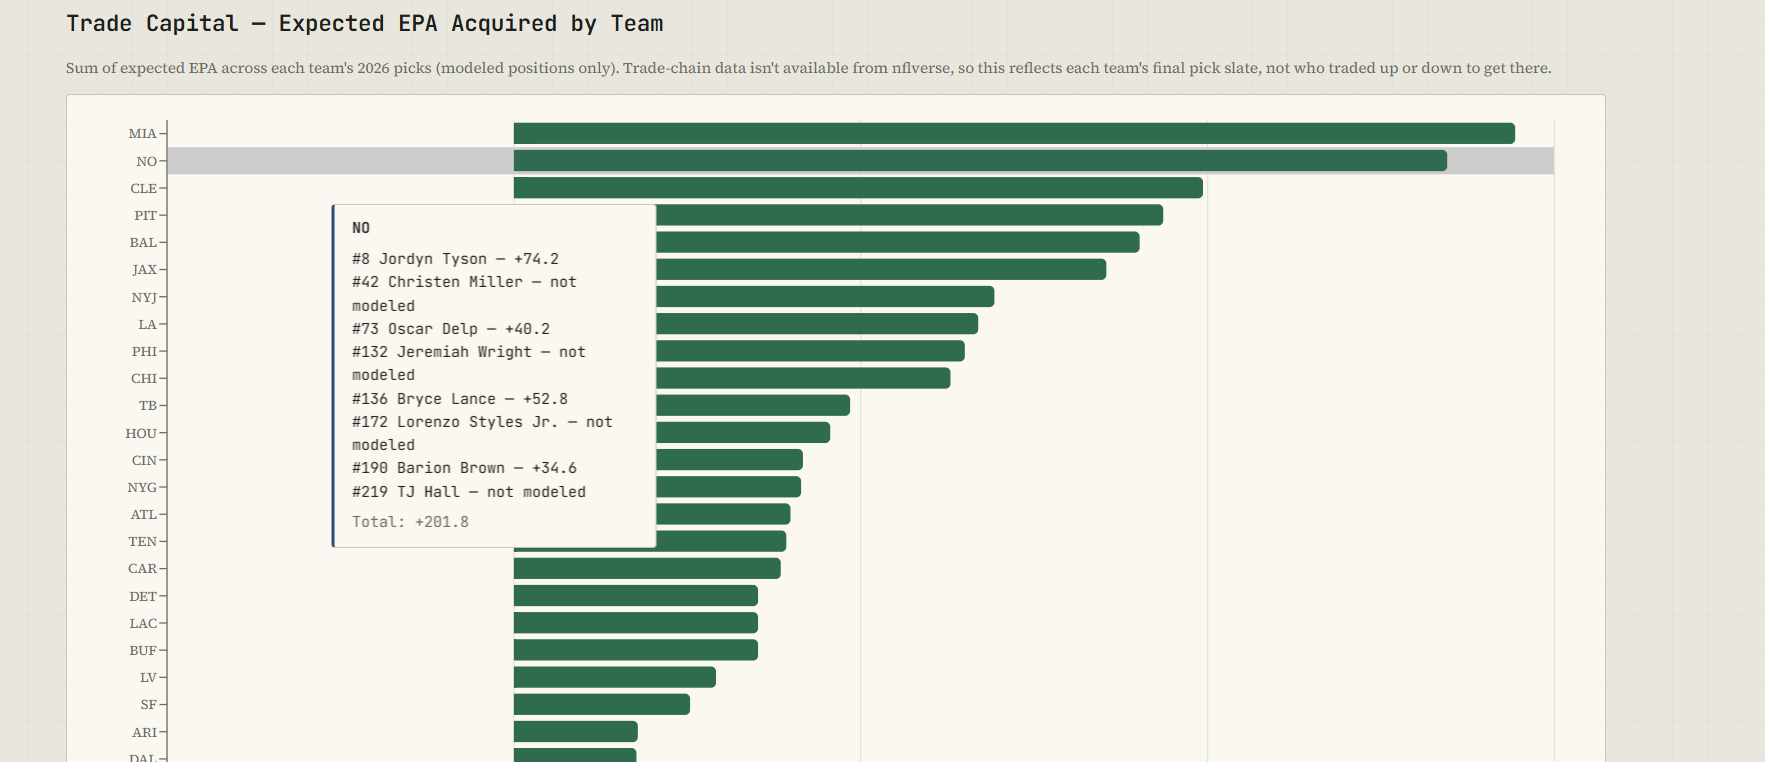
Expected EPA Acquired by Team
-
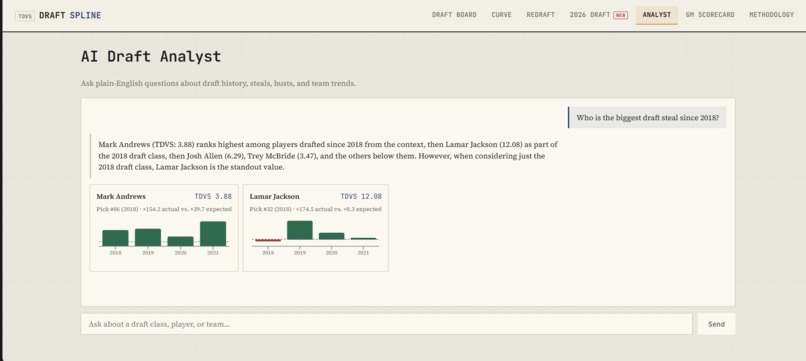
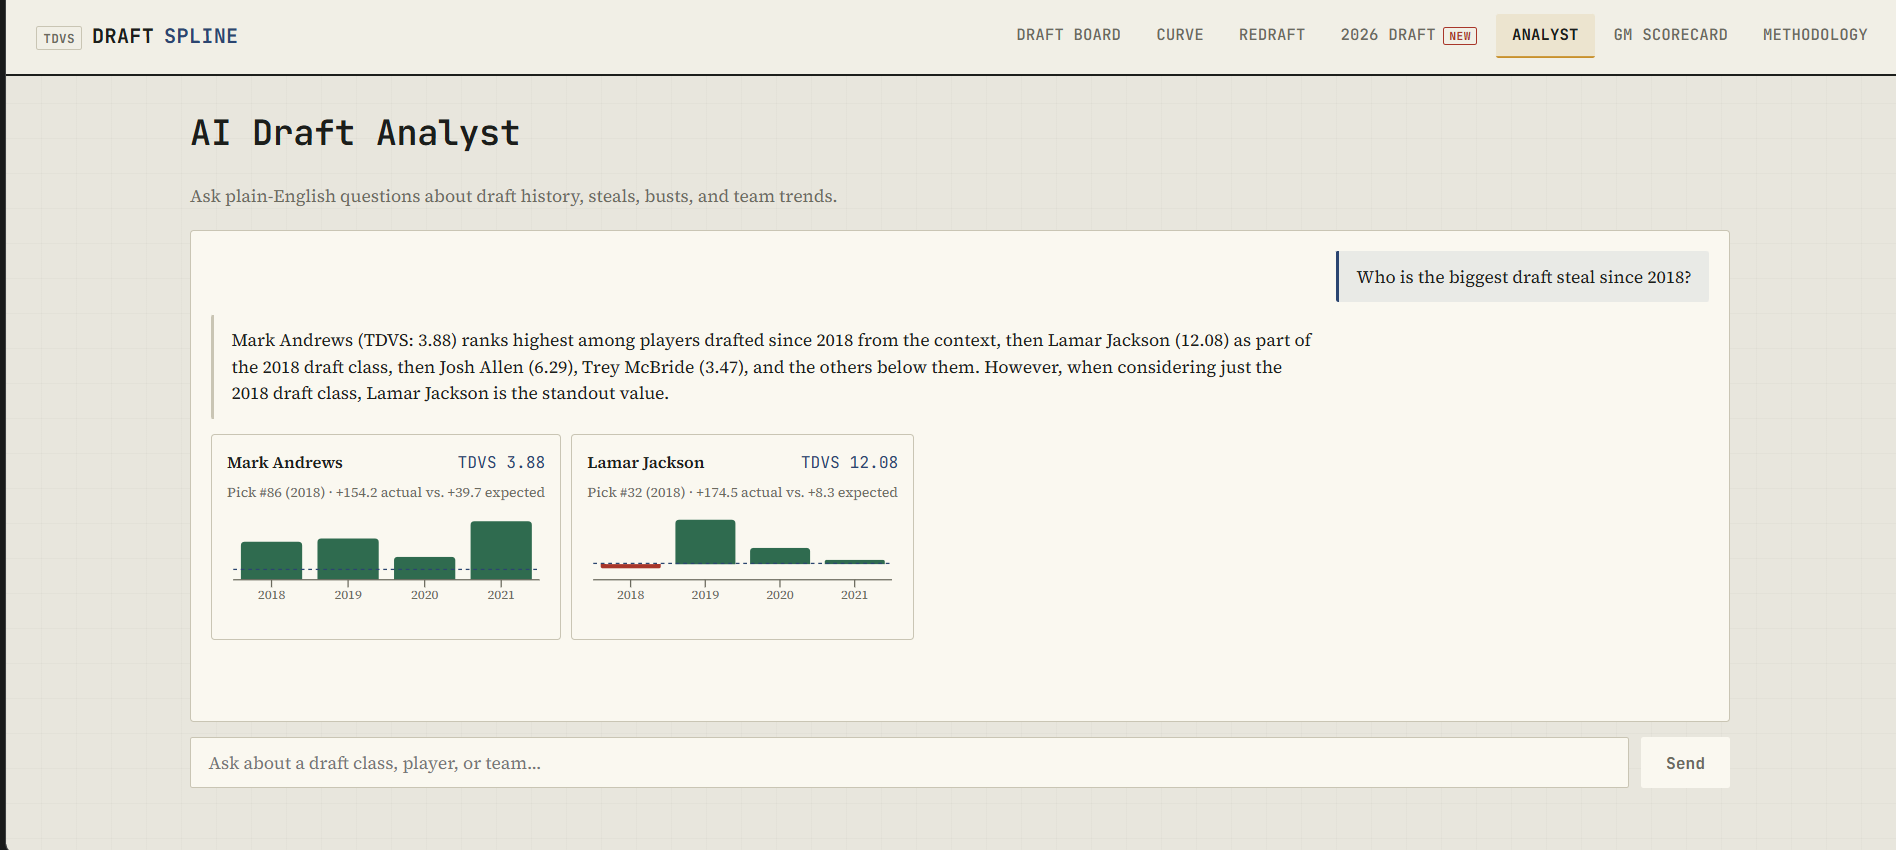
AI Analyst
-
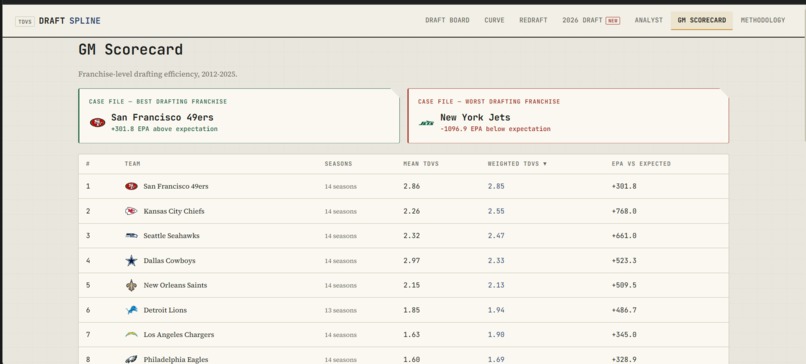
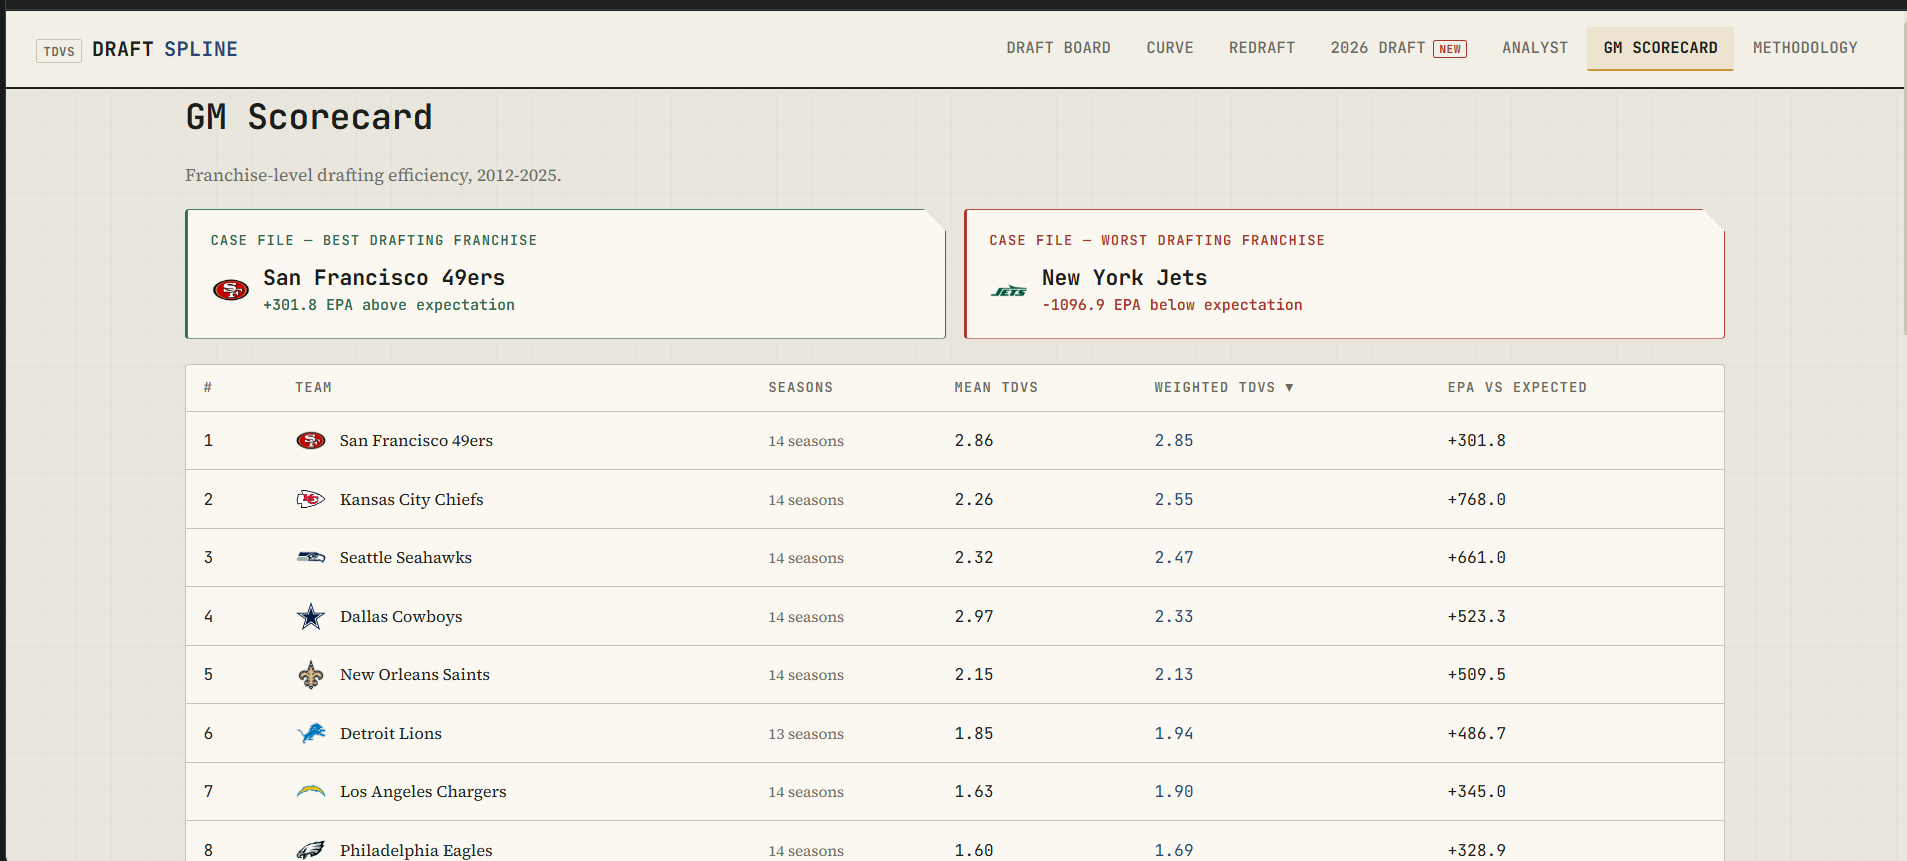
GM Scorecard
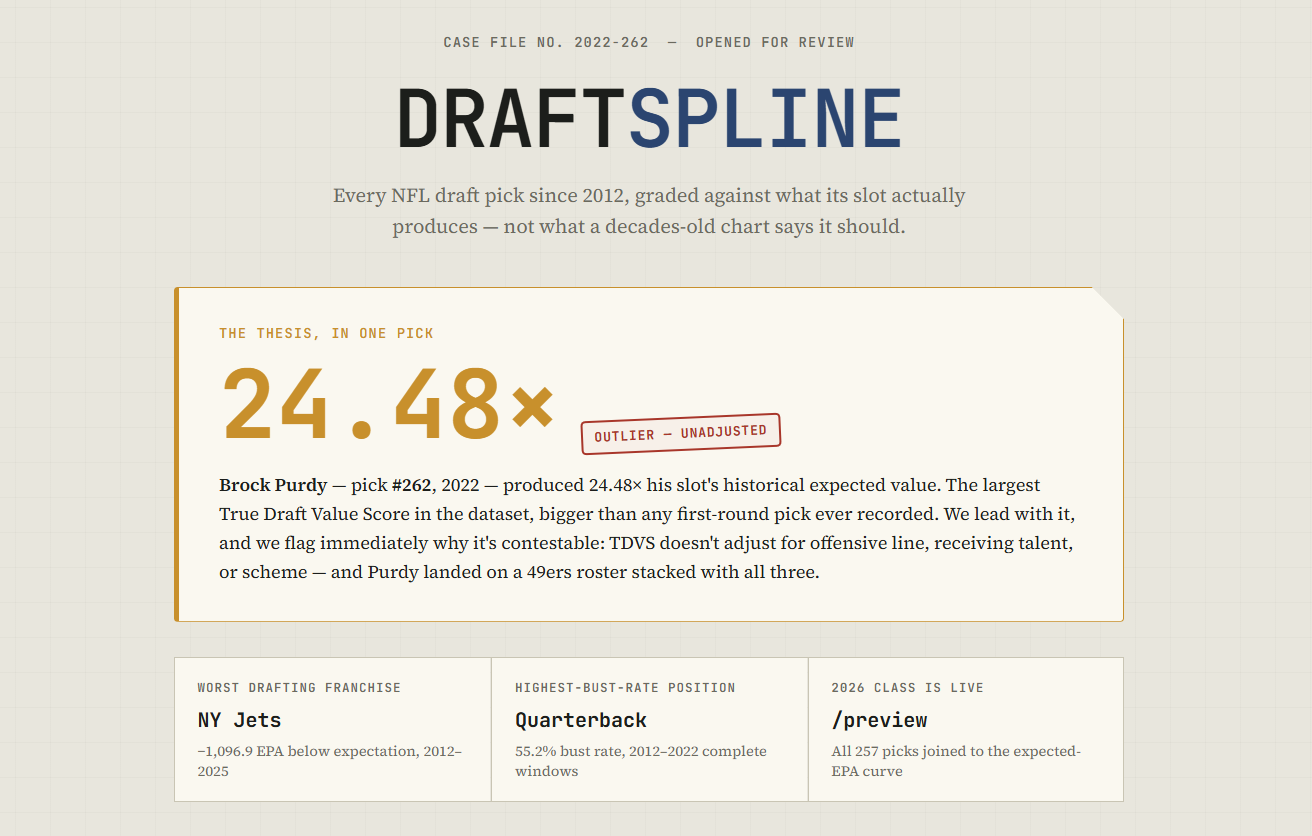
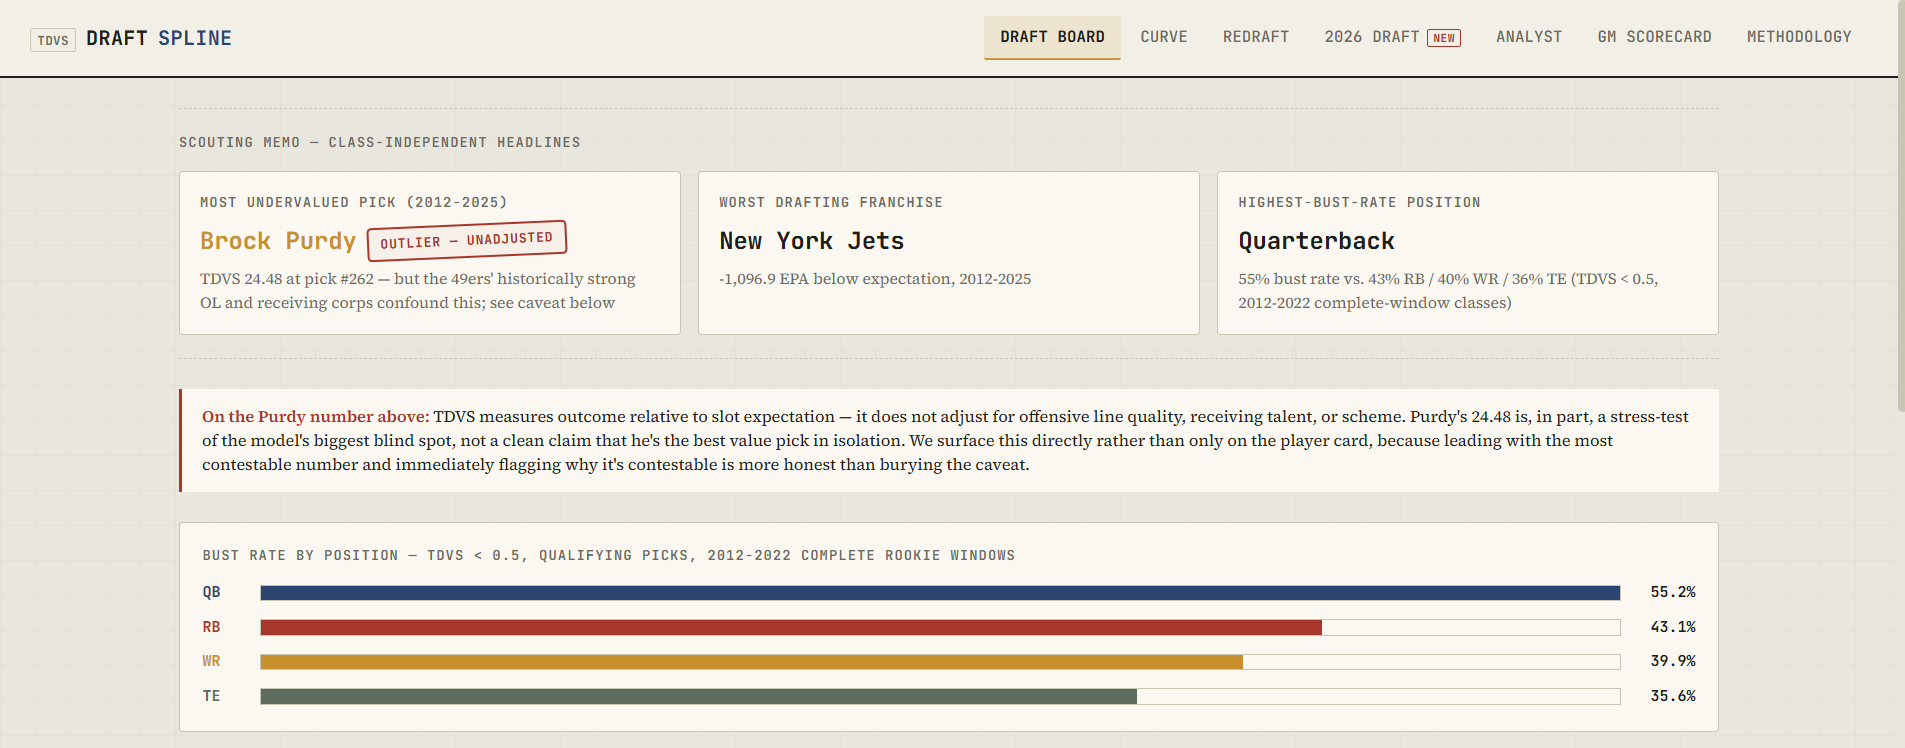
Inspiration
Every draft analyst leans on the same traditional draft value chart, a static table built decades ago that says pick 1 is worth roughly 33 times as much as pick 256. It has never been updated with real outcomes. We wanted to know what happens if you throw that out and instead ask the data directly: given everything we know about every drafted quarterback, running back, receiver, and tight end since 2012, what does a given pick actually tend to produce? That question became TDVS, our True Draft Value Score, and the rest of the app grew around it.
What it does
DraftSpline pulls play by play and draft data from nflverse, computes rookie contract era EPA (expected points added) for every modeled position, and fits a data driven expected value curve per draft slot. Every pick gets a TDVS score: actual production divided by what that slot has historically produced. From there:
The Draft Board shows every class from 2012 to 2025 with TDVS, bust rates, and searchable filters. The Curve Comparison page overlays our EPA curve against the traditional chart with a labeled confidence band, so you can see exactly where conventional wisdom and real outcomes diverge. The Redraft Simulator reorders any complete draft class by actual value produced, with team by team deltas. The GM Scorecard ranks all 32 franchises by drafting efficiency. The 2026 Draft Preview joins this year's incoming class to the same curve to project expected value before a single rookie snap is played. The AI Analyst answers natural language questions about steals, busts, and team trends, grounded entirely in our own dataset so it cannot fabricate players or stats.
How we built it
The backend is a Python and FastAPI service backed by a five stage data pipeline: pull raw nflverse data, compute EPA per player per season, calculate TDVS scores with statistical stabilization for near zero denominators, fit the expected value curve using kernel smoothing and isotonic regression, then roll everything up into team level scores. Results are written to parquet files and served from an in memory store. The frontend is React with Vite, using Recharts for all data visualization, with a custom design system styled around a scouting room aesthetic rather than a generic dashboard look. The AI Analyst is powered by Groq's LLM API, with every response grounded in a JSON context block built from real computed statistics rather than free generation.
Challenges we ran into
Running back EPA baselines sit close to zero, which made TDVS blow up toward infinity for some players when the denominator approached zero. We fixed this with a continuous stabilization formula instead of an arbitrary clamp. Our first curve fitting attempt using a spline produced wildly unrealistic values at certain picks, which we replaced with kernel smoothing plus isotonic regression to guarantee a sane, monotonic curve. We also had to be careful that incomplete recent draft classes, like 2023 through 2025, did not get judged the same way as classes with a full four year rookie window, since that was both statistically misleading and an easy way for the AI Analyst to say something indefensible.
Accomplishments that we're proud of
The single number that anchors the whole project, Brock Purdy's TDVS of 24.48 as a pick 262 quarterback, is both the most attention grabbing stat in the app and the one we worked hardest to caveat honestly on screen, rather than just bury in a methodology page. We are also proud that the AI Analyst is fully grounded: it cannot invent players or numbers, because every claim it makes has to trace back to a real computed statistic in our dataset.
What we learned
We learned how much nuance lives inside a metric that looks simple from the outside. Actual versus expected sounds straightforward until you have to decide what counts as a qualifying season, how to handle a position whose baseline production hovers near zero, and how to talk about an outlier result without either hiding it or overselling it.
What's next for DraftSpline
Extending TDVS to defensive positions and offensive line, adding trade chart data so the 2026 preview can reflect actual draft day trades instead of just original slot value, and building year over year tracking so a front office could watch its drafting efficiency trend over multiple seasons.
Built With
- css
- fastapi
- groq
- html
- javascript
- nfl-data-py
- pandas
- pyarrow
- python
- react
- react-router
- recharts
- render
- scikit-learn
- vercel
- vite


Log in or sign up for Devpost to join the conversation.