Inspiration
NBA Draft analysis is full of opinions: mock drafts, scouting reports, team needs, interviews, workouts, medical information and statistics.
With DraftLens, I wanted to isolate one of those signals and ask a simpler question:
What does the pre-draft statistical record say on its own?
The goal was not to build another mock draft or replace scouting. I wanted DraftLens to work as an independent second opinion: a tool that can confirm a scouting view, challenge consensus, or surface a prospect worth investigating further.
I also wanted to go beyond a machine-learning notebook and build something that feels like a real analytics product. A user should be able to rank prospects, understand why a player stands out, evaluate team fit, explore statistical comparables and even bring their own draft class into the system.
What it does
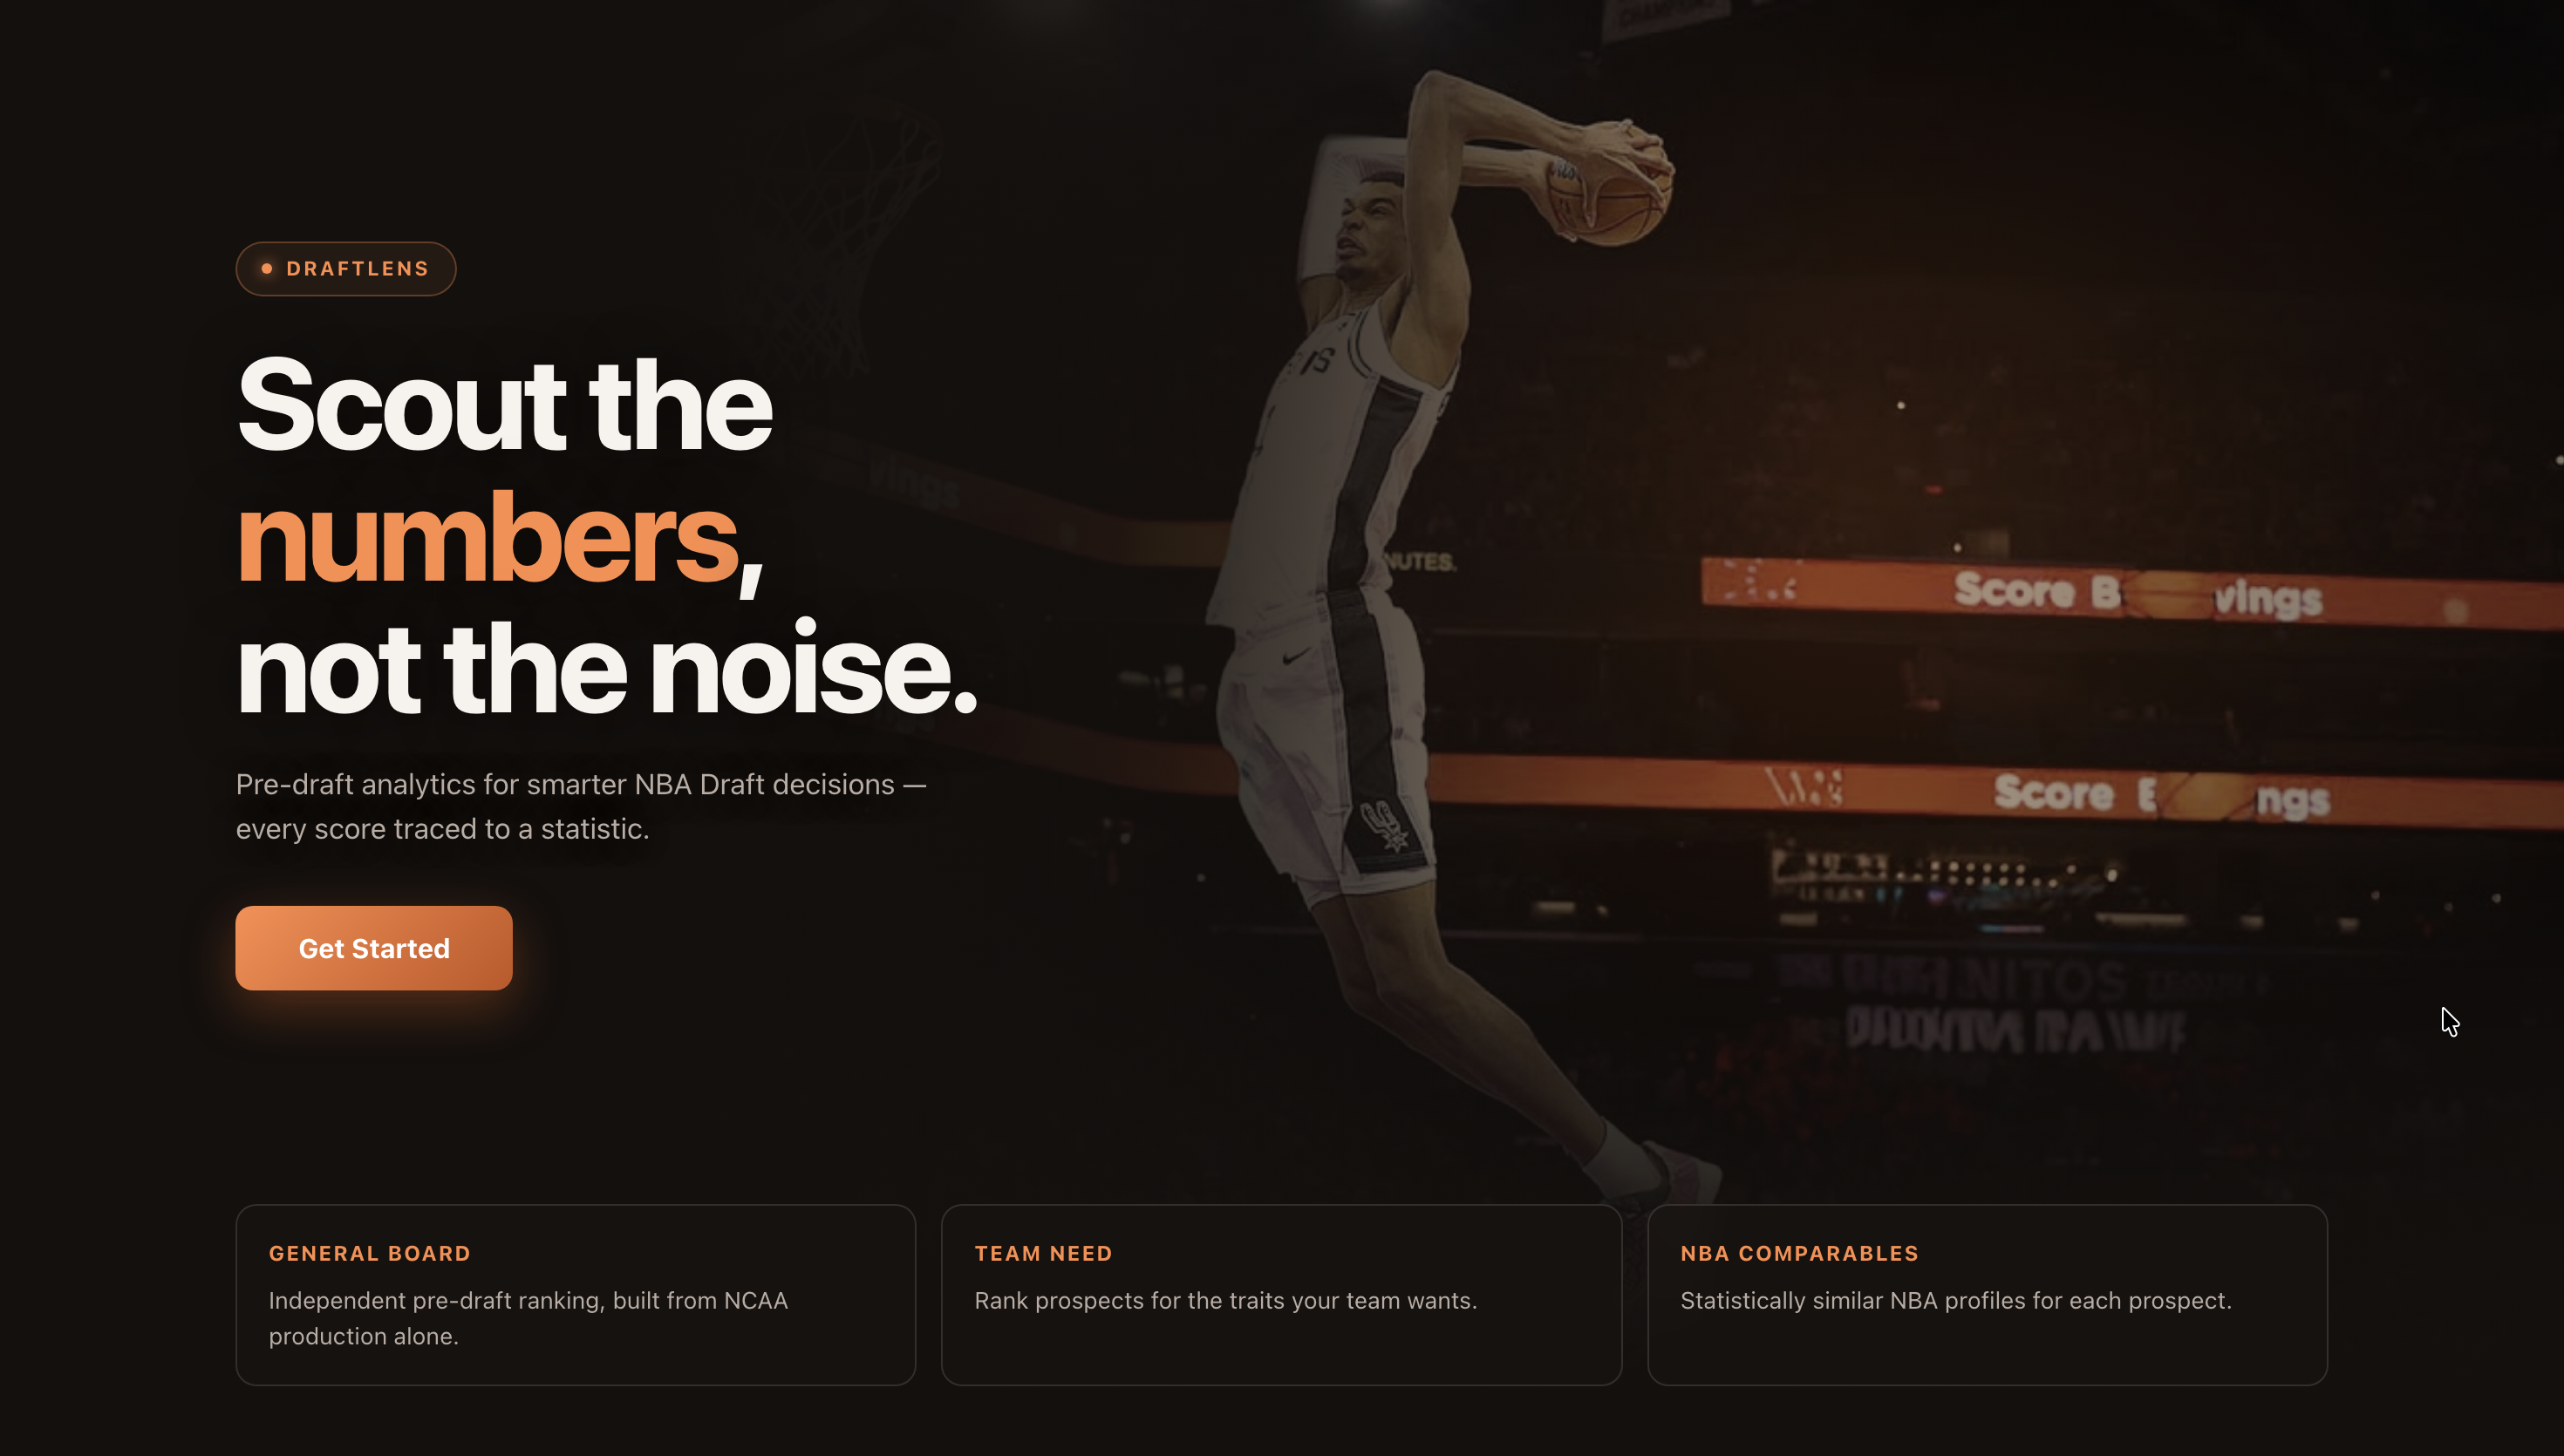
DraftLens is an explainable pre-draft analytics tool for NCAA prospects.
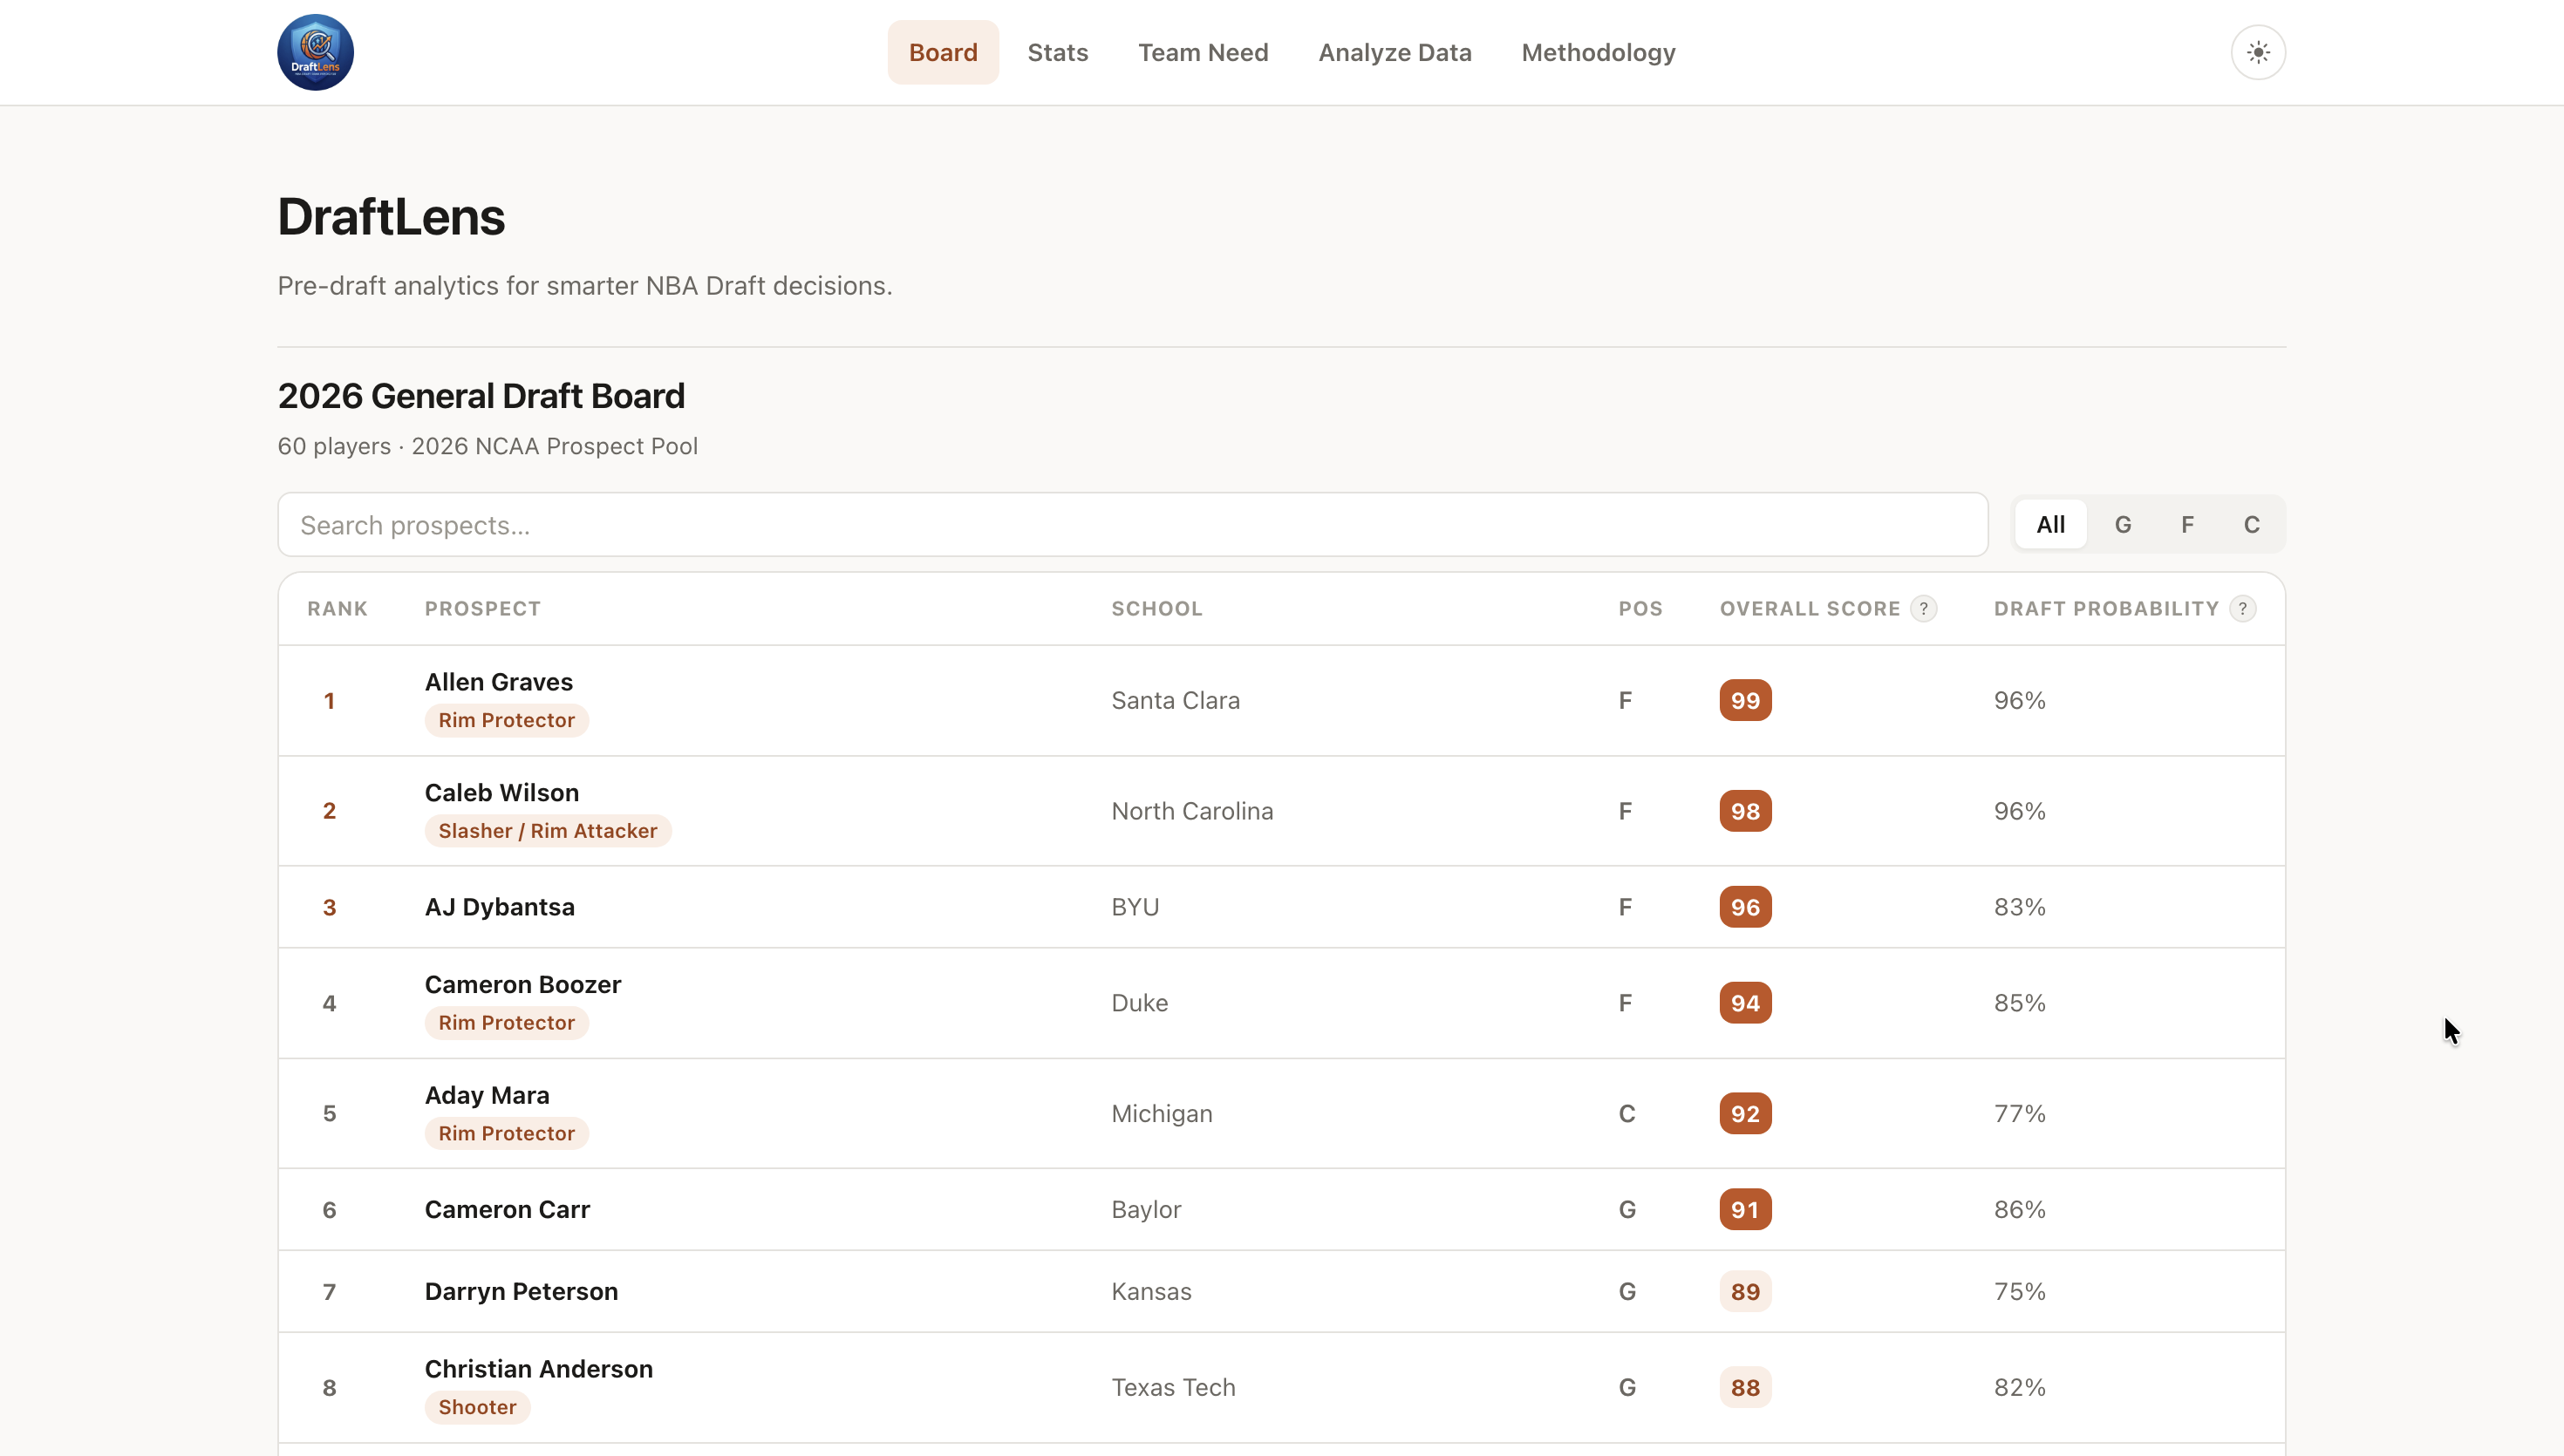
Its main feature is the General Board, which combines two statistical signals:
- Draft Probability, estimating how likely a declared NCAA early entrant is to be drafted;
- Draft Order signal, estimating how early the statistical profile of a drafted prospect tends to resemble being selected.
These signals are combined into a General Board signal and converted into a class-relative Overall Score from 0 to 100.
Overall Score is not a probability and DraftLens does not claim to predict the exact NBA Draft order.
Beyond the ranking, DraftLens includes:
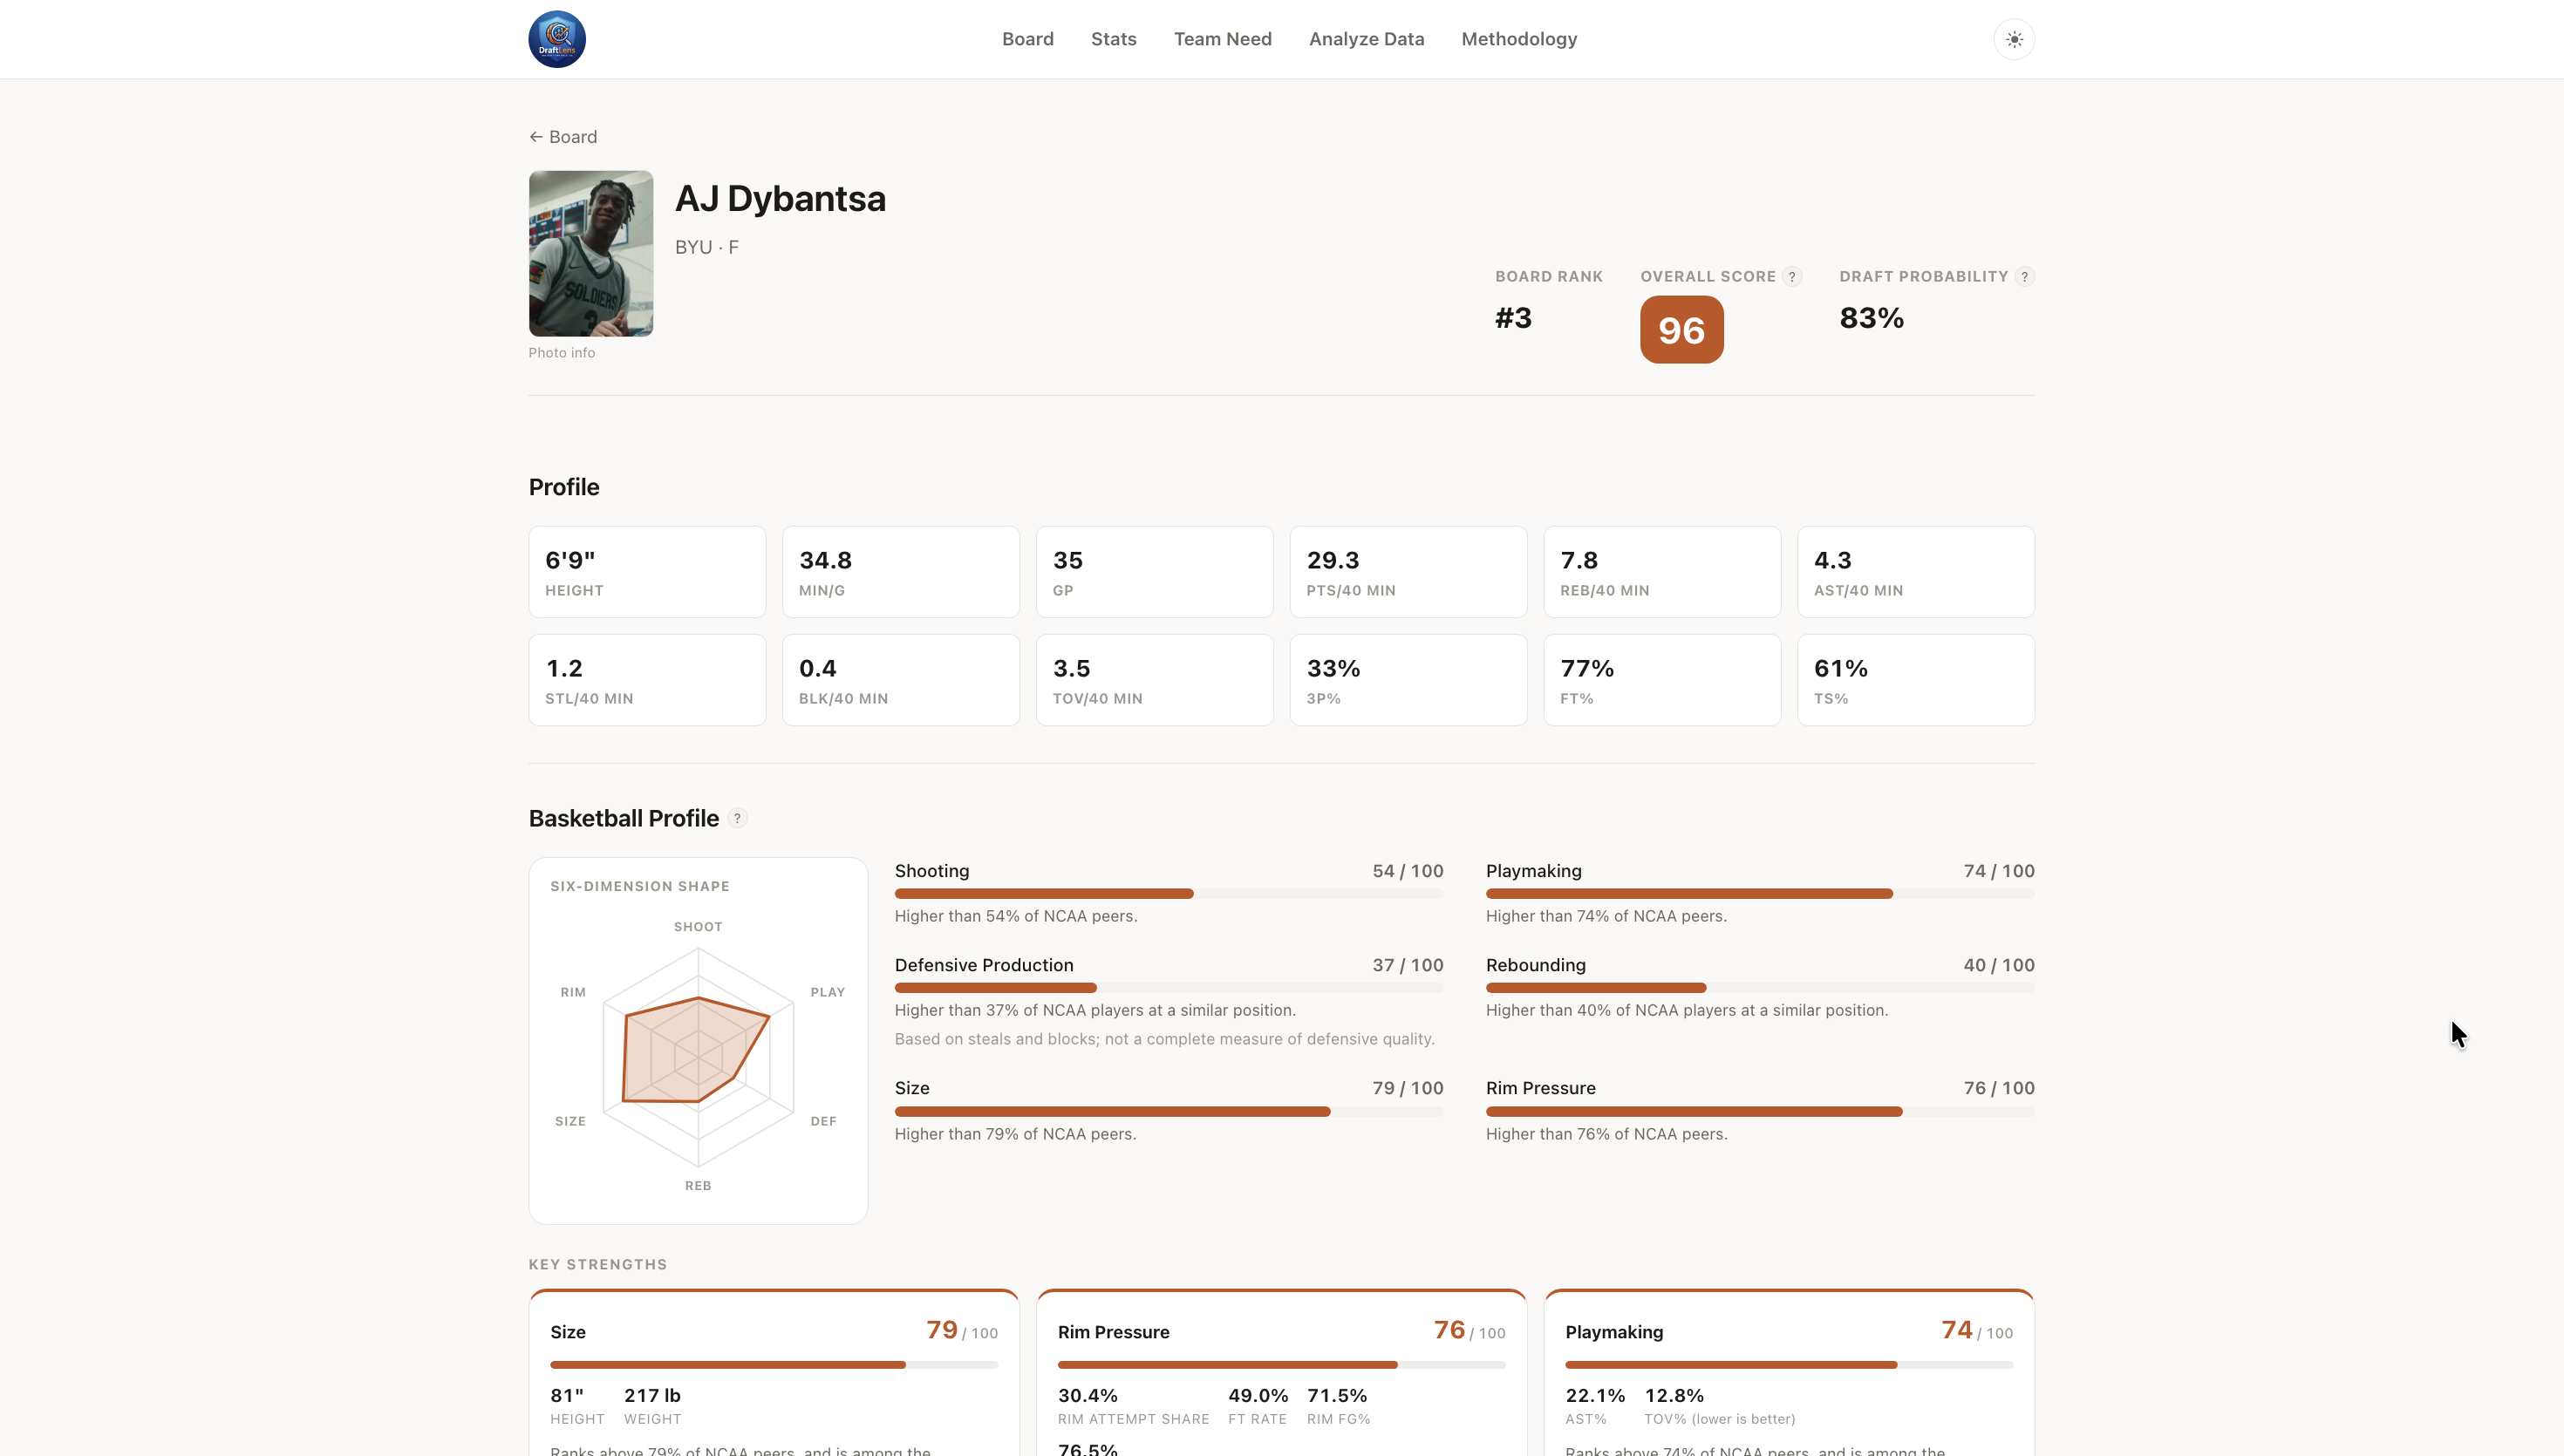
- Prospect Profiles with NCAA production, efficiency and Basketball Profile scores;
- Key Strengths and Areas to Watch, backed by the statistics behind each dimension;
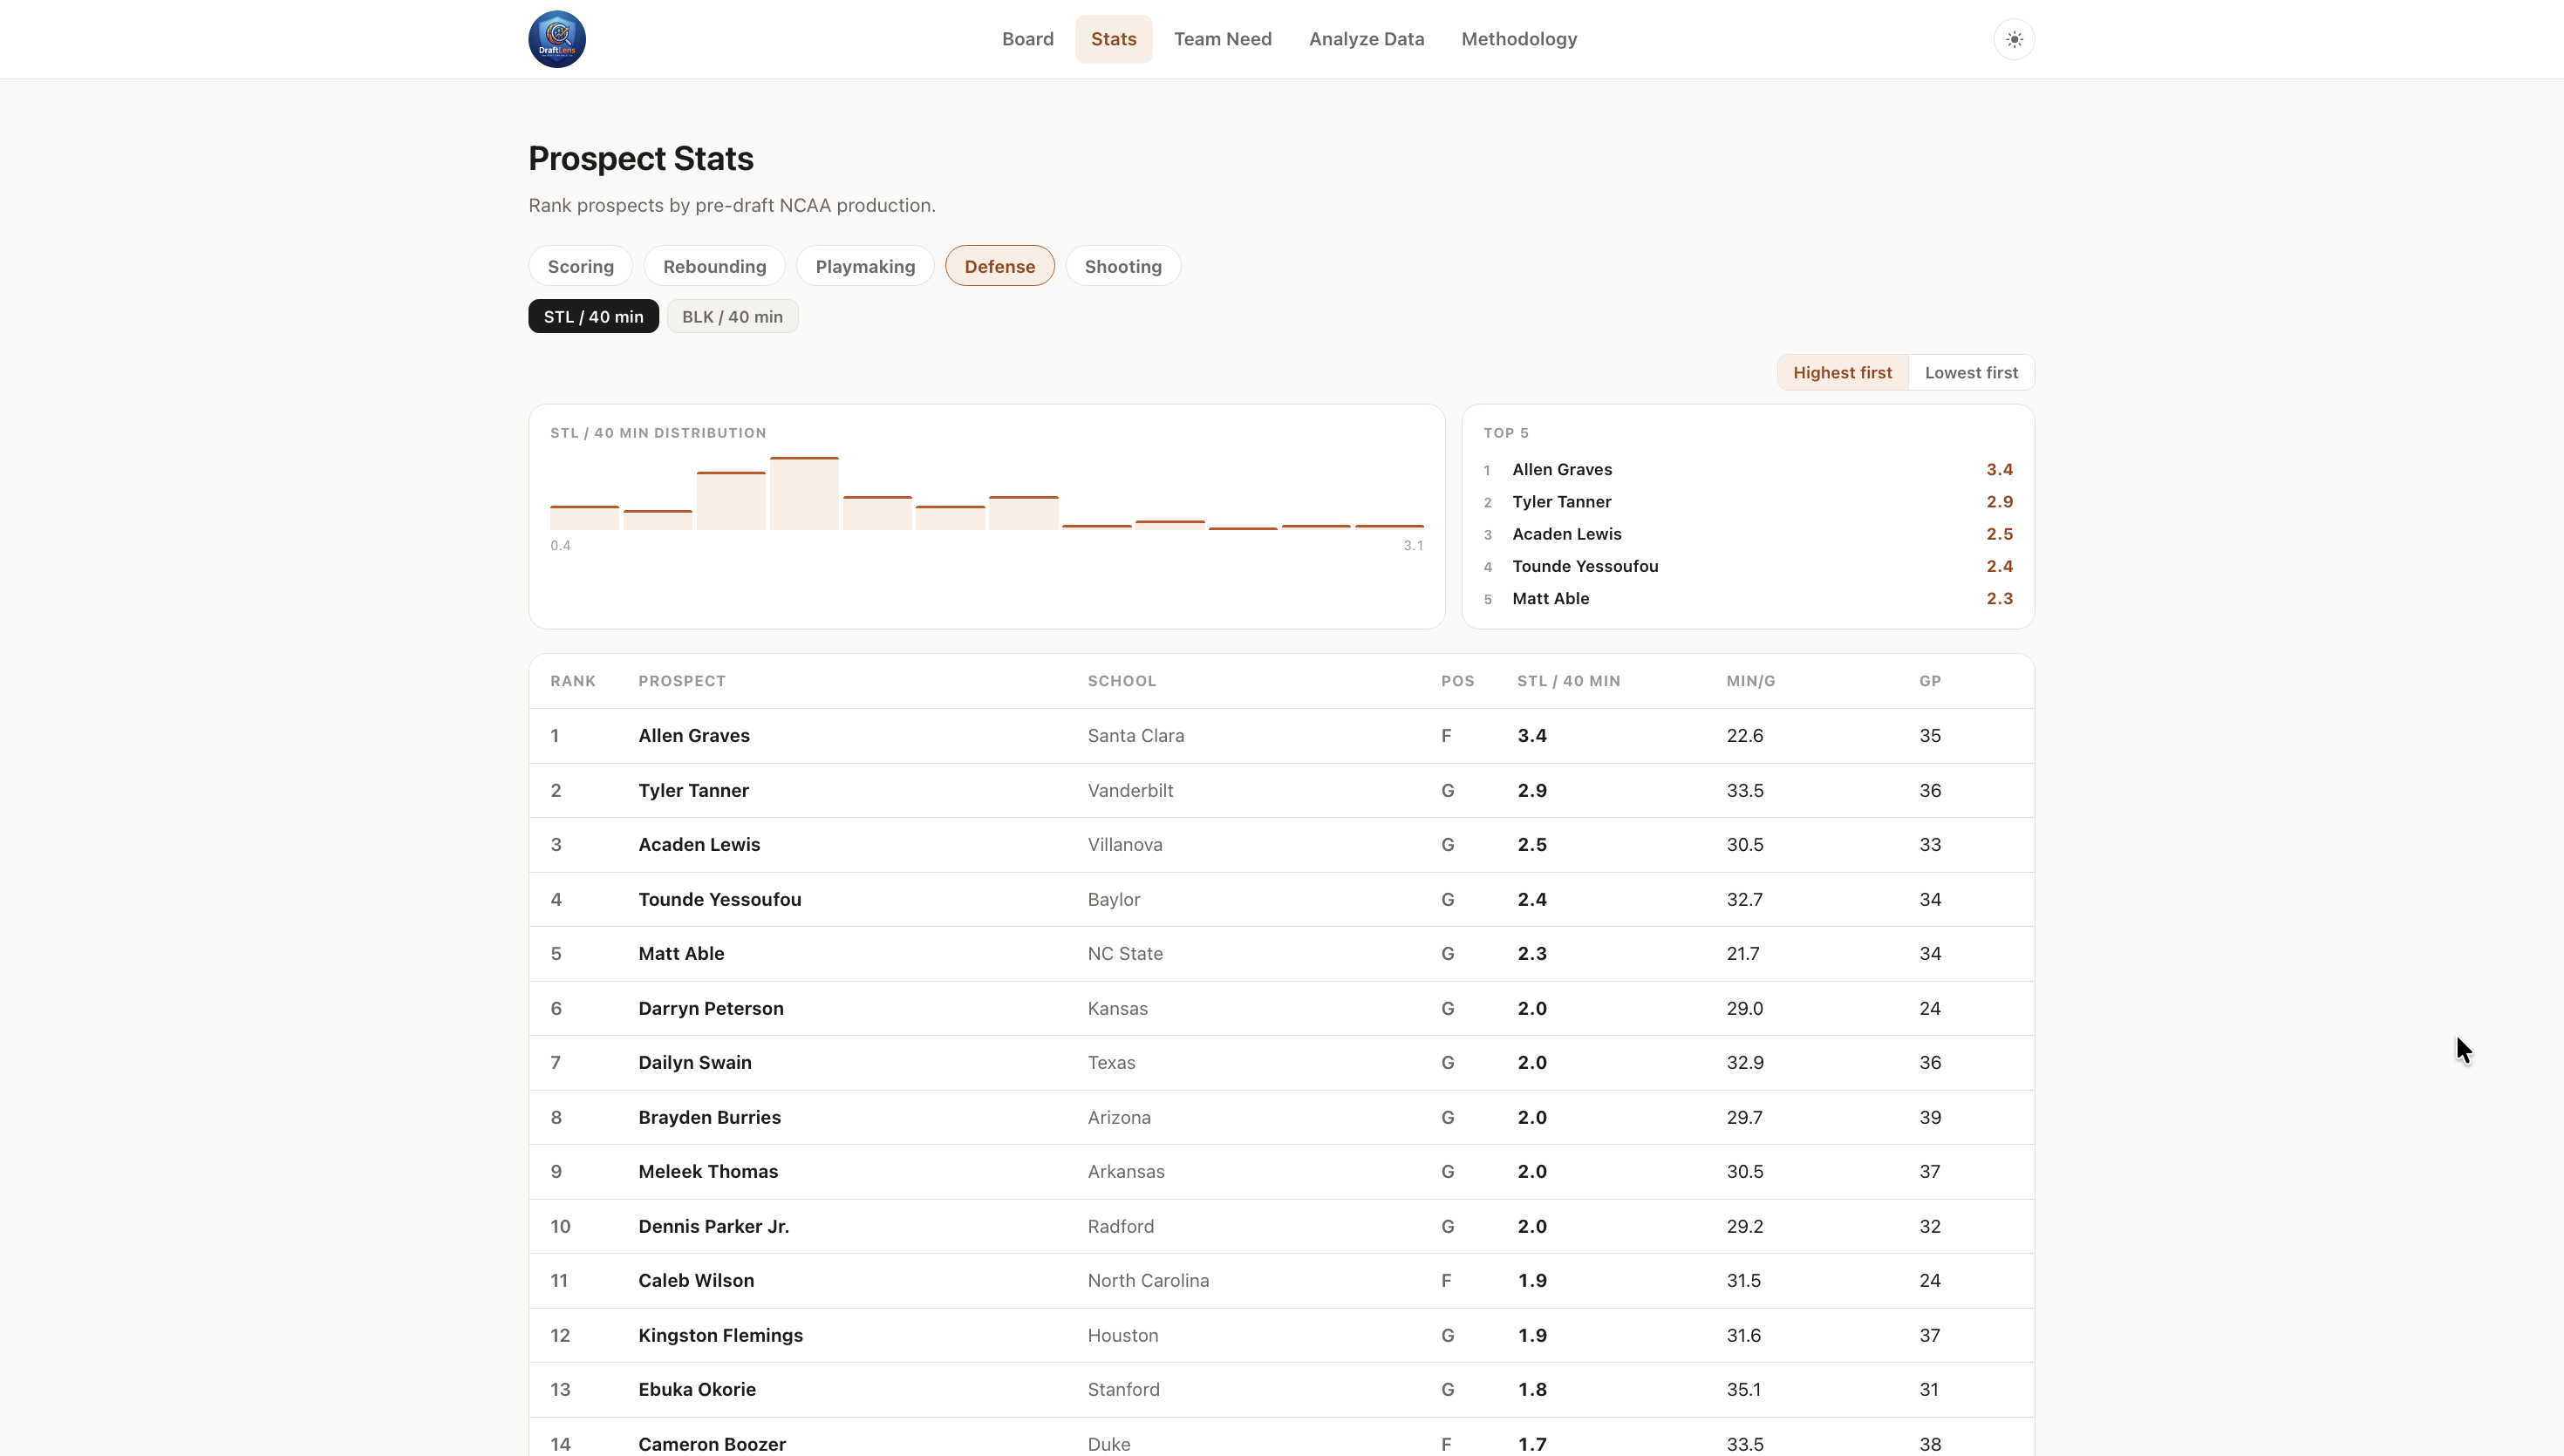
- Stats Explorer for ranking prospects directly by NCAA statistics;
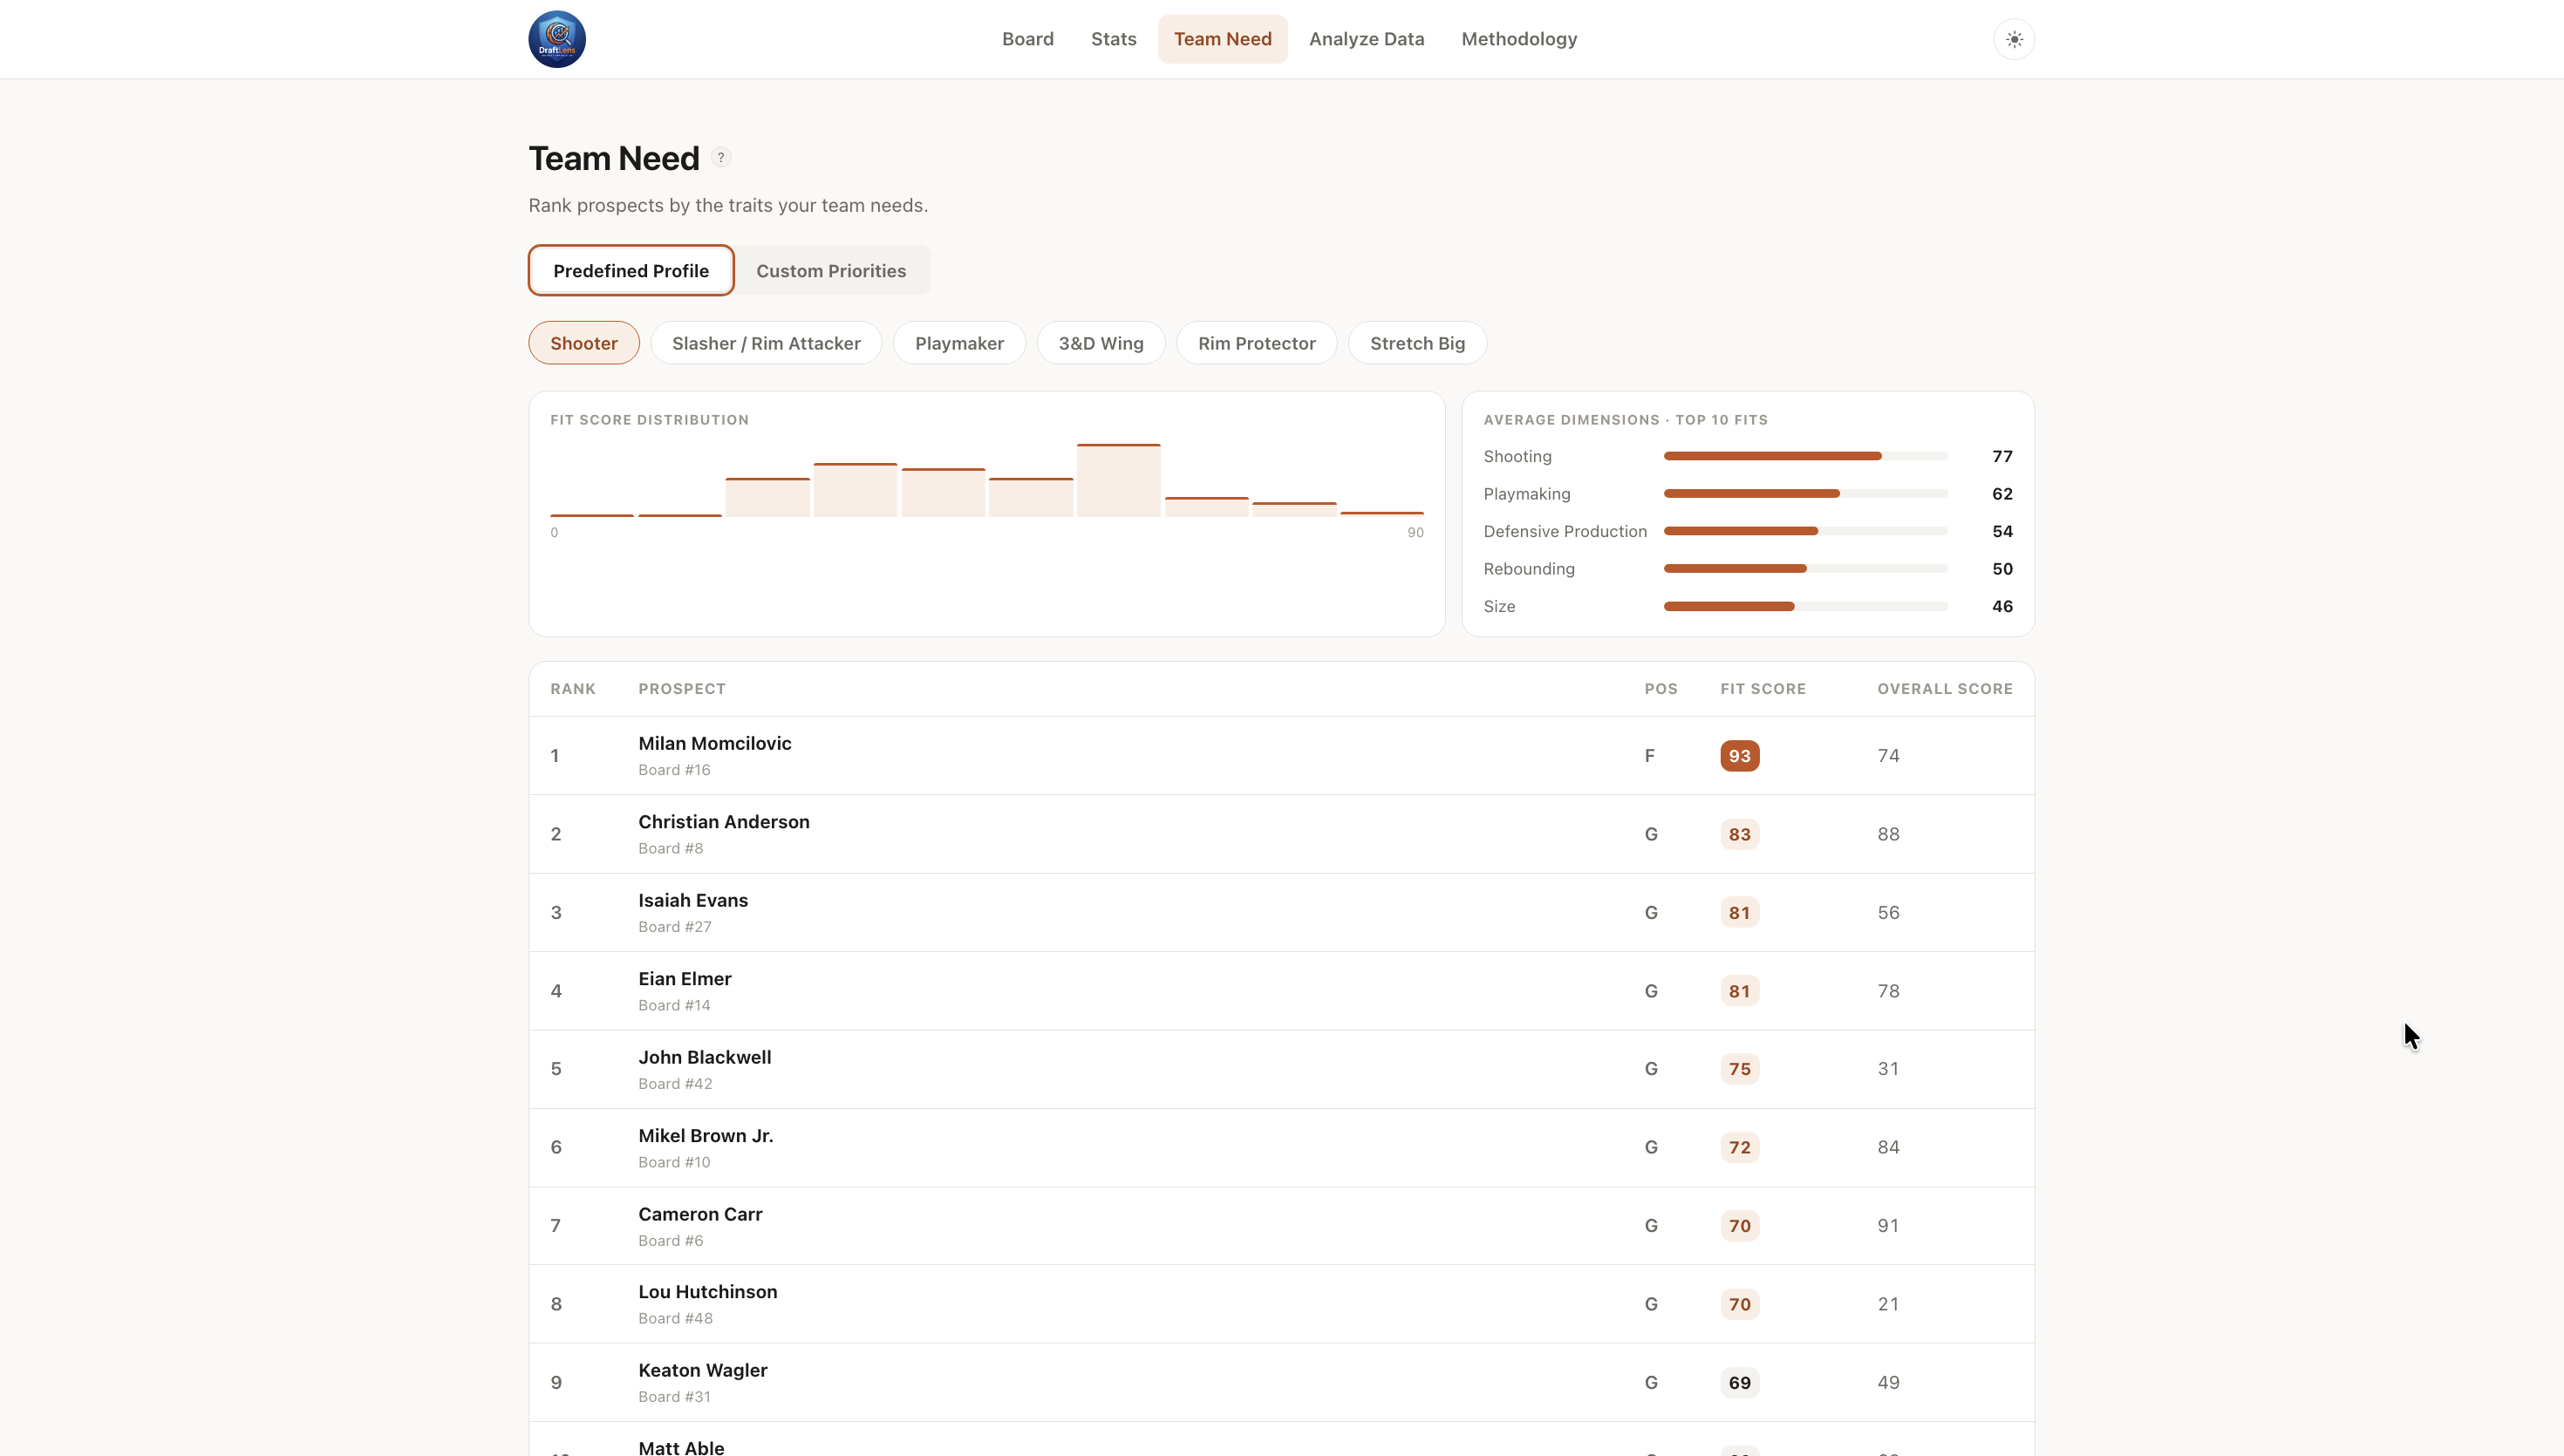
- Team Need, with six predefined archetypes and a customizable fit model;
- NBA Statistical Comparables, based on height plausibility and six-dimensional statistical similarity;
- Dataset Lab, allowing users to import their own Excel or JSON NCAA prospect dataset and run compatible DraftLens analyses directly in the browser.
The practical goal is to help analysts reduce a large prospect pool into a smaller set of players worth investigating, understand why they stand out and evaluate them through different basketball needs.
How we built it
DraftLens is split into two main parts: a Python analytics pipeline and a React/TypeScript product interface.
The historical dataset was built from NCAA and NBA data available through the sportsdataverse / hoopR ecosystem, combined with historical early-entry and NBA Draft information.
The main model-development population covers 2014–2025, with:
- 887 NCAA early entrants
- 431 drafted
- 456 undrafted
Instead of randomly splitting players across training and validation sets, DraftLens uses forward-in-time validation. Models are trained on earlier classes and evaluated on later classes so the evaluation better represents the real pre-draft setting.
Draft Probability uses logistic regression with season-relative statistical features.
Draft Order uses Ridge regression trained only on historically drafted prospects. Because predicting a literal draft pick is too noisy, its output is used as an ordering signal rather than displayed as an exact pick prediction.
The two signals are combined as:
Board Signal = P(drafted) × (S + 1 − clip(p̂, 1, S)) / S
where S is the draft size and p̂ is the Draft Order model output.
The frontend was built with React 19, TypeScript and Vite. The product includes light and night modes, interactive charts, prospect profiles, Team Need analysis and a browser-local Dataset Lab.
One of the most important technical parts of Dataset Lab was making sure the browser did not contain an approximate rewrite of the Python models. The frozen model parameters and reference data are generated from Python into a runtime bundle consumed by the frontend.
We verified the complete 2026 class through both implementations. Continuous outputs matched to numerical precision below 1e-12, while Board ranks, Overall Scores, Team Need Fit Scores and NBA comparable identities matched exactly.
Challenges we ran into
The biggest challenge was not training the models. It was making sure the data and evaluation were actually valid.
Preventing data leakage
NBA Draft data makes leakage surprisingly easy.
For example, defining a historical population using information only known after the draft can make a model look much stronger than it really is.
We therefore had to carefully audit population definitions, feature availability and historical coverage so that predictive features were available before each draft.
Some potentially useful information was deliberately excluded when historical coverage was not reliable enough.
Building a consistent historical prospect population
Identity resolution across NCAA data, NBA data and draft records was another challenge.
Players can appear under slightly different names or identifiers across different sources, so creating a reproducible historical dataset required careful matching and validation.
Making scores understandable
A model output is not automatically useful to a user.
We spent a significant amount of time turning raw outputs into understandable product concepts such as Basketball Profile, Team Need, Key Strengths and Areas to Watch.
Every one of these is deterministic and tied to actual statistics rather than generated scouting language.
NBA comparables
A purely statistical nearest-neighbour search could return players with similar numbers but unrealistic physical profiles.
We therefore added a height plausibility gate before statistical similarity. This reduced the average height difference between 2026 prospects and their NBA comparables from approximately 2.29 inches to 1.18 inches, while preserving three comparables for every prospect.
Bringing Python analytics into the browser
Dataset Lab introduced another major challenge: reproducing the frozen Python system in TypeScript without creating a second model implementation that slowly drifted away from the original.
The solution was to export a deterministic runtime bundle from Python and build strict browser/Python parity tests.
Accomplishments that we're proud of
The biggest accomplishment is that DraftLens became more than a model.
It started as a question about ranking NCAA prospects and ended as a full analytics product where users can move from a Board to a prospect profile, understand strengths, evaluate team fit, explore NBA comparables and even import their own draft class.
We are particularly proud of:
- building a historical dataset of 887 NCAA early entrants;
- using temporal validation rather than a convenient random split;
- keeping the analytical methodology frozen during final evaluation;
- making every important score explainable through underlying statistics;
- adding height-aware NBA comparables without changing the original statistical similarity space;
- building Dataset Lab with Excel and JSON import;
- keeping imported datasets entirely inside the user's browser;
- proving Python ↔ browser numerical parity rather than assuming both implementations behave the same;
- allowing DraftLens to refuse an unsupported analysis instead of generating a misleading number.
Most importantly, DraftLens is designed to be useful even when its answer disagrees with consensus. The user can inspect the data and understand where that disagreement comes from.
What we learned
One of the biggest lessons from building DraftLens was that sports analytics is often more about data discipline than model complexity.
Choosing an algorithm was relatively straightforward compared with questions such as:
- Who belongs in the historical population?
- Was this feature really available before the draft?
- How should missing information be treated?
- Does a score actually mean what the interface says it means?
- When should the product refuse to produce an answer?
We also learned that explainability is not just a machine-learning problem.
A technically explainable model can still be confusing if the product presents its outputs badly. Building the interface forced us to think about how someone actually interprets Draft Probability, Overall Score, Team Need fit and NBA comparables.
Finally, Dataset Lab taught us the importance of reproducibility across environments. Matching the Python and browser implementations exactly was much more valuable than simply making the feature appear to work.
What's next for DraftLens
There are several directions in which DraftLens could grow.
The first would be expanding the statistical input beyond box-score production. Better defensive tracking, play-type information, richer shot-location data and reliable physical measurements could improve both ranking and player-profile analysis.
Another direction would be evaluating DraftLens across additional future draft classes. More genuinely unseen classes would give a better picture of how stable the signals remain over time.
Dataset Lab could also become more flexible while keeping its strict methodology, for example by supporting additional NCAA data formats and richer analysis exports.
Finally, DraftLens could evolve into a broader scouting workspace where statistical analysis sits alongside film notes, human scouting evaluations and team-specific decision criteria.
The objective would remain the same:
Use data to help identify where a scout or analyst should look next — not to replace the decision itself.
Built With
- excel
- hoopr
- json
- machine
- machine-learning
- pandas
- pyarrow
- python
- react
- scikit-learn
- sports-analytics
- sports-data
- typescript
- vite

Log in or sign up for Devpost to join the conversation.