Inspiration
What it does
How we built it
Challenges we ran into
Accomplishments that we're proud of
What we learned
What's next for Draft Room
Inspiration
Before every series, a League coaching staff rebuilds the same spreadsheet:
- What does this opponent ban, and on which side?
- What do they first pick?
- What happens to their draft in game 3 of a Fearless series, when half their pool is gone?
The answers are in the match data, but they arrive as raw pick/ban lists. A coach needs them as tendencies they can trust, with the sample size attached, and a board they can draft on live.
What it does
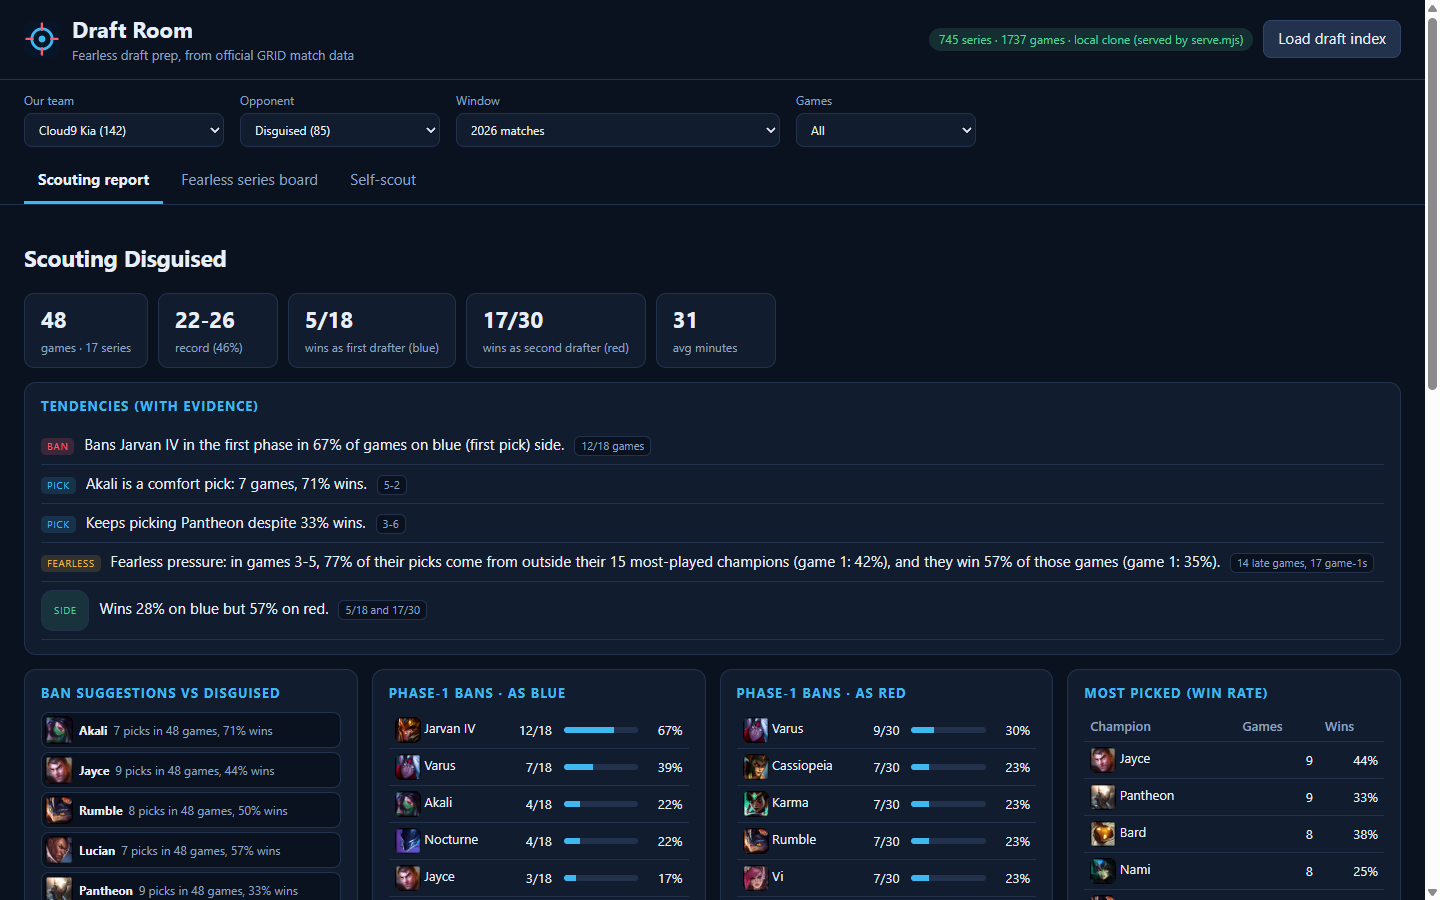
Scouting report. For any opponent and any window (2026, all matches, or one event; optionally the last 15 or 30 games):
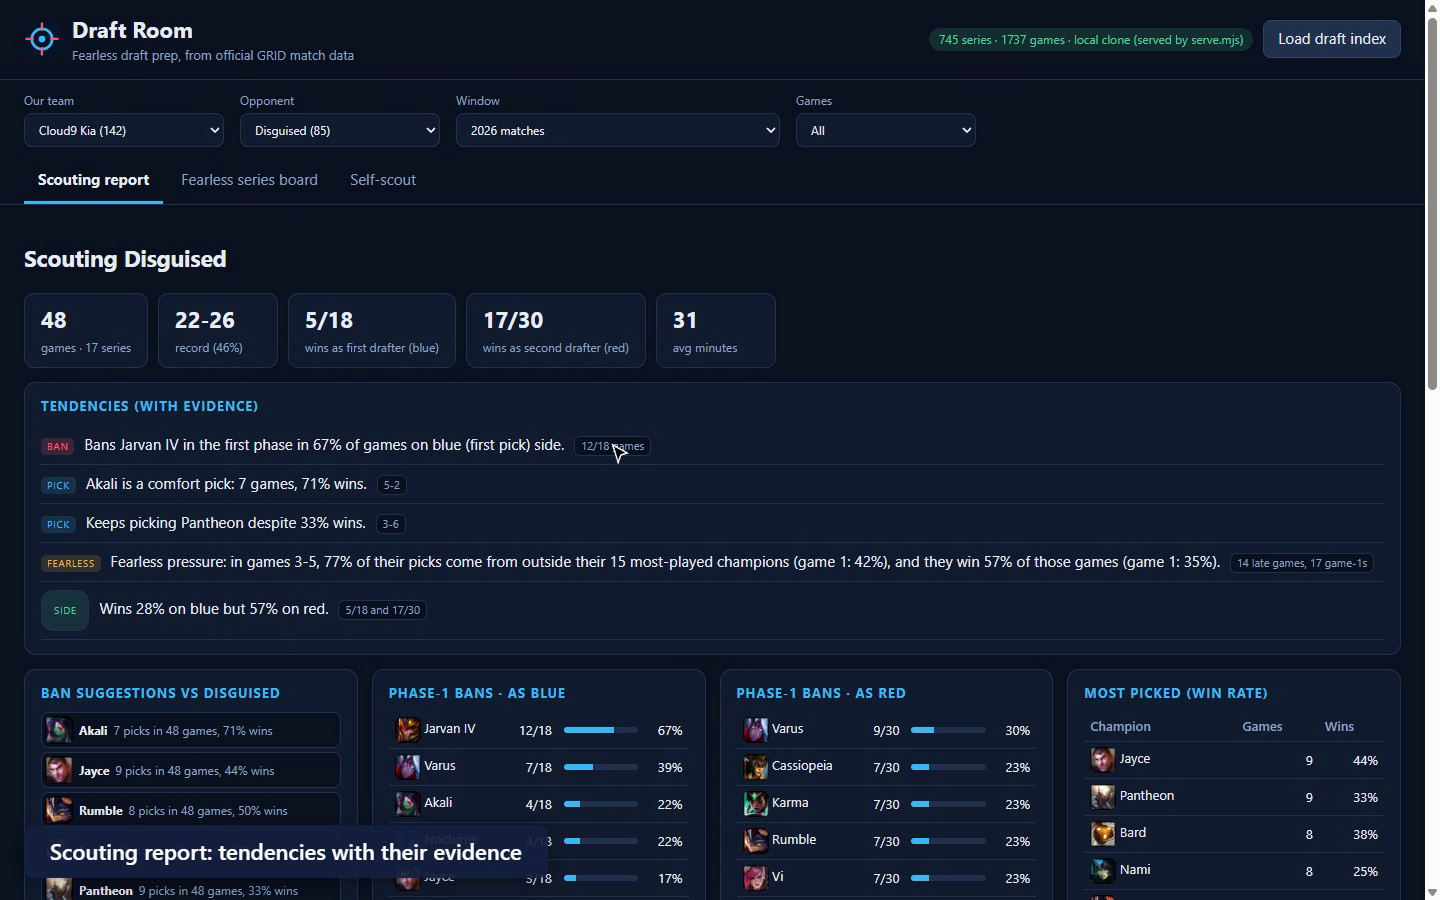
- Tendencies in plain sentences, each with its evidence. For example, "Bans Jarvan IV in the first phase in 67% of games on blue side · 12/18 games", or "Wins 28% on blue but 57% on red · 5/18 and 17/30". A tendency is stated only when there are at least 5 games behind it.
- Ban suggestions: their pick rate × win rate.
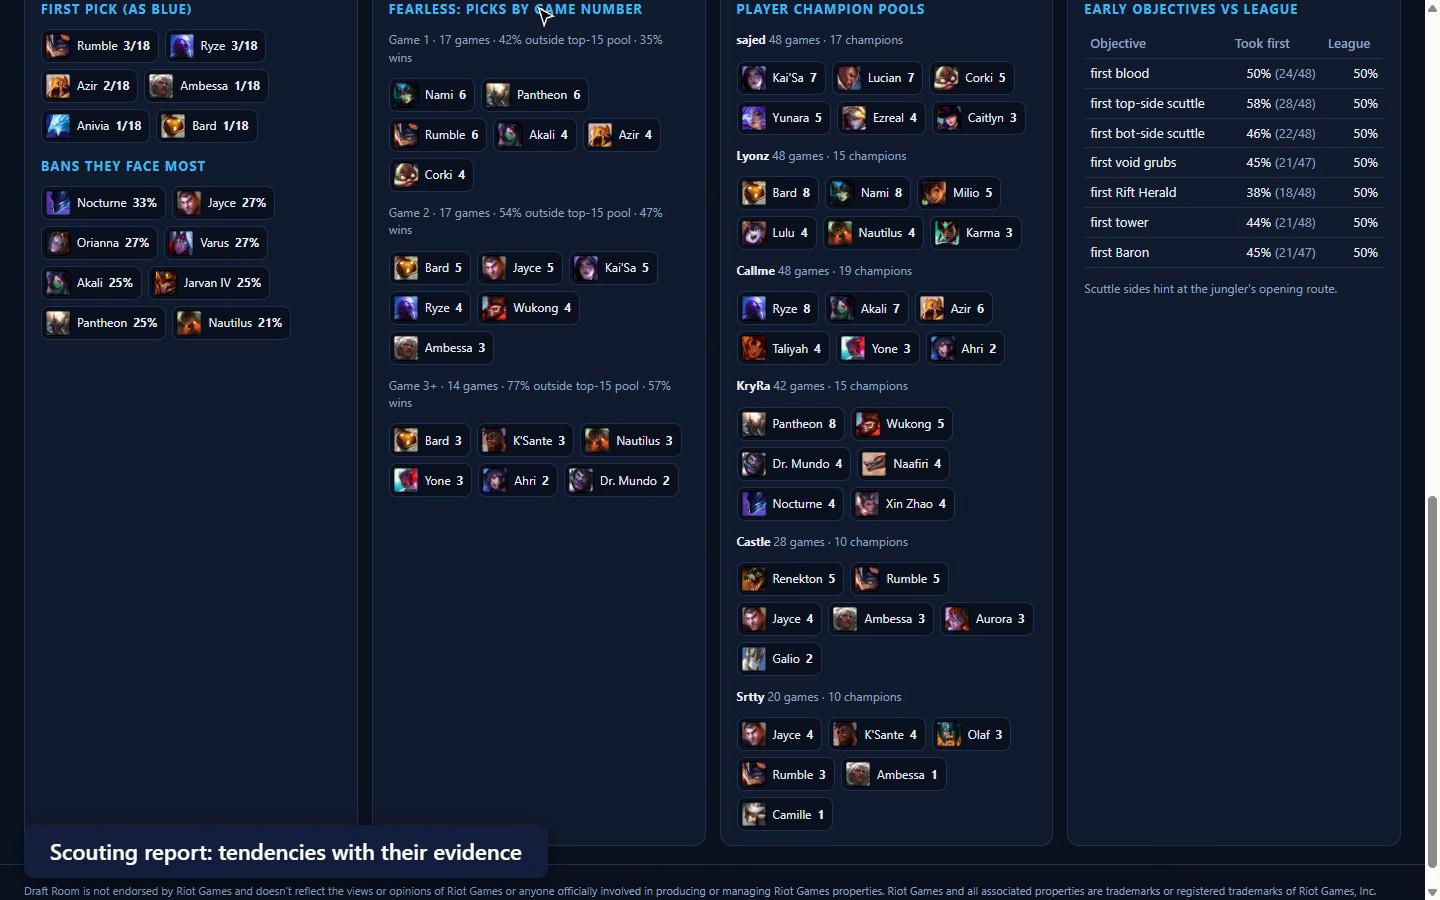
- Phase-1 bans by side, most-picked champions with win rates, first picks, and the bans they face.
- Player champion pools.
- Early objectives against the league average: first blood, top- and bot-side scuttle (a hint at the jungler's opening route), void grubs, Herald, tower and Baron.
- The Fearless question. For game 1, game 2 and game 3+, it shows:
- picks by game number;
- the share of picks that come from outside the team's 15 most-played champions;
- the win rate in those games.
Example: "in games 3–5, 77% of their picks come from outside their top-15 pool (game 1: 42%)".
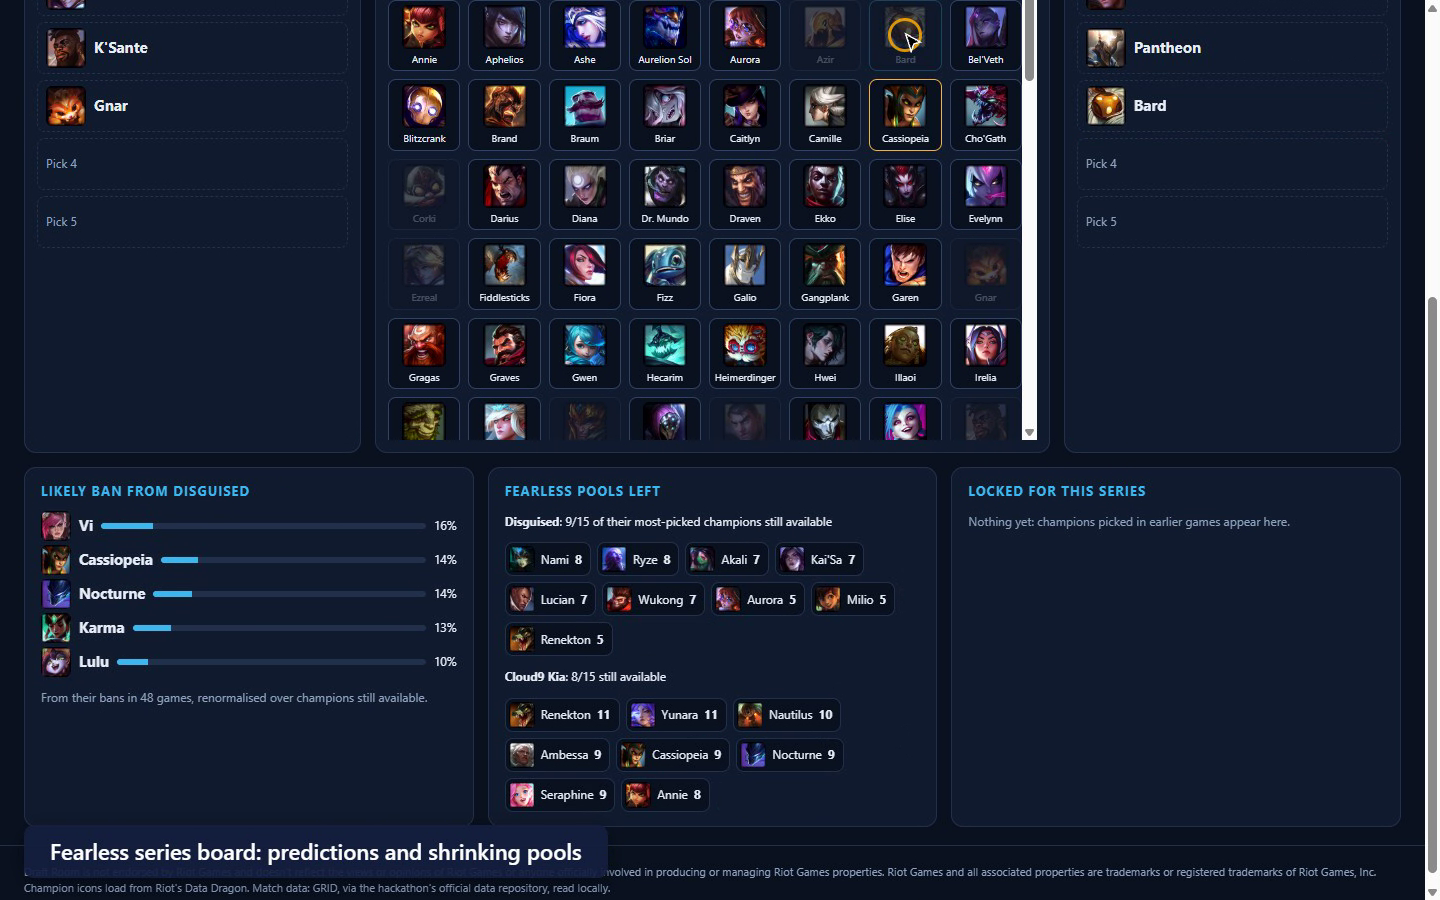
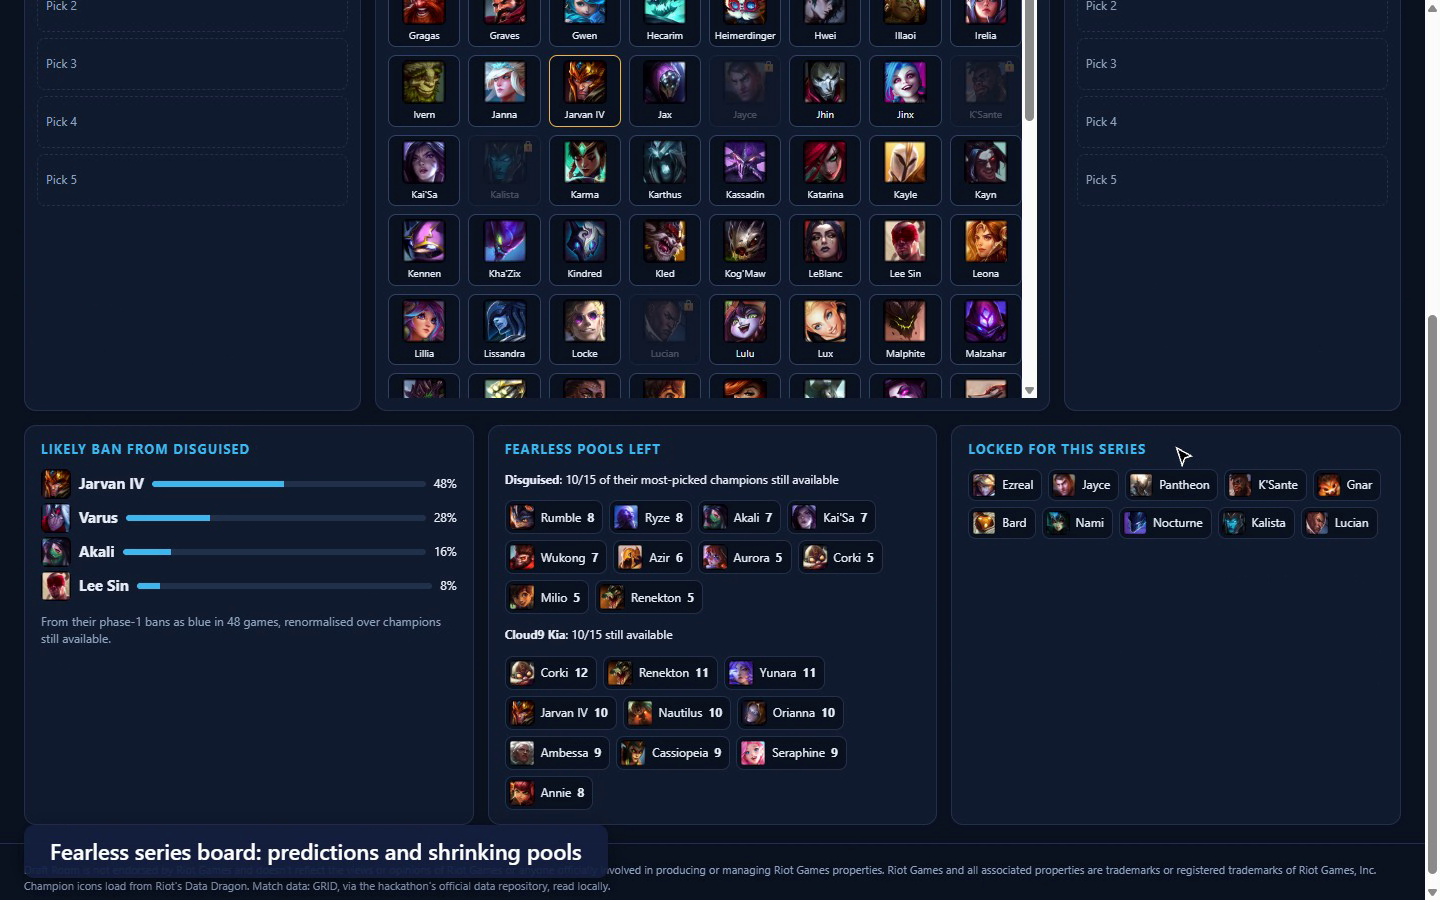
Fearless series board. A Bo3 or Bo5 in the pro draft order (20 steps):
- Every champion picked in an earlier game is locked for both teams.
- On the opponent's turn, it predicts their likely ban or pick from their own history, phase- and side-specific for first-phase bans, and renormalised over the champions still available.
- On our turn, it suggests bans.
- It shows how many of each team's 15 comfort picks are still open as the pool shrinks.
- The series is saved in the browser and copies out as a text summary for the staff chat.
Self-scout. The same report on Cloud9 Kia: what opponents can read about us.
How we built it
The data stays local. The GRID data may not be redistributed, even as derived data, so the hosted app ships none.
tools/build-index.mjsstreams the local clone of the official repository with Node's built-in zstd. It takes each League series' finalseriesState, as the README says the last event holds the box score, and writes.local/index.json, which is git-ignored:- each game's ordered
draftActions; - per-team objective flags (
completedFirst); - rosters.
On the full data set: 745 series and 1,737 games in about 70 seconds.
serve.mjsserves the app with that index from 127.0.0.1. Alternatively, the hosted app loads the file from disk into the browser.
Checked against the data before building on it:
- 1,719 of 1,721 complete drafts follow the standard order. The first drafter is treated as blue, because the side label is swapped in 242 feeds.
- Across 568 multi-game series, no champion is ever picked twice. Every series is Fearless, so the lock rule matches reality.
src/analyze.jsis pure and unit-tested on synthetic data. It holds the draft order, team reports, the Fearless shift, league baselines, tendency sentences with evidence, predictions, ban suggestions and Fearless locks.The UI is plain ES modules, with no build step. Champion icons load from Riot's Data Dragon at runtime; offline, tiles fall back to initials.
JetBrains tools
WebStorm 2026.3 is the IDE for the project, and the .idea folder with the project model and inspection profile is committed. The inspection profile ran over the code with WebStorm's inspector. It found three real issues, all fixed:
- an untyped filter parameter that WebStorm inferred as null-only (JSDoc types added);
- an ignored promise from the app's start-up (errors are now shown);
- a redundant initialiser.
See JETBRAINS.md.
Challenges we ran into
- Respecting the data license and still giving judges something runnable. The answer was a local index builder plus an app that never contains data.
- No player roles in the data. Roster order isn't role order, so pools are shown per player rather than per lane.
- Making numbers trustworthy. Every claim shows its sample size, and nothing below 5 games is stated as a tendency.
Accomplishments that we're proud of
In about a minute, a coach goes from a raw data clone to sentences like "With first pick, takes Azir 31% of the time · 9/29 first-pick games", plus a live board that knows which champions are gone in game 3.
What we learned
In Fearless, the interesting signal is how a team copes when its comfort pool runs out: the share of picks from outside its core, and its win rate when it gets there.
What's next
- Role inference from champion and lane data.
- Patch filters and a "since the last patch" window.
- Head-to-head history between the two teams on the board.
- Jungle pathing from player positions in the event feed.
Built With
- data-dragon
- github
- grid-esports-data
- javascript
- node.js
- webstorm
- zstd
