-
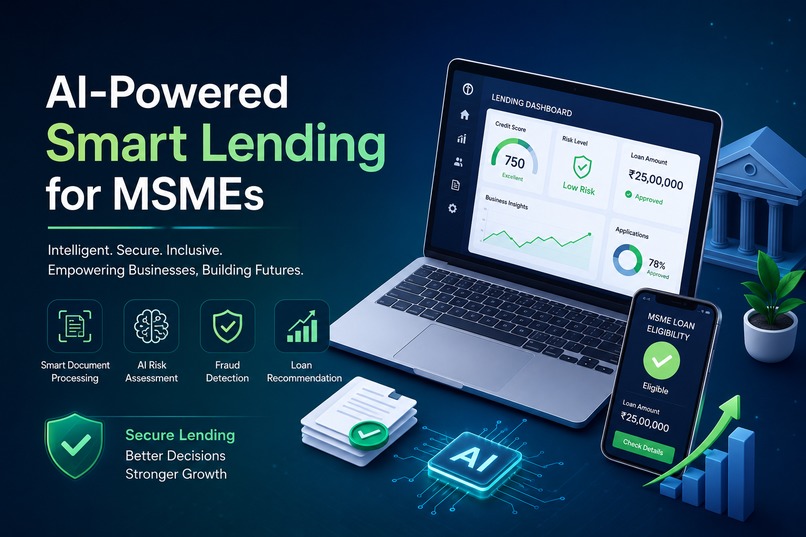
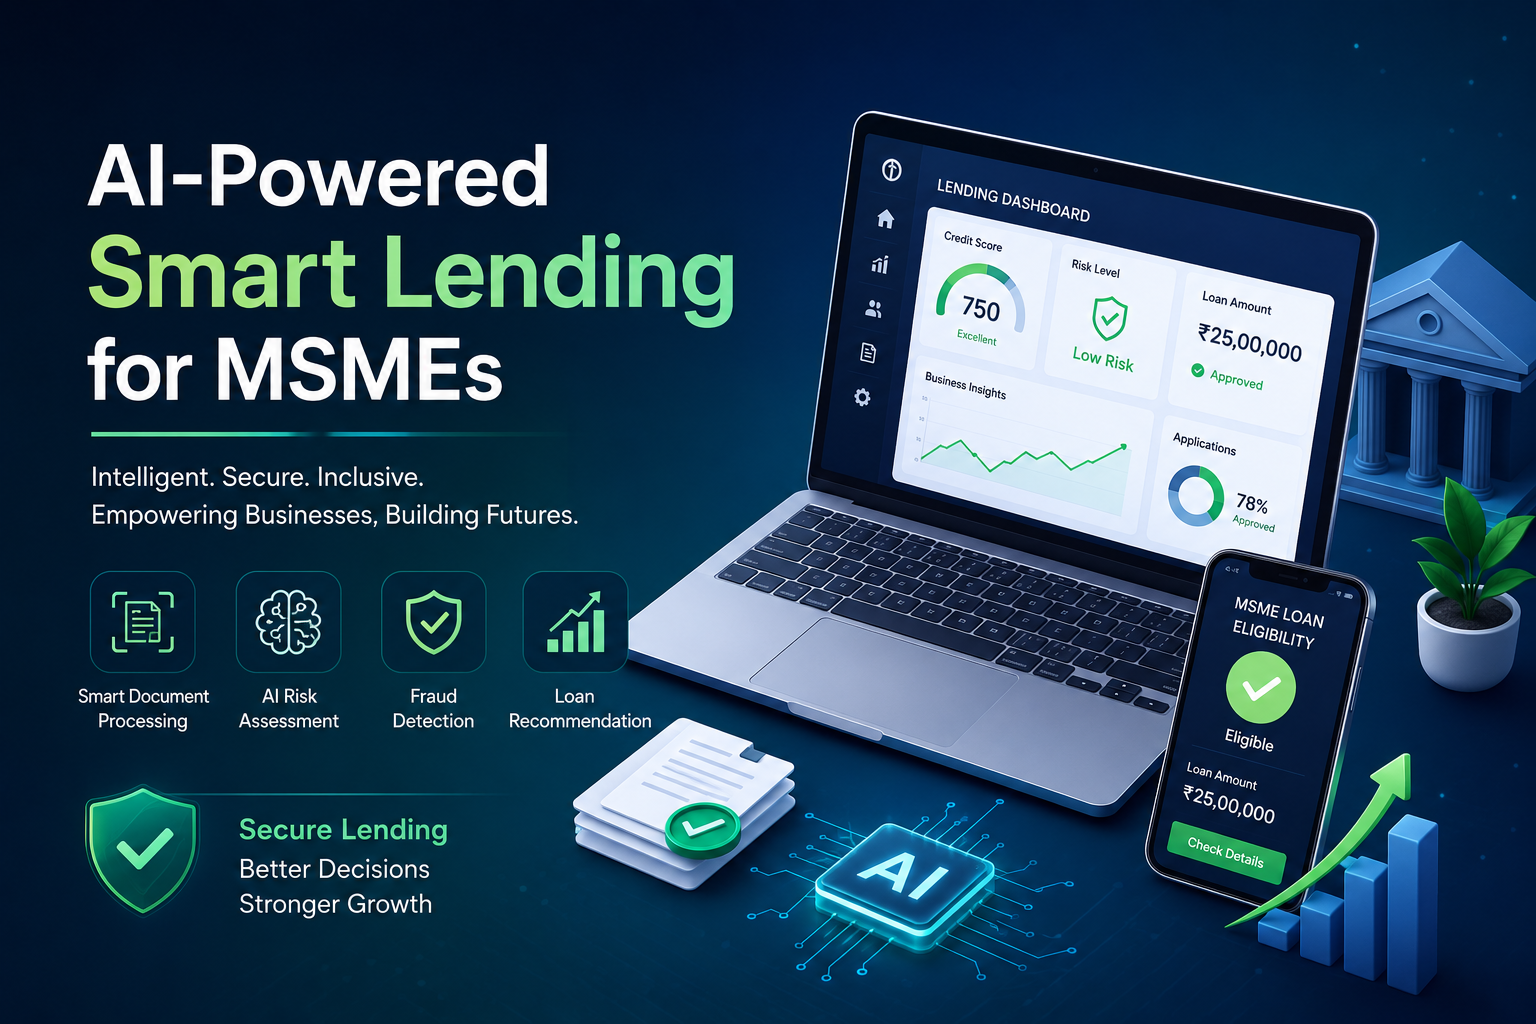
DPI Health Card Dashboard: AI-powered MSME loan risk scoring from GST and bank data
Inspiration
India’s MSMEs are the backbone of the economy, yet many still struggle to access formal credit because they lack audited financials, long credit histories, or traditional collateral. At the same time, India has built one of the world’s strongest Digital Public Infrastructure stacks — including GSTN, Account Aggregator (AA), and digital banking — but underwriting still often depends on PDFs, emails, and manual verification.
I wanted to answer a simple question:
If banks already have access to trusted digital data, why are MSME loans still slow, opaque, and high-friction?
That question led to the idea of a DPI Health Card: a single, explainable dashboard that uses GST and bank data to generate a fast, transparent health score for an MSME. Instead of more paperwork, the bank officer gets a structured, DPI-powered view of the business.
What the project does
The DPI Health Card Dashboard is a sandbox MSME underwriting tool that simulates how a bank could use India’s digital financial rails — especially GSTN and AA-style consent-based data — to make lending decisions more confidently.
At a high level, the app:
- Simulates a consent workflow inspired by the AA framework, using only mock data.
- Ingests sample bank transactions and GST returns in a normalized format.
- Triangulates GST-declared sales against actual bank credits.
- Detects red flags such as fake invoicing patterns, abnormal cash deposits, and circular transactions.
- Computes a Financial Health Score on a 0–100 scale using multiple dimensions.
- Presents the result on an underwriter dashboard with a radar chart, alerts, and an Approve / Review / Reject suggestion.
The goal is not to replace existing scoring models, but to show how DPI data can become an explainable credit health card in minutes instead of weeks.
How I built it
Tech stack
- Frontend: React + Vite + TypeScript
- Logic: Modular utility functions and hooks for triangulation and scoring
- UI: Radar charts, score cards, and alert panels
- Data: Synthetic JSON/TS datasets that emulate:
- Bank ledgers with credits, debits, counterparties, and timestamps
- GST returns such as GSTR-1 / outward supplies, tax periods, and turnover
Architecture
The app follows a simple but realistic underwriting flow:
- Consent Simulator
A UI screen that mimics AA-style consent for:- Bank accounts
- GST returns
- Data history, such as 12–24 months
This is clearly marked as simulation mode, with no live GSTN or AA connectivity.
- Data Ingestion & Normalization
The app loads sample datasets and maps them into a common internal schema.
Transactions:
[ \text{txn} = (\text{date}, \text{amount}, \text{type}, \text{counterparty}, \text{channel}) ]GST entries:
[ \text{gst_row} = (\text{tax_period}, \text{outward_value}, \text{invoice_count}, \text{gstin}) ]
- Triangulation Engine
The core logic compares GST-declared sales with bank credits and checks for additional risk signals.
Sales-bank match ratio:
[ r = \frac{\text{total bank credits}}{\text{total GST outward sales}} ]Cash anomaly score based on frequency and amount of cash deposits.
Circular transaction checks for repeated credits and debits with the same counterparties.
Seasonality and volatility in monthly inflows.
Customer concentration based on top counterparties vs total volume.
- Financial Health Score
The score is a weighted combination of multiple dimensions:
[ \text{Score} = w_1 S_{\text{cash}} + w_2 S_{\text{gst}} + w_3 S_{\text{liquidity}} + w_4 S_{\text{anomalies}} + w_5 S_{\text{match}} + w_6 S_{\text{concentration}} + w_7 S_{\text{seasonality}} ]
Each ( S_i ) is normalized to ( [0, 1] ), and the final score is scaled to ( [0, 100] ).
Score bands:
- 80–100: Low risk
- 60–79: Medium risk
- 0–59: High risk
- Underwriter Dashboard & Explainability View
- Radar chart for the seven dimensions
- Numeric score with a clear risk band
- Alert panel with key red flags
- Short explanation of why the score is high or low
- Suggested action: Approve, Detailed Review, or Reject
The app is deployed as a static frontend on Vercel, making it easy for juries and mentors to open and test.
What I learned
Working on this project taught me several important lessons:
Domain clarity matters as much as code.
Understanding MSME lending, GST returns, and the AA ecosystem was essential to designing a believable scoring model.Explainability is critical in FinTech AI.
A score alone is not enough. Bank officers need to know why the system reached a recommendation, so I designed alert panels and narrative explanations instead of only numbers.DPI is powerful but must be handled carefully.
Even in a prototype, I had to stay precise about what is simulated and what would require real regulatory integration.Storytelling and UX shape impact.
The same logic can feel very different depending on how it is presented. Clear personas (“Clean,” “Seasonal,” “Suspicious”), a visible score, and simple language made the app much easier to understand.
Challenges faced
Balancing realism and hackathon scope
A fully accurate GSTN + AA integration would require real financial institutions, approvals, and security controls. I constrained the project to a realistic sandbox while still showing credible workflows.Designing a multidimensional score
Turning several noisy signals — cash flow, GST compliance, anomalies, concentration, and seasonality — into one intuitive score was challenging. I iterated on weights and normalization to avoid extreme or confusing results.Keeping the UI simple for non-technical judges
It was tempting to show every metric and chart, but that would have made the demo harder to follow. I focused on one main score, one radar chart, a few critical alerts, and a clear decision tag.Communicating that this is a simulation
To avoid confusion, I added clear simulation labels and disclaimers while still emphasizing that the approach is designed to plug into real DPI rails in the future.
Future roadmap
If this prototype were taken forward, the next steps would be:
- Integrating with real AA sandbox environments through regulated partners
- Adding ML-based anomaly detection on top of rule-based checks
- Supporting more data sources such as UPI flows, invoices, and e-way bills
- Building APIs for banks and fintechs to embed the Health Card into their lending systems
- Expanding explainability with case-based reasoning and scenario simulations
Built With
- datavisualization
- html5
- javascript
- node.js
- python
- react
- tawlincss
- typescript
- vite


Log in or sign up for Devpost to join the conversation.