-
-
Thumbnail
-
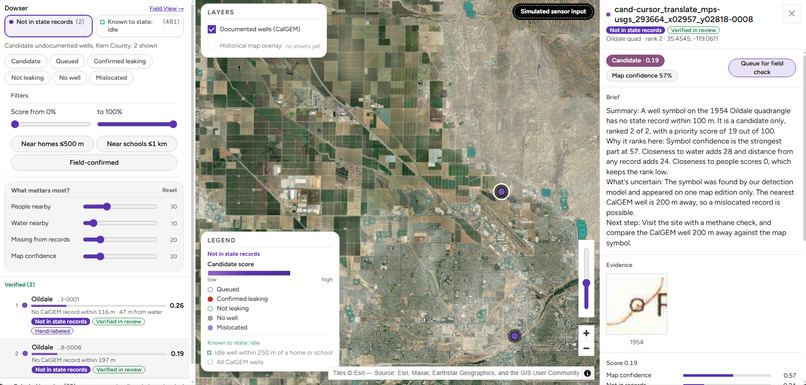
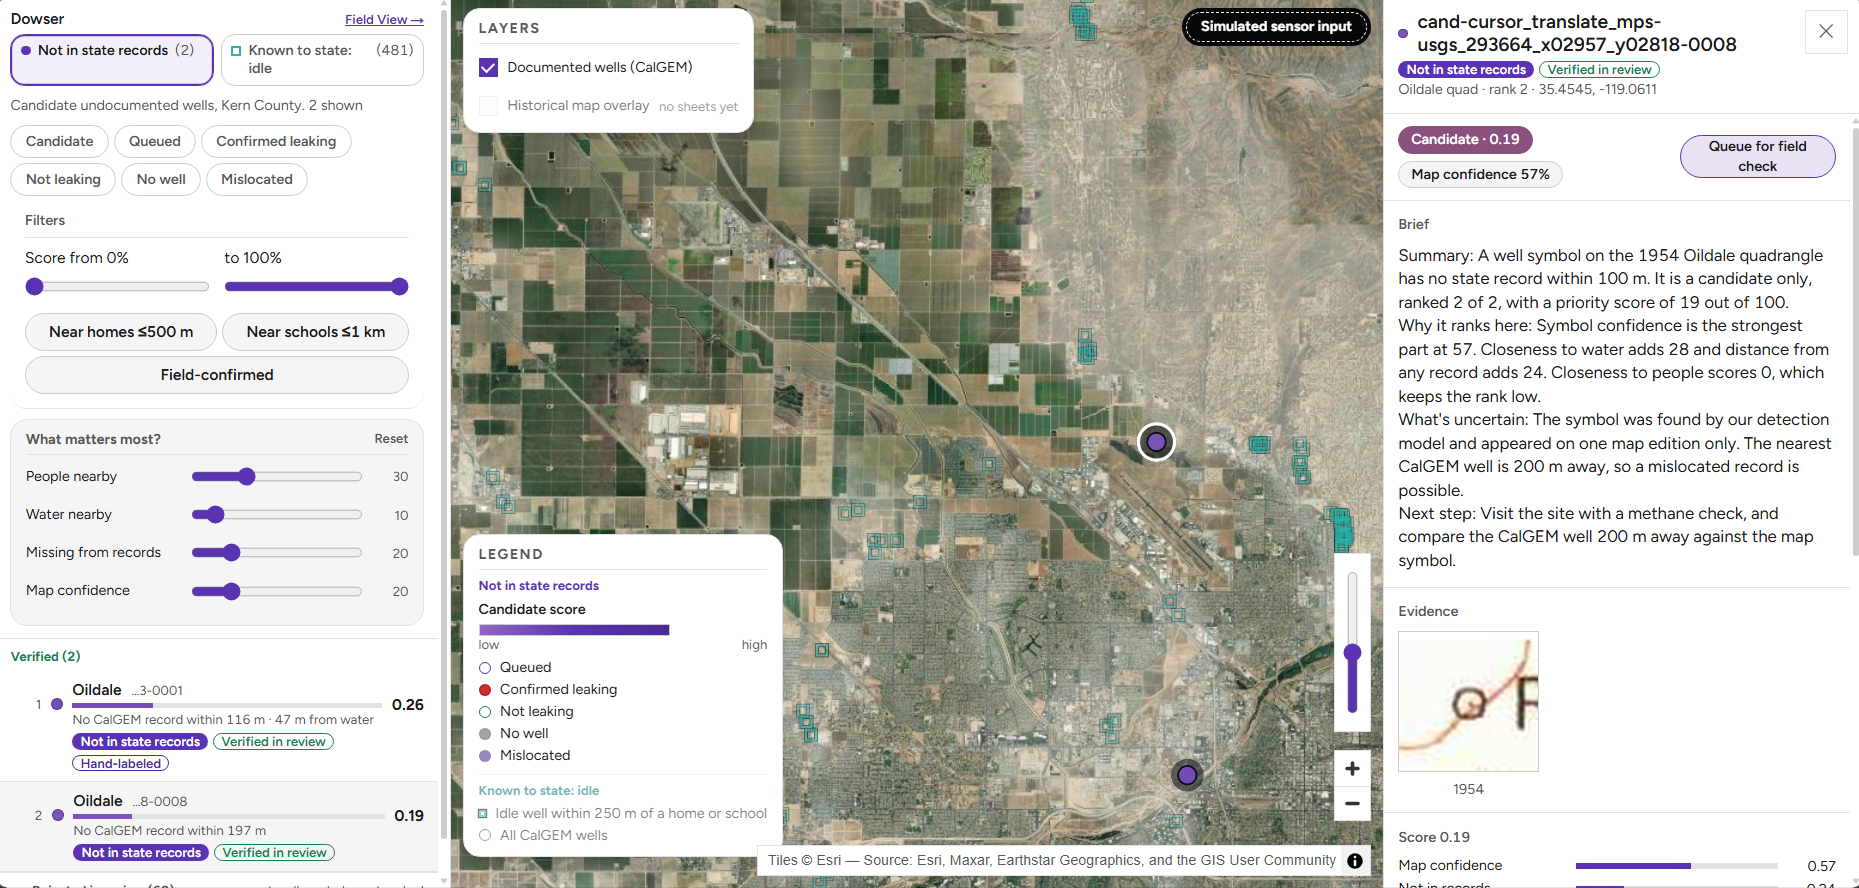
Command Map: a candidate open with its Brief and the historical-map evidence crop. The "Simulated sensor input" pill is always visible.
-
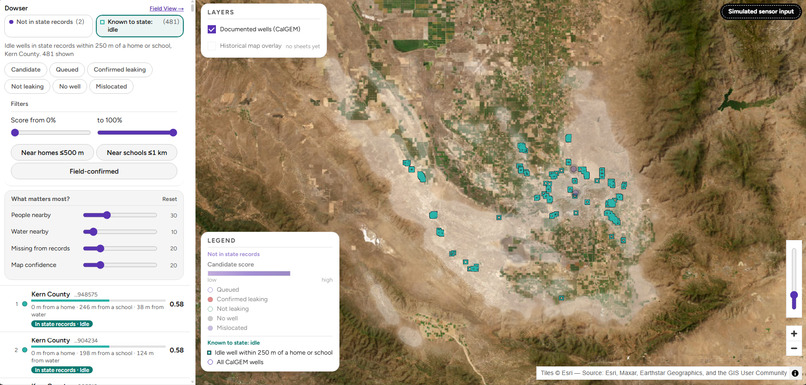
Command Map: a candidate open with its Brief and the historical-map evidence crop. The "Simulated sensor input" pill is always visible.
-
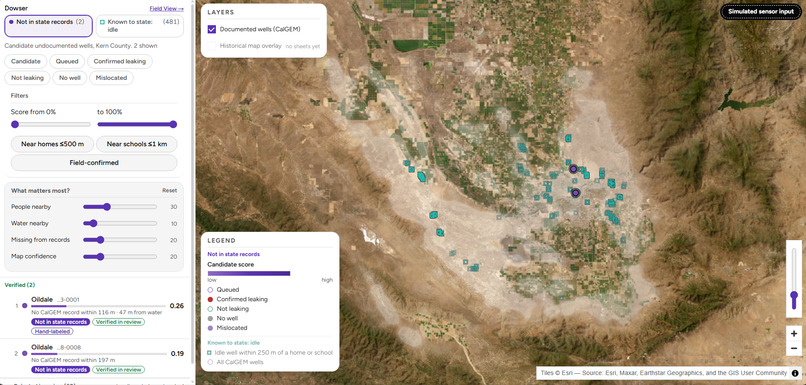
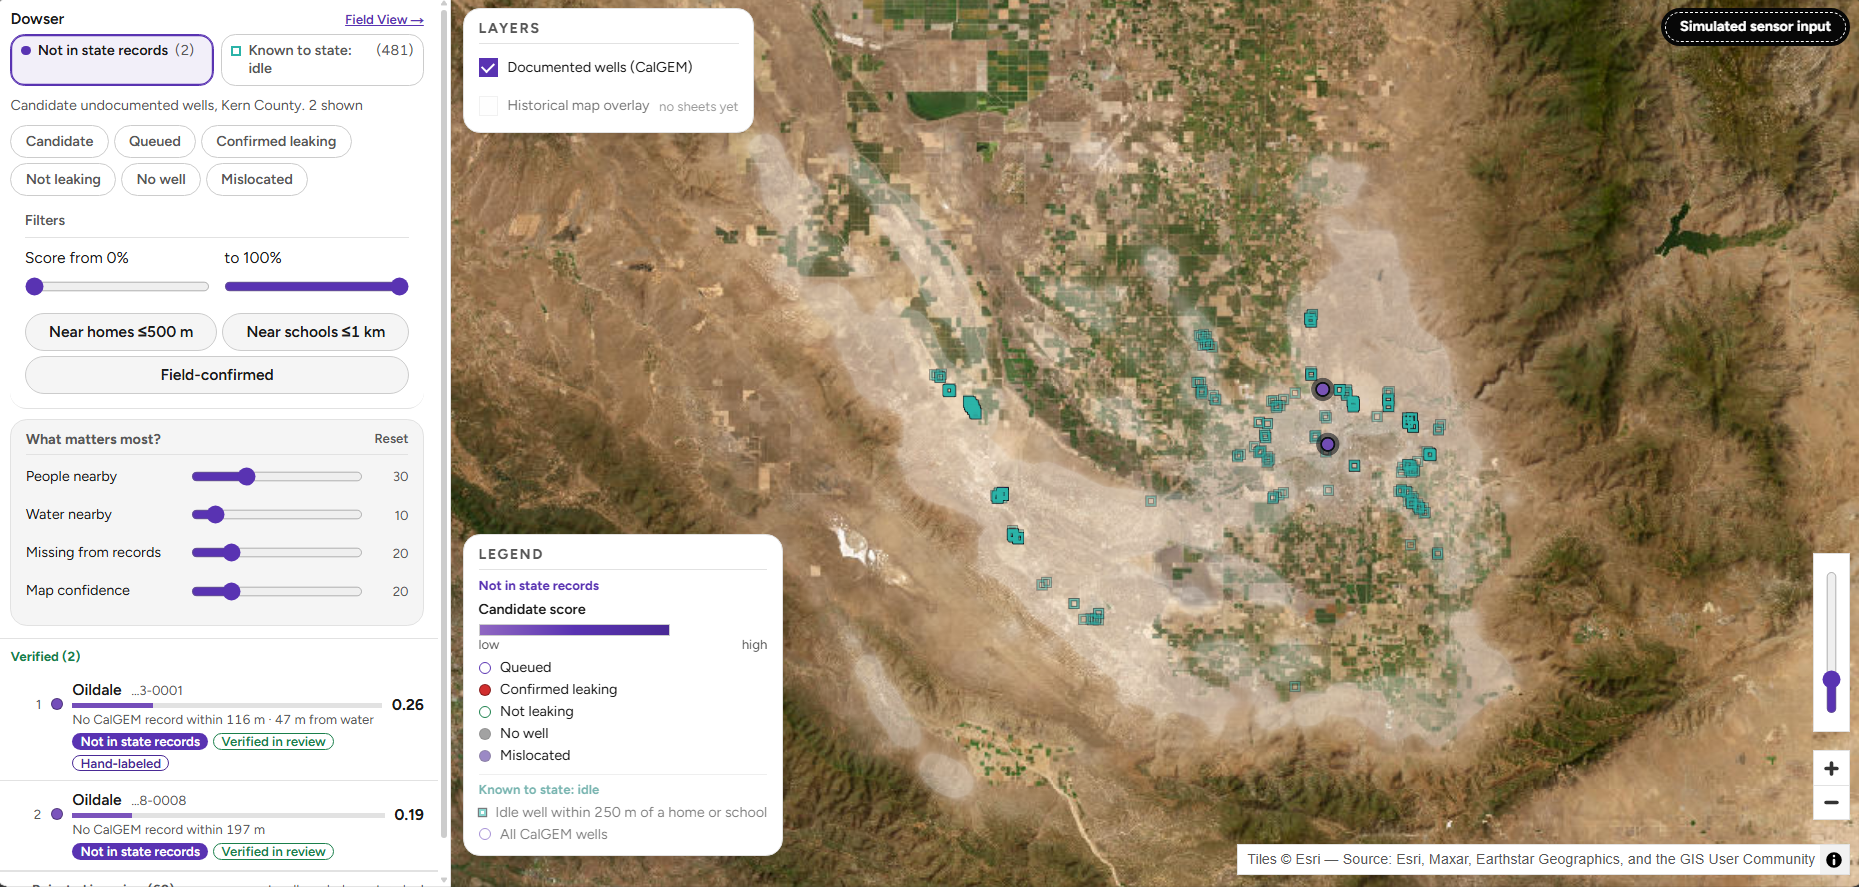
The 2 candidates not in state records, over Kern County.
-
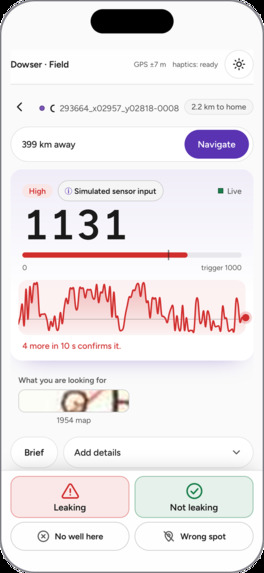
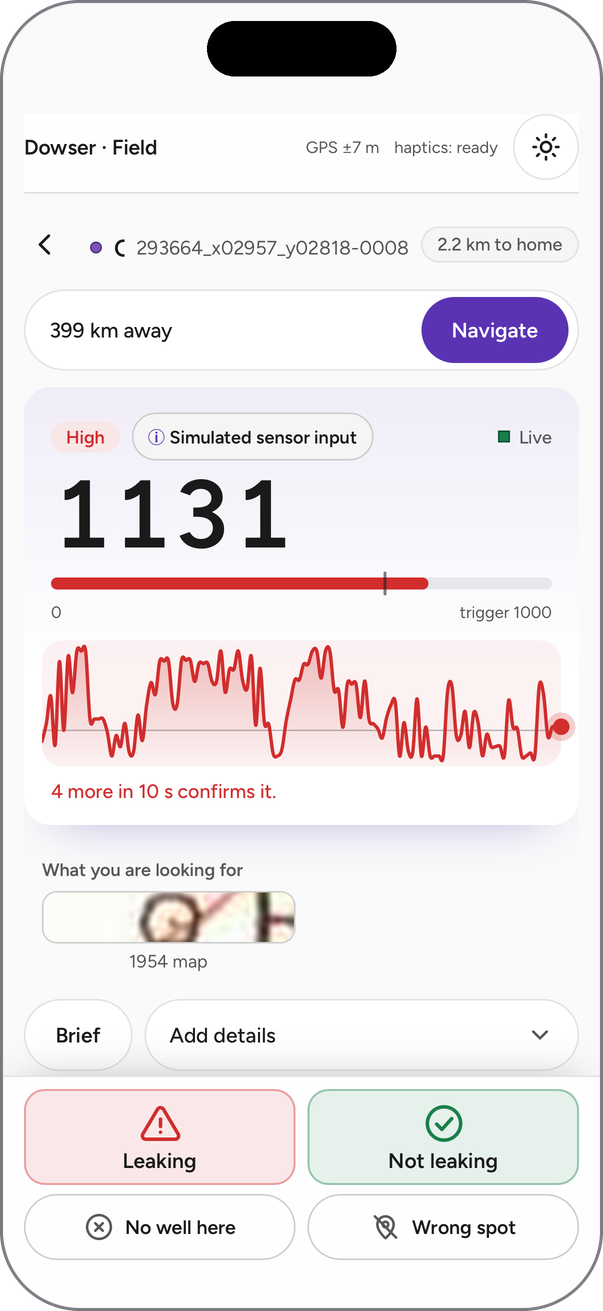
At the well: live gauge (simulated input) and one-tap decisions.
-
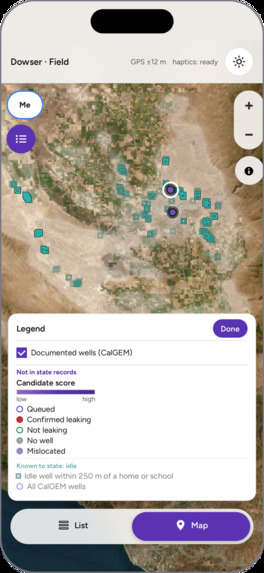
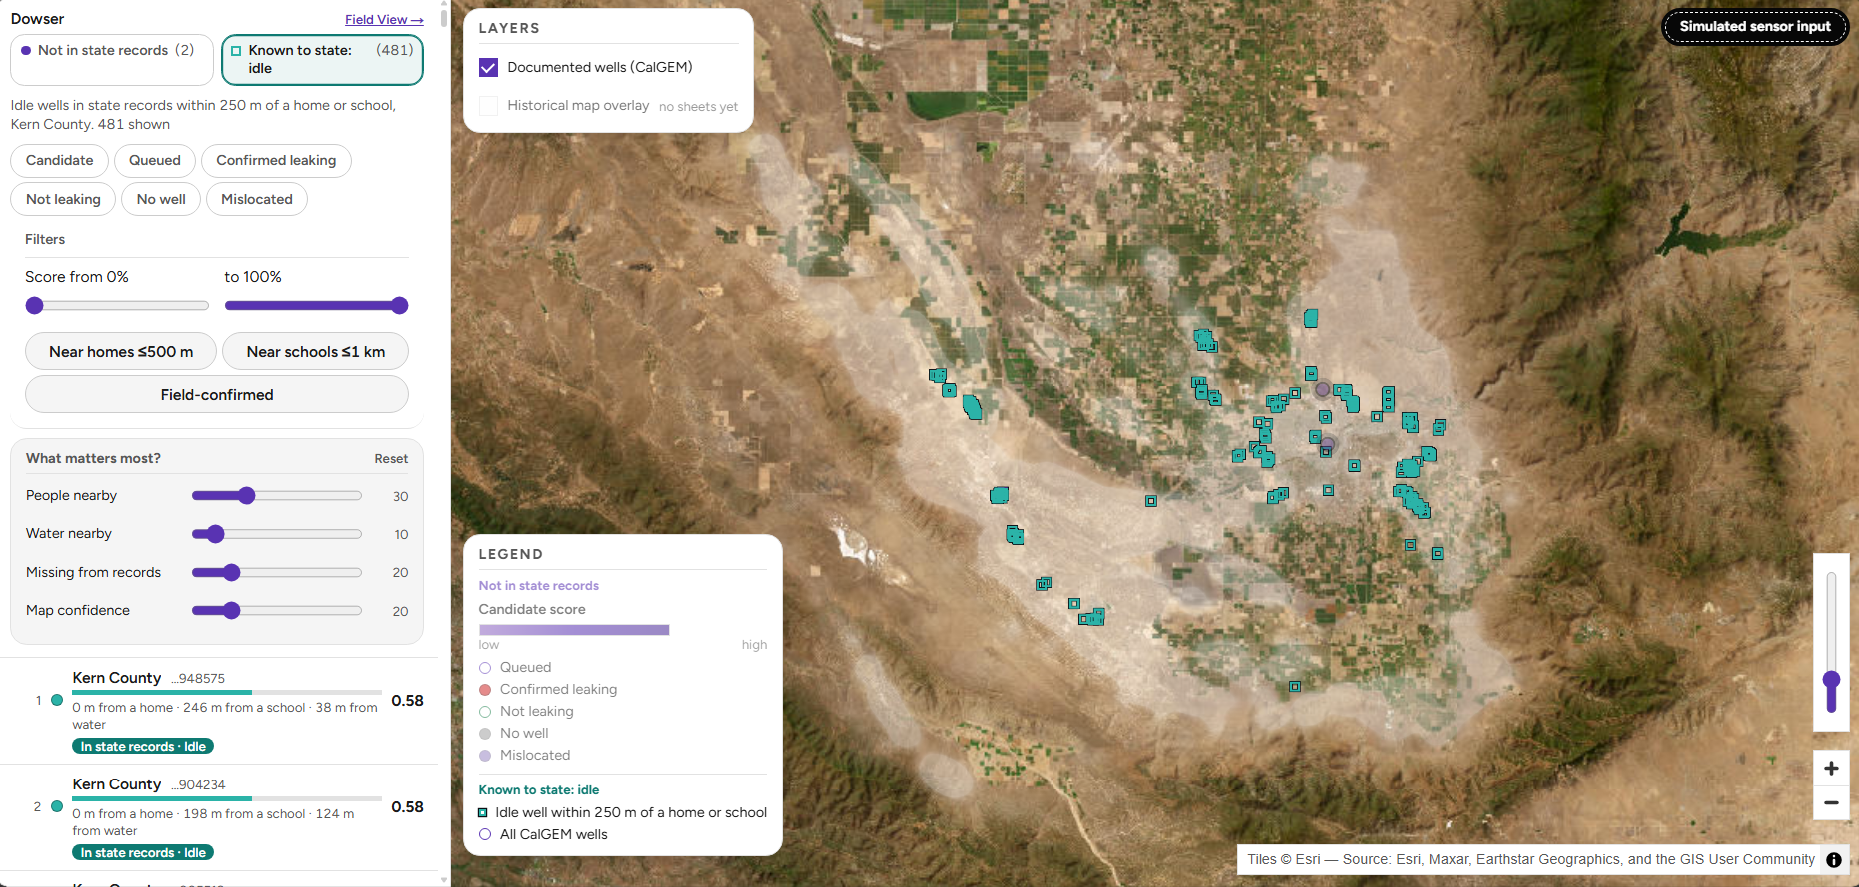
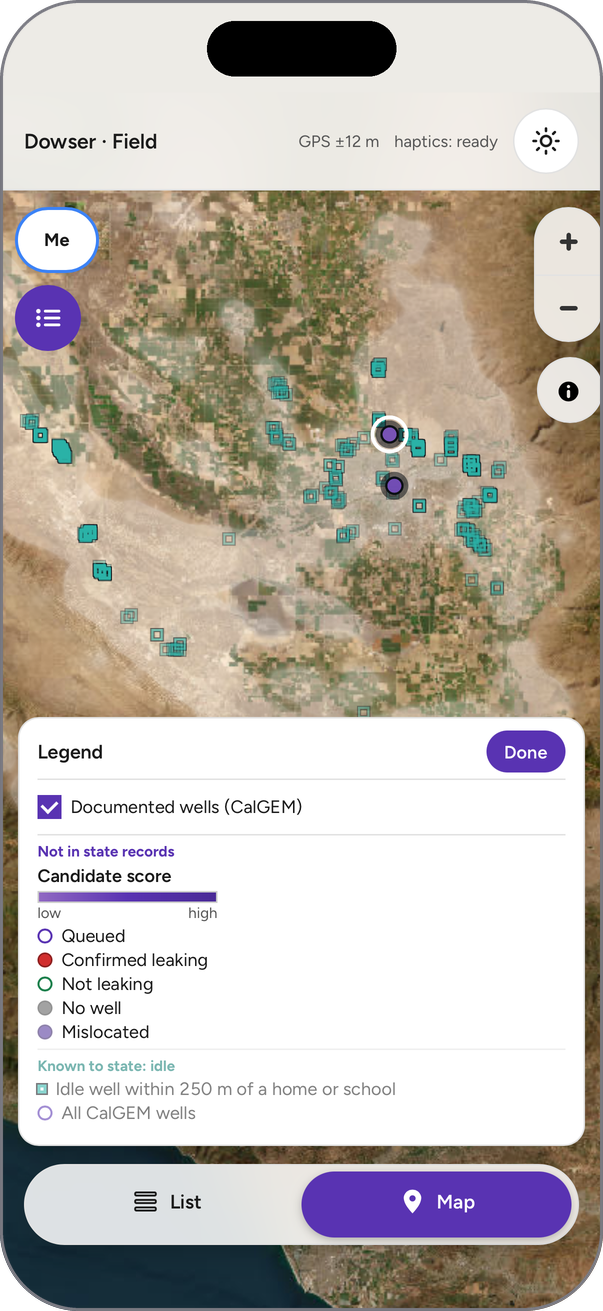
Legend, same as the Command Map.
-
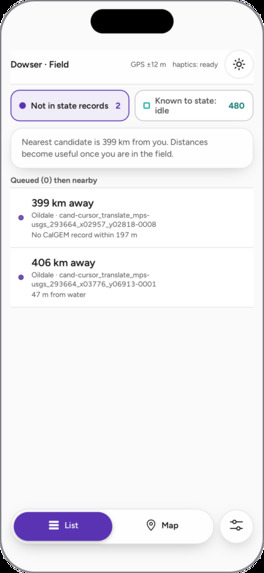
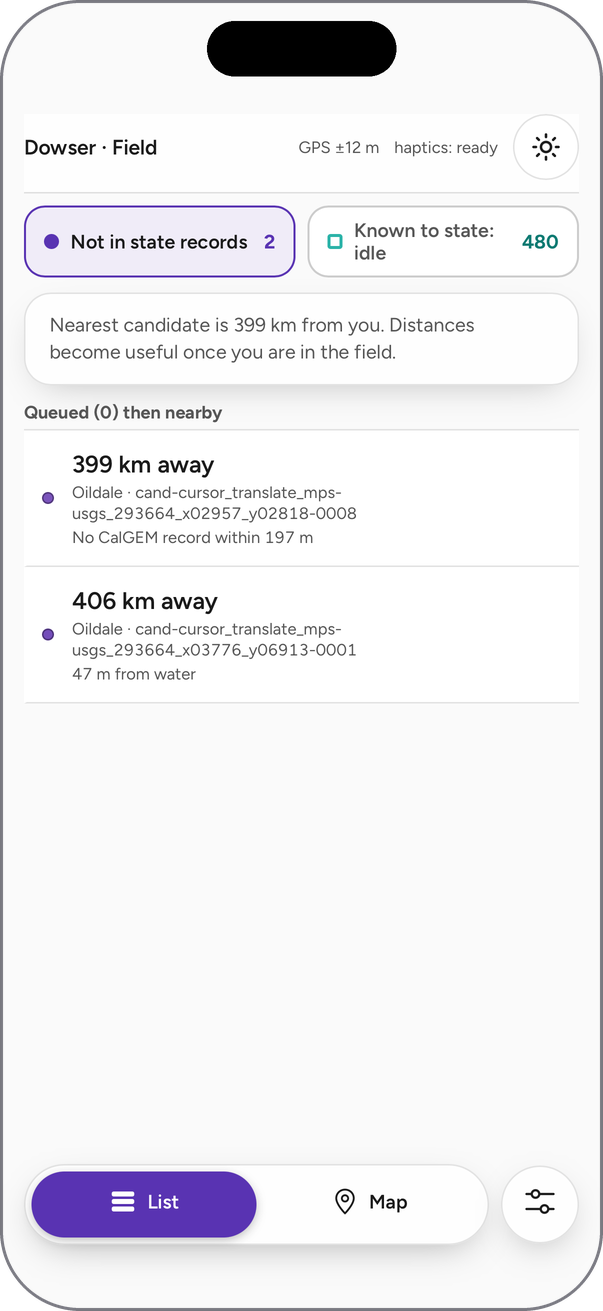
Candidate list, nearest first.
-
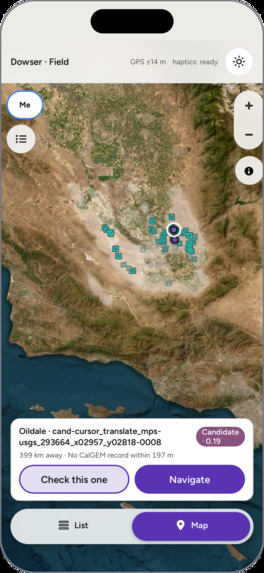
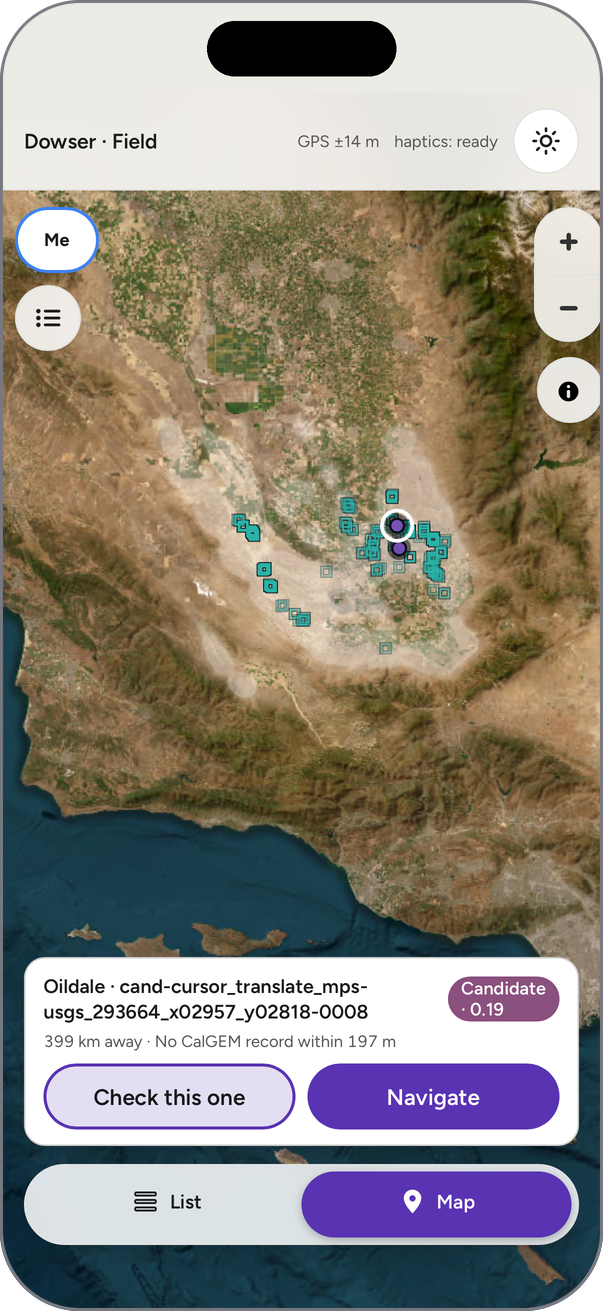
Map with the selected candidate.
Inspiration
Fourteen million Americans live within a mile of an oil or gas well that no one is responsible for. These orphaned wells, left behind by companies that went bankrupt or disappeared during oil booms dating back to the late 1800s, can leak methane and toxic gases into the air and groundwater for decades. About 120,000 are documented, but estimates suggest hundreds of thousands more were never recorded at all. Congress set aside $4.7 billion to find and plug them, but crews can't plug a well no one knows exists, and the best evidence of where many of them are is printed on maps that are nearly a century old.
We were inspired by the Lawrence Berkeley National Laboratory's research on finding undocumented wells with AI and historical maps. We wanted to connect that research to a practical workflow: turn map evidence into a location someone can investigate, show the surrounding terrain through satellite imagery, and bring field observations back to the same interface.
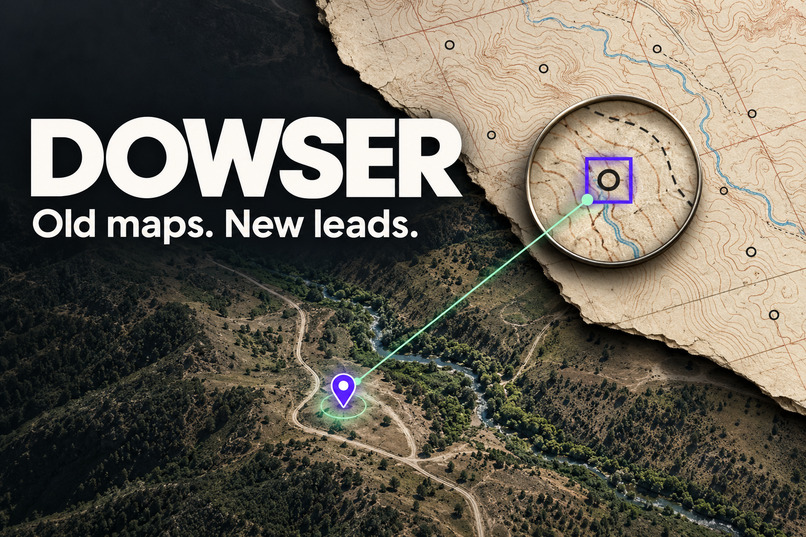
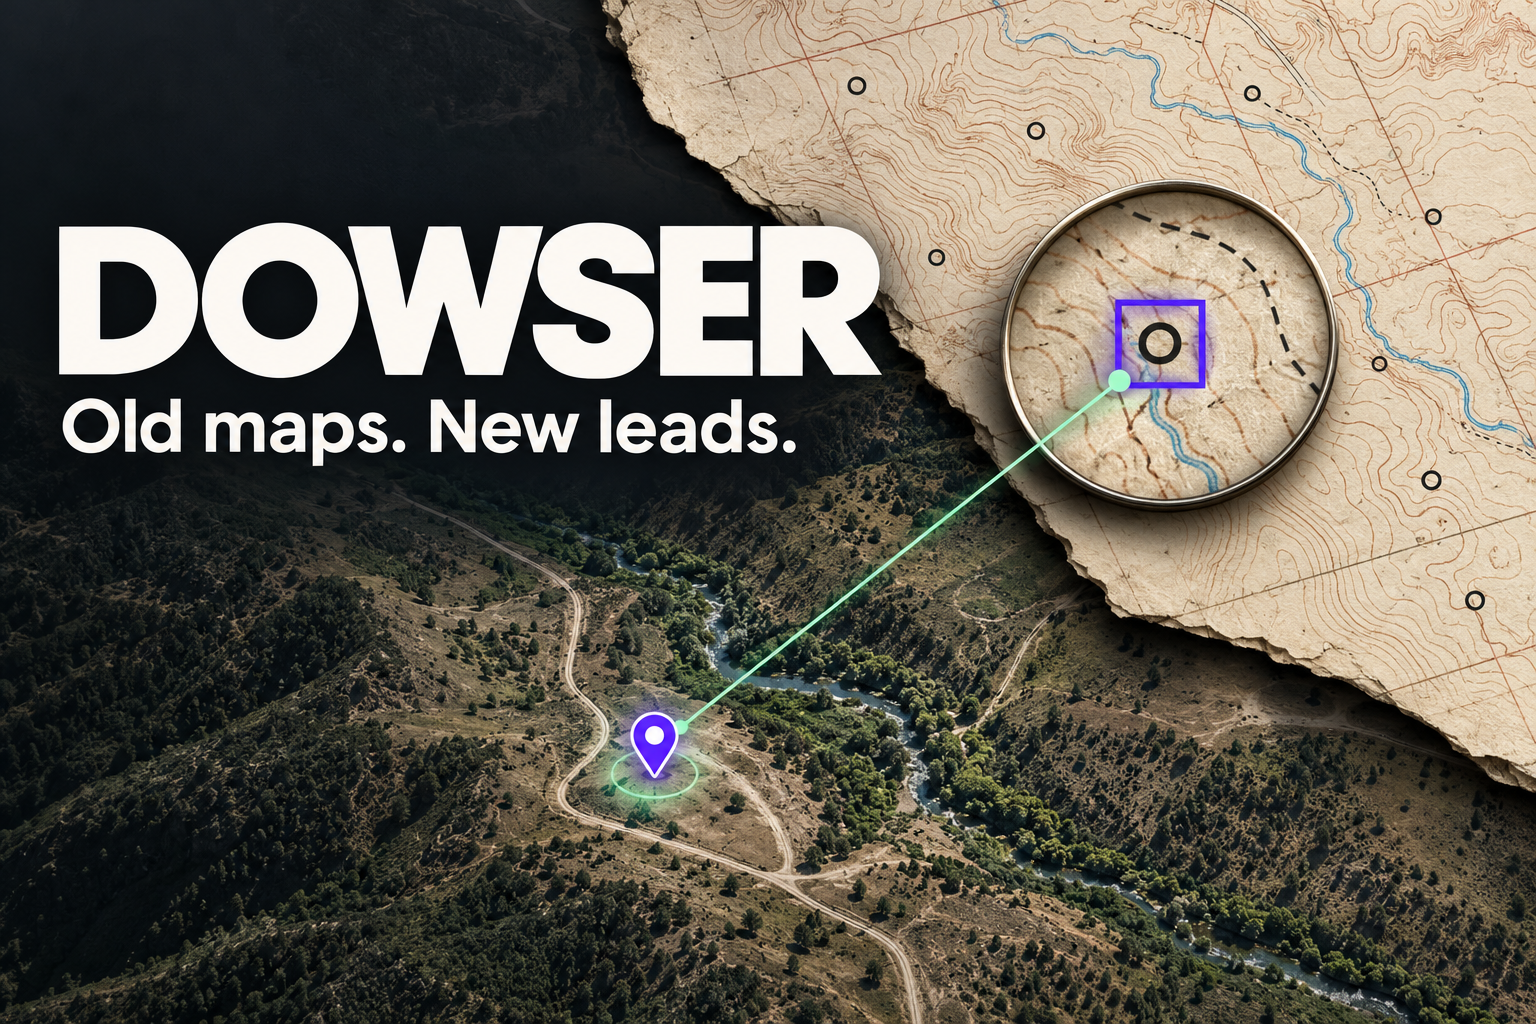
That became Dowser: old maps, new leads.
What it does
Dowser connects historical evidence, satellite imagery, state records, and field investigation, and ranks what it finds by risk to the people nearby.
- Identify possible well symbols on historical USGS maps using computer vision and human review.
- Convert their image coordinates into real geographic locations.
- Compare those locations with California's CalGEM well records (158,000+ wells).
- Flag locations with no state record within 100 m, and add context: distance to homes, schools, buildings, and water.
- Rank them with a transparent score that reviewers can re-weight live.
- Let crews queue sites and record field findings from a mobile interface.
Dowser keeps two lists separate:
- Not in state records: map symbols with no record nearby, each checked by a person. Verified symbols rank first, and rejected lookalikes stay visible, with the reason, in a collapsed section that can't be sent to a crew.
- Known to state: idle: wells the state lists as idle (not producing, not plugged) within 250 m of a home or school.
The desktop Command Map brings together satellite imagery, historical evidence crops, ranked locations, and a short Claude-written brief for each well. The mobile Field View (also an iOS app) pairs a handheld sensor with a selected well. Readings appear on both screens within seconds, and sustained high readings mark the well as leaking and move it to the top.
How we built it
We focused on Kern County, California, using three historical map editions spanning 1954 and 1992.
We prepared georeferenced GeoTIFFs as overlapping 1024-pixel tiles, preserving each tile's source map, year, coordinate system, and transform. We labeled symbols in Roboflow and fine-tuned a YOLO11n detector.
Our Python pipeline (GeoPandas, rasterio, pyproj) does five things:
- turns image-space boxes into latitude and longitude
- merges duplicates across tiles and editions
- compares each location with CalGEM records
- adds context from OpenStreetMap and Overture Maps building footprints
- computes all distances in true meters (California Albers)
We also prepared a reproducible export of 617 human-labeled symbol instances, with evidence crops and explicit manual-label provenance, which merges cleanly with the model's detections.
The app uses Next.js, React, MapLibre, and Convex. Convex runs the whole backend: the database, the endpoint the handheld posts to, auto-confirmation, device pairing, and live queries that update every screen instantly. Claude writes each brief from structured facts, with rules checked in code: no numbers that aren't in the data, and never calling a well "confirmed" unless a crew confirmed it.
The handheld is an ESP32 with an OLED screen that posts a reading every second. Flammable gas isn't allowed at the venue, so for the demo a potentiometer simulates the methane sensor's signal. Everything after the reading is the real system, and a gas sensor can be wired to the same pin.
Challenges we ran into
The hardest problem was distinguishing a well symbol from everything that resembles one. Old maps contain circular letters, water-well symbols, tanks, buildings, road markings, and printing artifacts, and our early detector confused several of these with oil and gas wells.
Good validation results didn't guarantee a useful candidate list. Of 1,657 unique symbols the model found, 96% landed within 100 m of a known well, which confirmed our coordinates were accurate. But of the 64 that didn't match, human review rejected 62 as lookalikes. So we evaluated the post-matching results directly, added difficult training examples, and kept human-labeled data explicitly separate from model predictions.
Georeferencing was another challenge: every crop, coordinate, map edition, and description needed to refer to the same source symbol.
With more time, we'd:
- train the detector to recognize lookalikes (water wells, landmarks, buildings) as their own classes, and use color, since USGS prints water wells in blue and oil wells in black
- require a symbol to appear on more than one edition before ranking it highly
- feed every human rejection back into training
- measure precision on the list crews actually work from
Accomplishments that we're proud of
- The full loop works live: historical symbol → record check → ranked lead → field reading → map update in seconds.
- Our map positions hold up: 536 of 537 hand-labeled wells match a state record within 100 m. The one that doesn't is the same well our model found and our review verified, found independently, 2 meters apart.
- 481 idle wells within 250 m of a home or school (76 near schools), ranked for crews.
- Honesty is built into the product: rejected detections stay visible, and the simulated sensor is labeled on screen.
What we learned
Reliable AI products depend on the entire data pipeline. Model scores, geographic proximity, and field findings answer different questions. A historical symbol is evidence to investigate; an unmatched database record does not establish an undocumented well. Preserving provenance and exposing uncertainty became central design decisions.
What's next
We want to:
- complete independent testing
- improve recognition across map styles and eras
- add a persistent review gate before publishing candidates
- validate the handheld in the field with a real gas sensor
- expand beyond two quadrangles
Our goal is to help crews move from a promising historical clue to a documented, defensible investigation.

Log in or sign up for Devpost to join the conversation.