Downstream
Inspiration
Two of us have family who still fish the same rivers they grew up on. Factories moved in upstream, and no one ever told them what that did to the fish they were feeding their families. The data existed, but it was buried across federal databases, years out of date. The people who needed it most never saw it.
The focus is usually on water quality, but fish are the real hidden problem. One serving of freshwater fish delivers PFAS exposure equivalent to drinking contaminated water for an entire month (Barbo et al., 2023). The water tests "safe" while the fish are dangerous.
The people most at risk are invisible to current advisory systems. Subsistence fishers, often from disproportionately low-income communities, consume fish at 8x the rate EPA uses to set "safe" limits. State fish advisories take 2–4 years to update after contamination events. In the interim, people eat contaminated fish with no warning.
What It Does
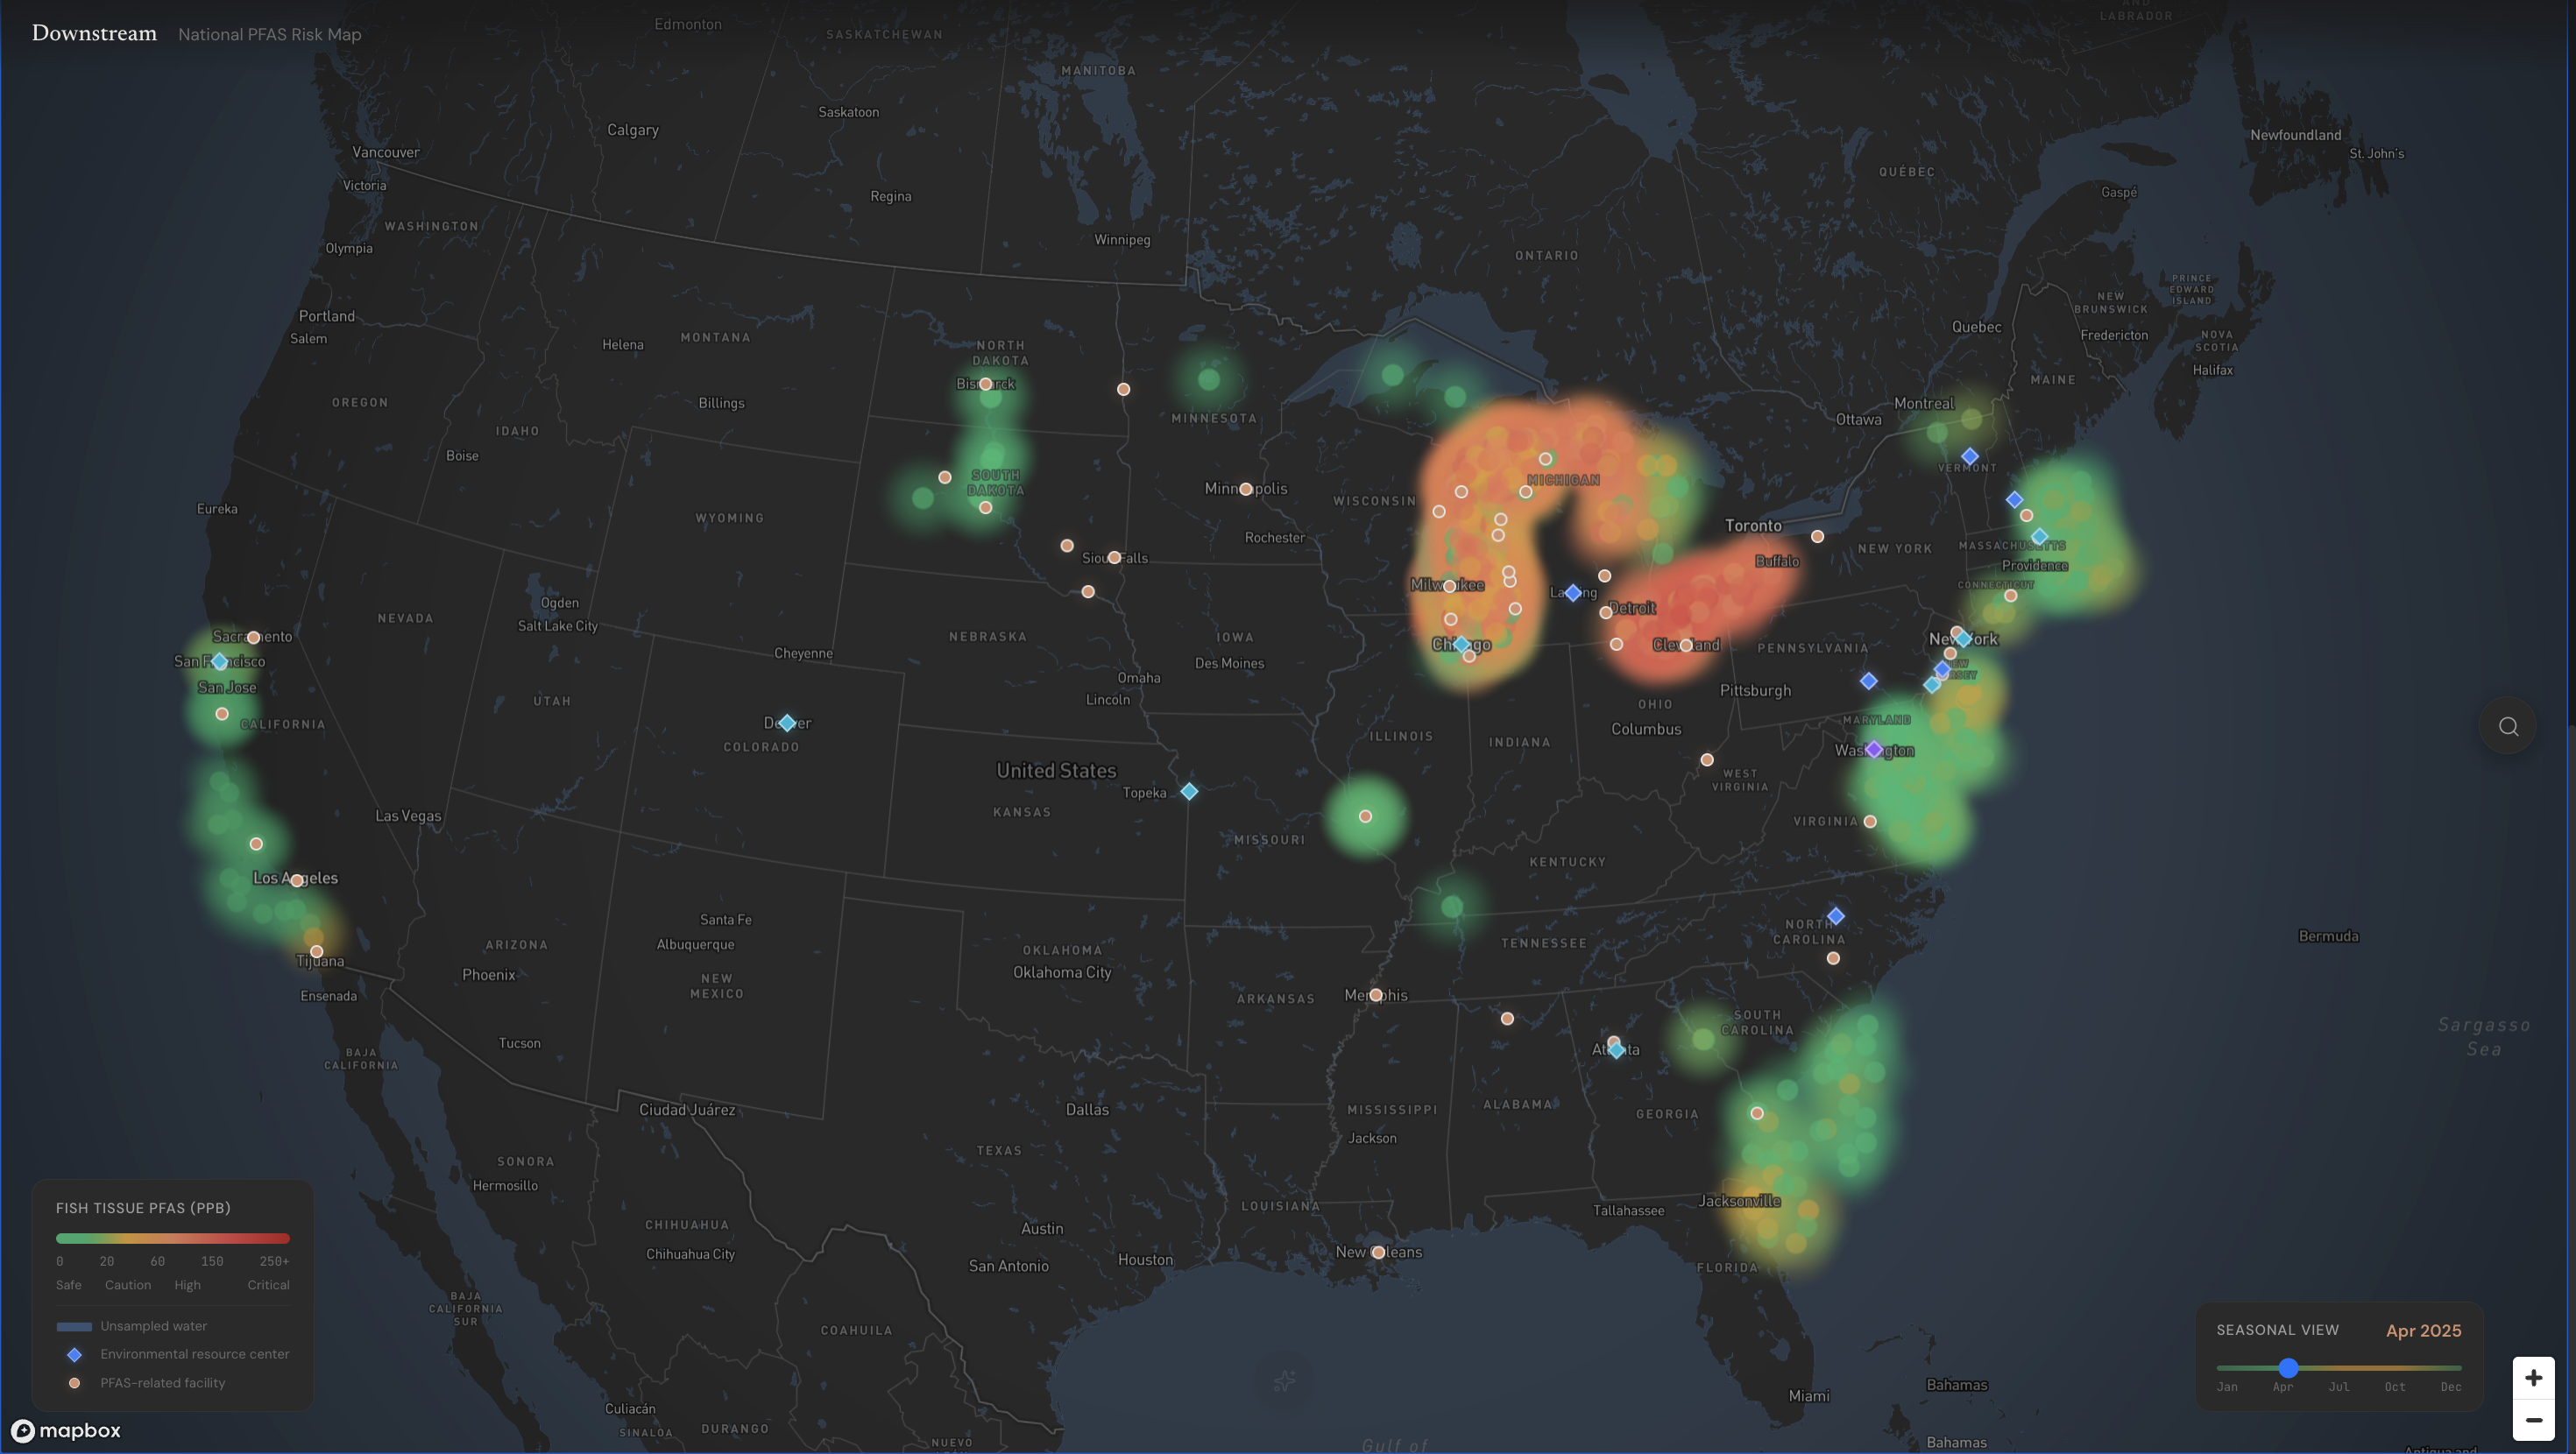
Downstream traces PFAS from factory discharge to predicted fish tissue contamination to personalized human exposure risk, visualized on an interactive map of the continental United States.
A user clicks any waterway and instantly sees:
- How contaminated the water is, predicted from real EPA monitoring data and landscape features
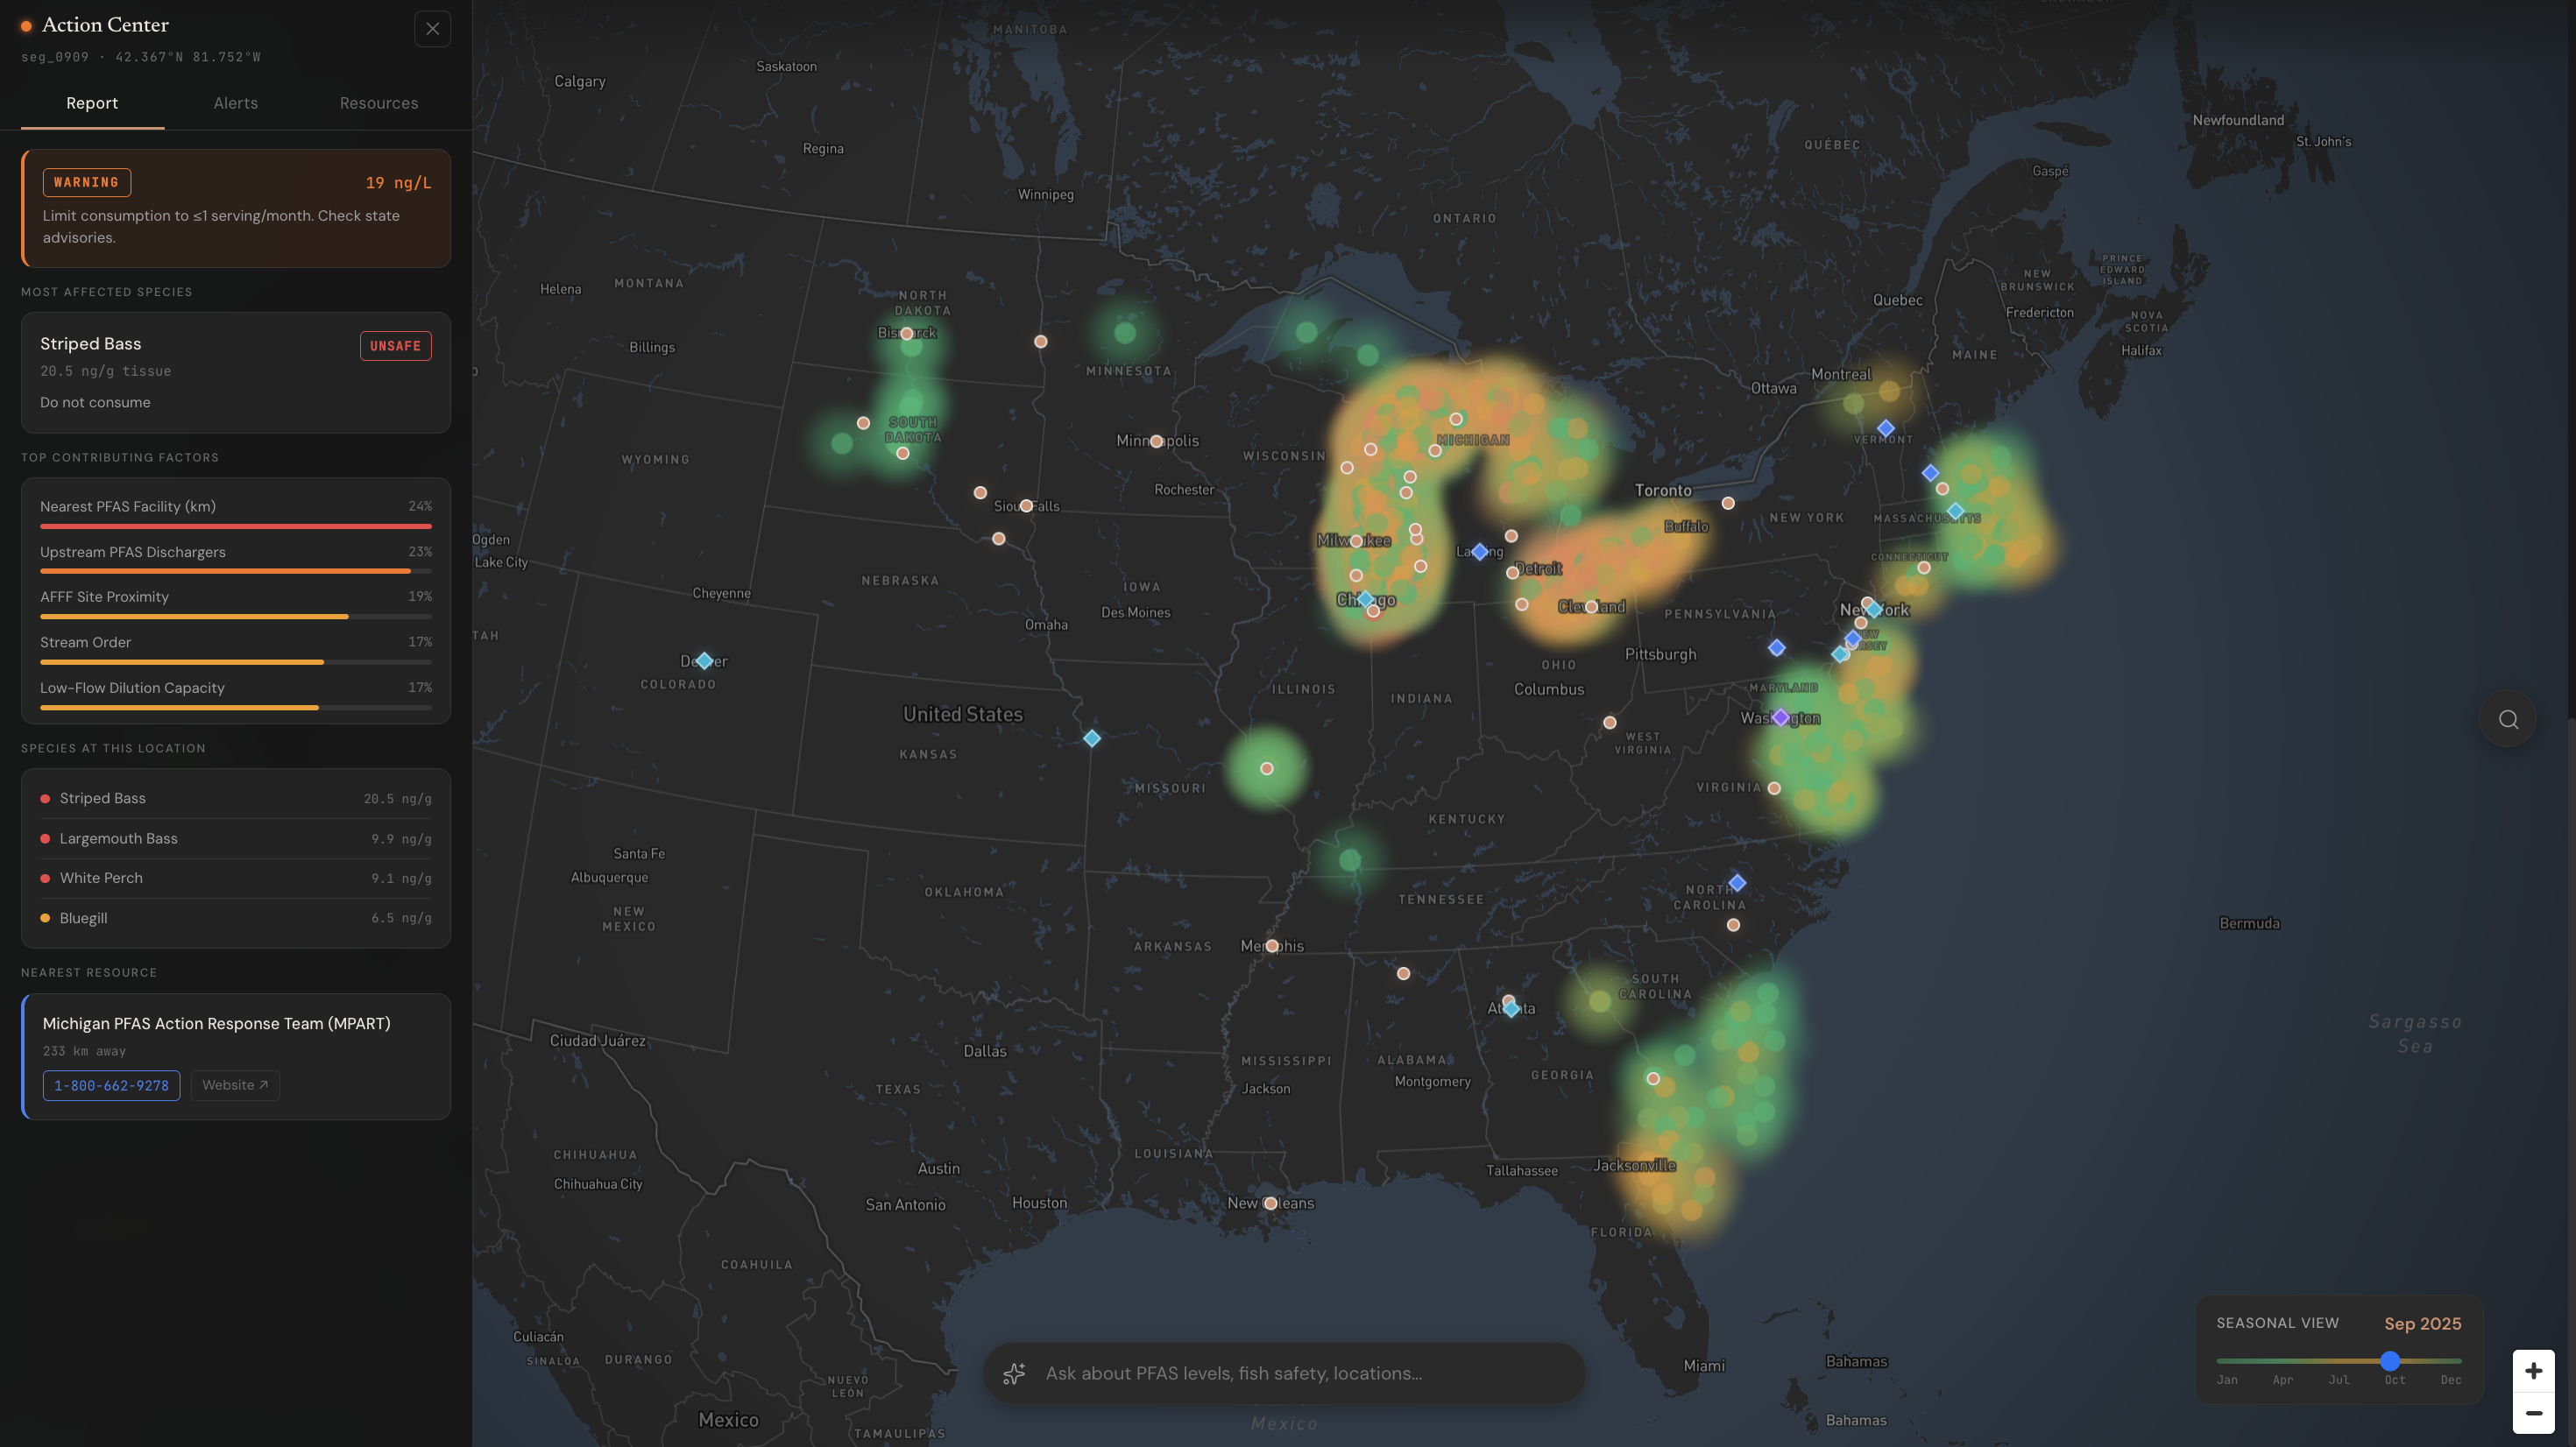
- Which fish species are safe and which aren't, modeled species-by-species using aquatic bioaccumulation physics
- The exposure gap, shown where a recreational angler may be safe while a subsistence fisher at the same location faces 2–3x the EPA reference dose
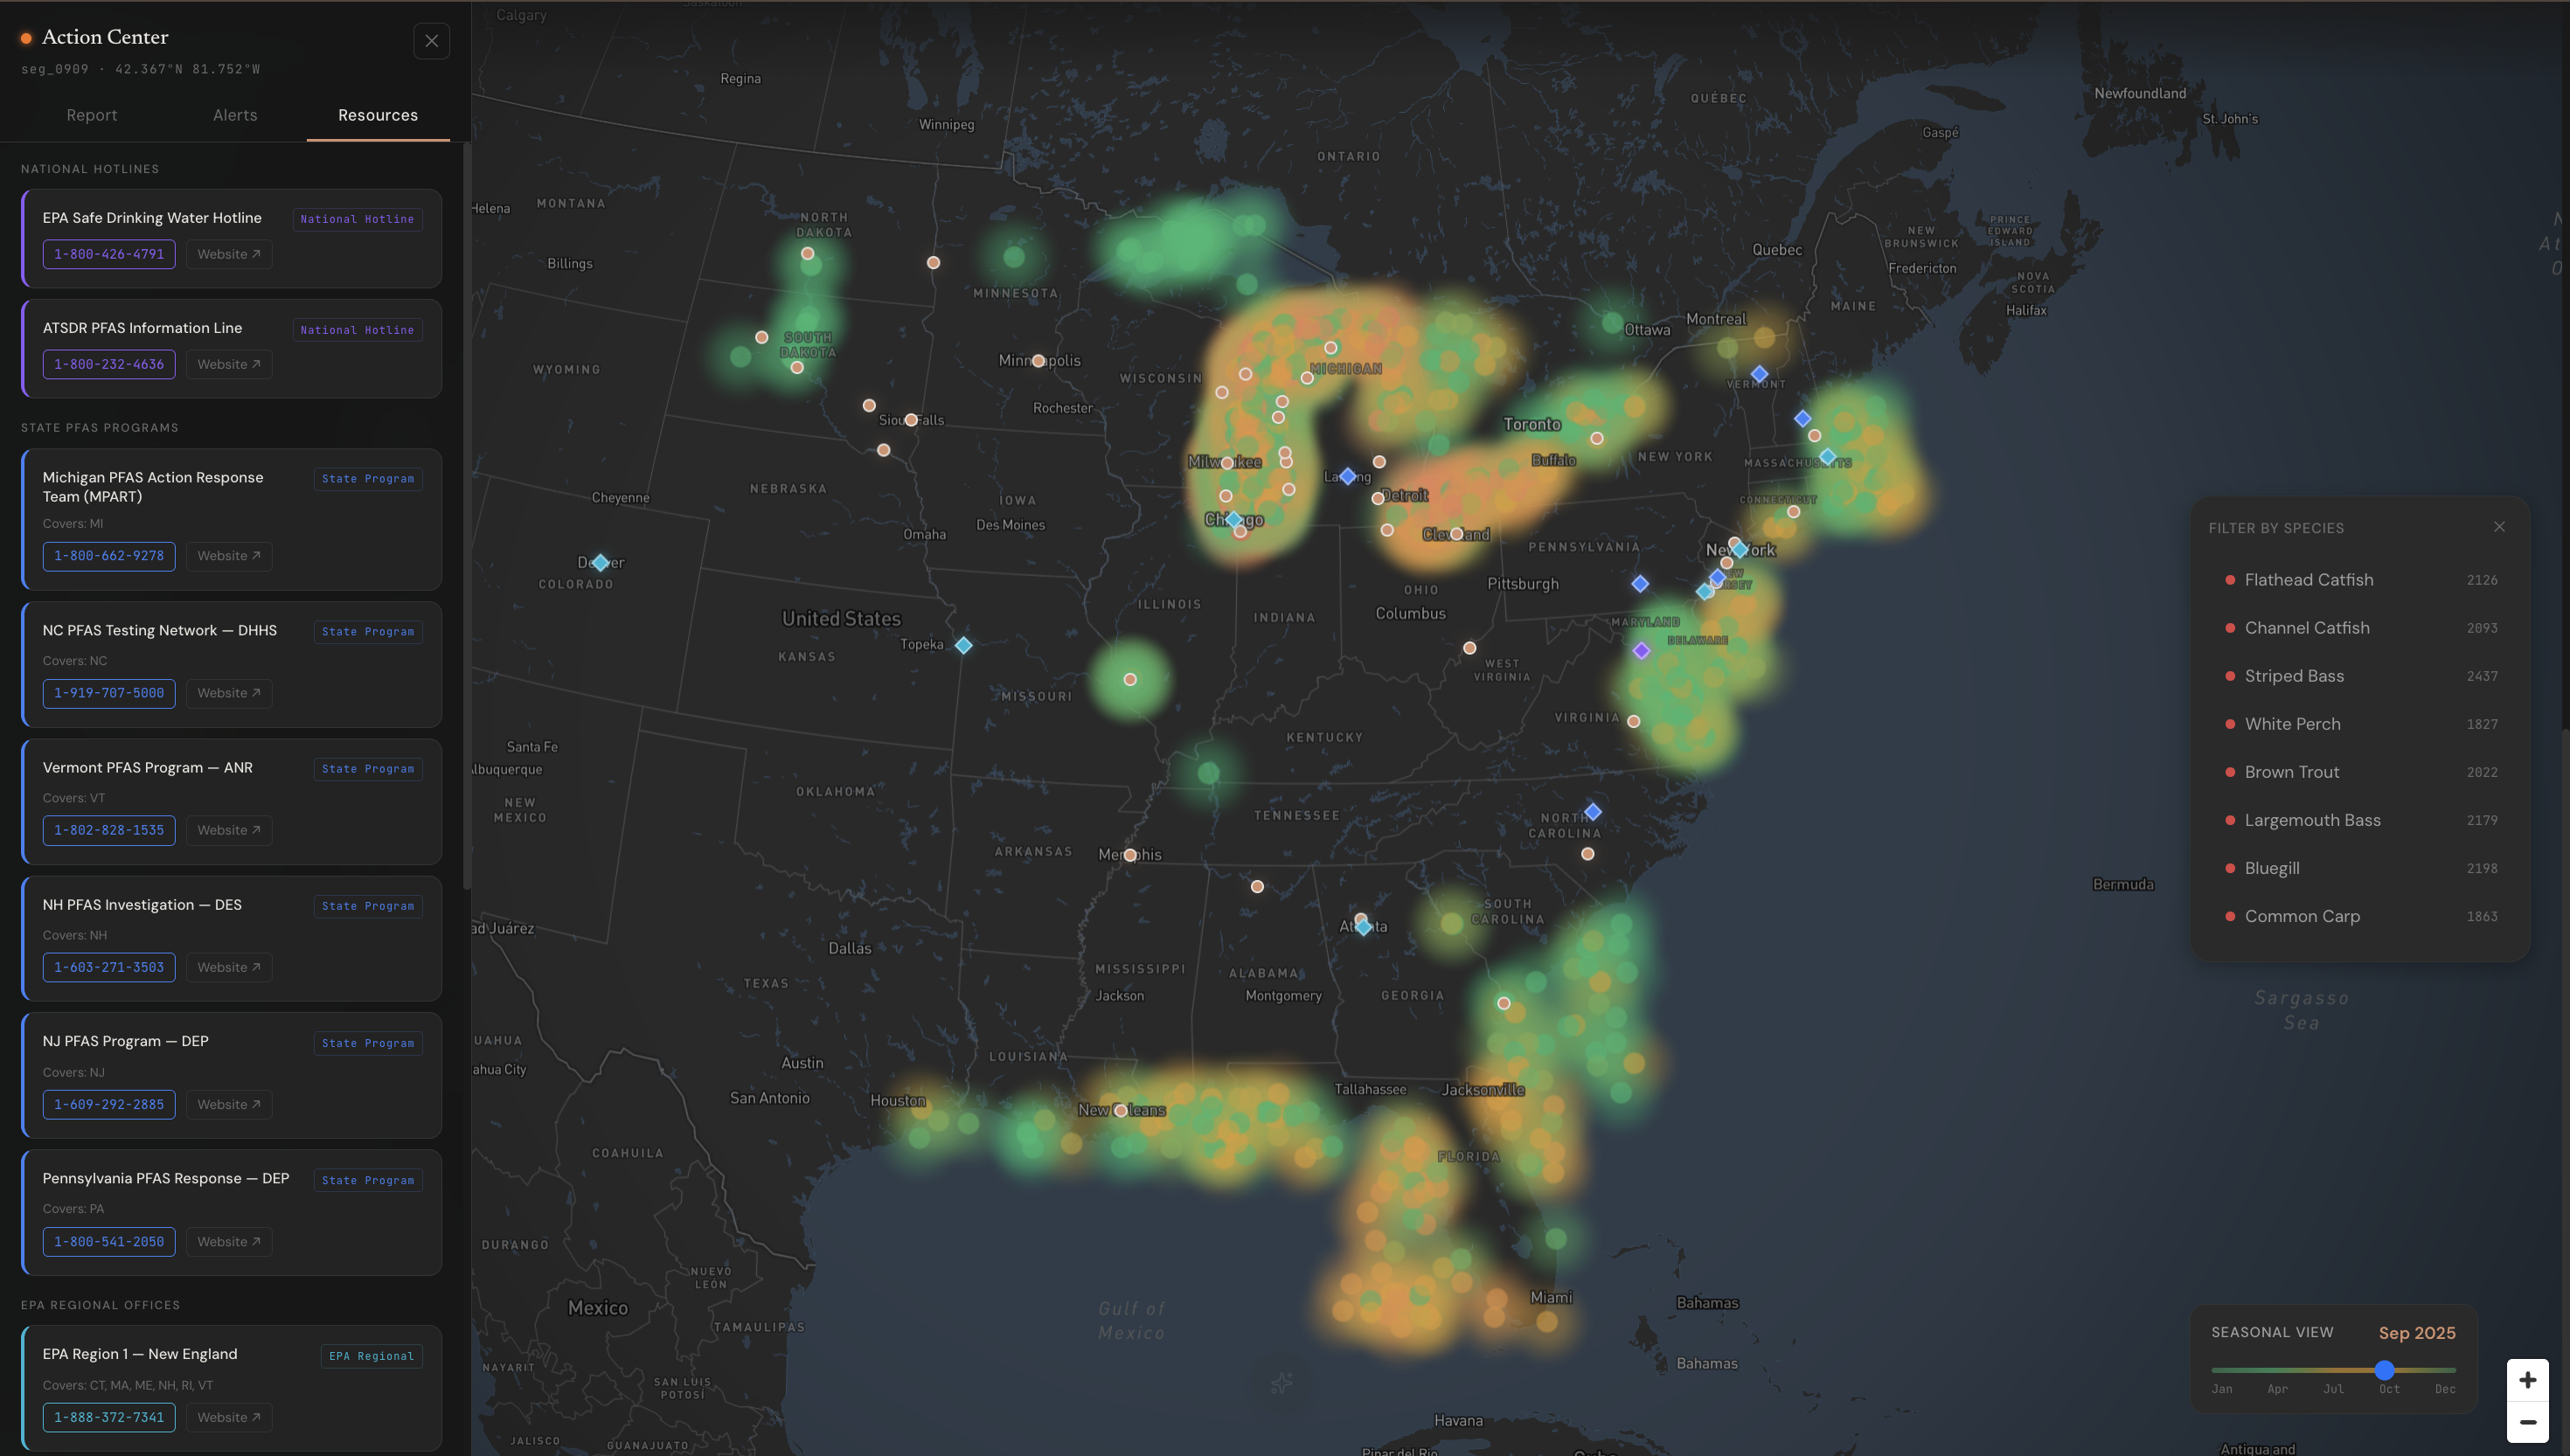
- Nearest EPA offices, state PFAS programs, and hotlines for taking action
- A seasonal slider showing monthly contamination shifts, including the documented decline in Great Lakes fish tissue PFAS over the past year
How We Built It
We first read scientific literature, including current mathematical models, their drawbacks, and identified promising models to start. We ended up with the following pipeline:
Stage 1: Water PFAS Screening
A gradient boosted regression model trained on 2,131 real EPA Water Quality Portal measurements (2003–2025). Features include facility proximity, stream flow, stream order, land cover, and engineered features like facility-flow ratio (contamination load vs. dilution capacity). GroupKFold CV by monitoring station prevents data leakage. CV R² = 0.778.
Stage 2: Fish Tissue Bioaccumulation
A physics-informed neural network trained on 50,000 samples from the Gobas (1993) bioaccumulation ODE. The loss function enforces three physical constraints: monotonicity with trophic level and lipid content, ODE residual consistency at thousands of collocation points per batch, and data fit on log-transformed concentrations. Grounded to field-measured BAFs from Burkhard (2021). MC Dropout provides 95% confidence intervals. R² = 0.90, 93% within factor of 2. Trained with the provided ASUS supercomputer.
Stage 3: Human Health Risk
EPA hazard quotient assessment for both recreational (17 g/day) and subsistence (142.4 g/day) consumption rates across all 6 congeners. Outputs safe servings per month per species per location.
Challenges We Ran Into
PINN calibration overshoot. The raw PINN overestimated tissue concentrations 25–30× vs. published values. It learned the ODE dynamics correctly but at the wrong scale. We fixed this by grounding predictions to field-measured bioaccumulation factors via log-linear interpolation, preserving uncertainty structure while anchoring to real data.
Visualizing contamination at scale. 3,357 points on a map: unreadable scatter at country zoom, invisible dots at river zoom. We built three-tier zoom-adaptive rendering with cross-fading, plus an 8-stop nonlinear heatmap weight ramp.
Accomplishments We're Proud Of
We built a three-stage ML pipeline in under 24 hours that enforces real bioaccumulation physics via automatic differentiation, not just curve-fitting. The environmental justice module also quantifies something existing advisories often ignore: the fact that the same fish, at the same location, can be safe for one person and dangerous for another depending on how much they eat. Furthermore, our work is easily scalable to the global stage, especially with the ASUS supercomputer, offering live inference and instant insights to environmental changes.
What We Learned
Physics-informed neural networks are powerful when validated mechanistic models exist but are too rigid for real-time inference. The Gobas ODE captures decades of aquatic toxicology, and the PINN makes it queryable in milliseconds. We also learned that environmental data is brutally noisy: PFAS at the same station can vary 10x between sampling events. Feature engineering matters more than model complexity when signal-to-noise is low.
What's Down the Stream for Downstream
- Expand facility coverage. EPA's full PFAS Analytic Tools database has ~3,000+ facilities. We currently use 49.
- Real fish tissue validation. Partner with state agencies to validate predictions against actual tissue samples, with the ground truth that closes the loop.
- Tribal nation deployment. To respect Tribal data sovereignty, we designed our downstream application to run entirely offline. By leveraging the provided ASUS supercomputer, Tribal departments can run our heavy neural networks strictly on-premise, keeping sensitive environmental data safe and completely off the cloud.
- Live advisory updates. Connect to live WQP feeds for rolling advisories, eliminating the 2–4 year lag.
Built With
Python, PyTorch, scikit-learn, FastAPI, React, Vite, Mapbox GL, EPA Water Quality Portal, EPA ECHO/TRI, USGS NWIS, NHDPlus, GBIF, FishBase


Log in or sign up for Devpost to join the conversation.