-
-
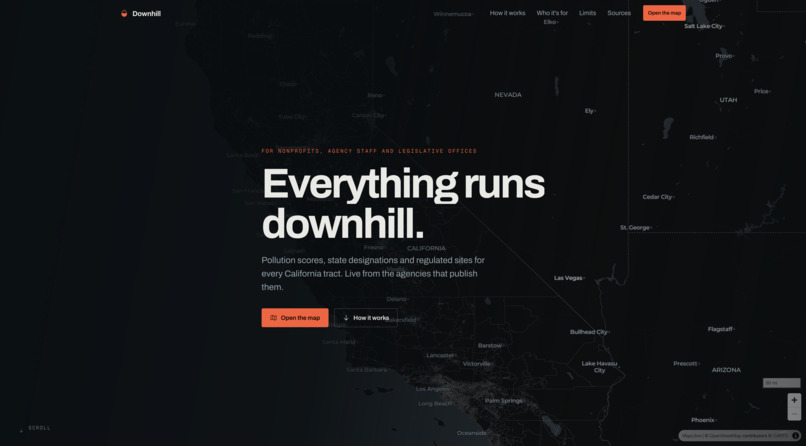
Landing page
-
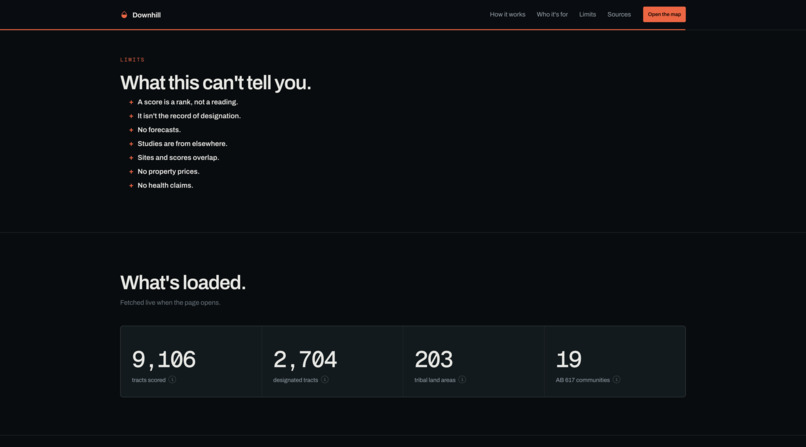
Claims about the data
-
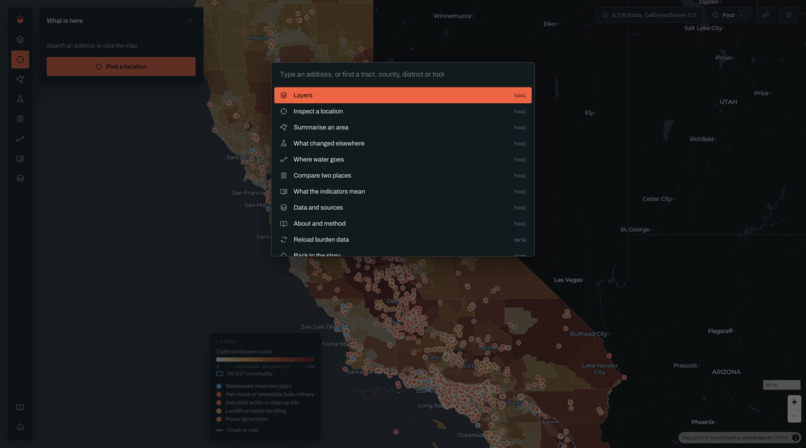
Search menu
-
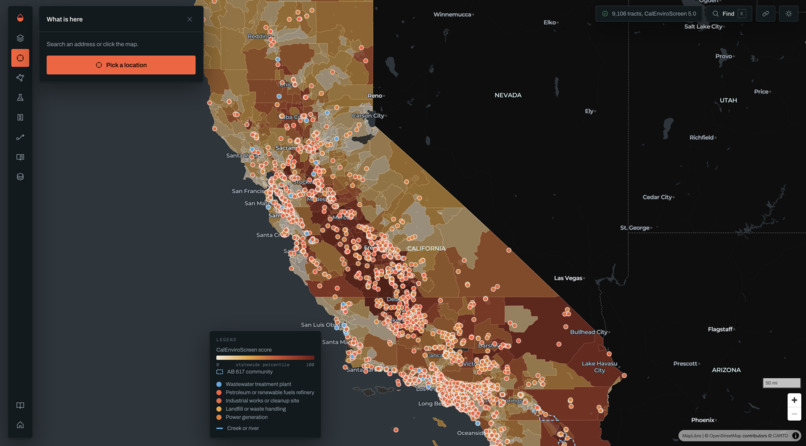
Open map view
-
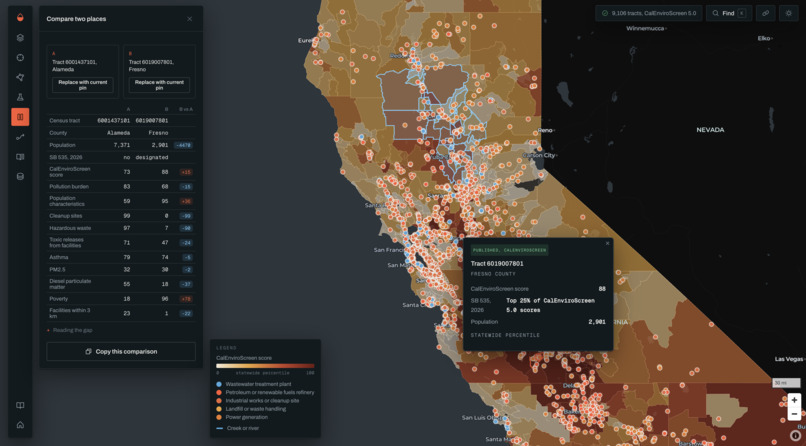
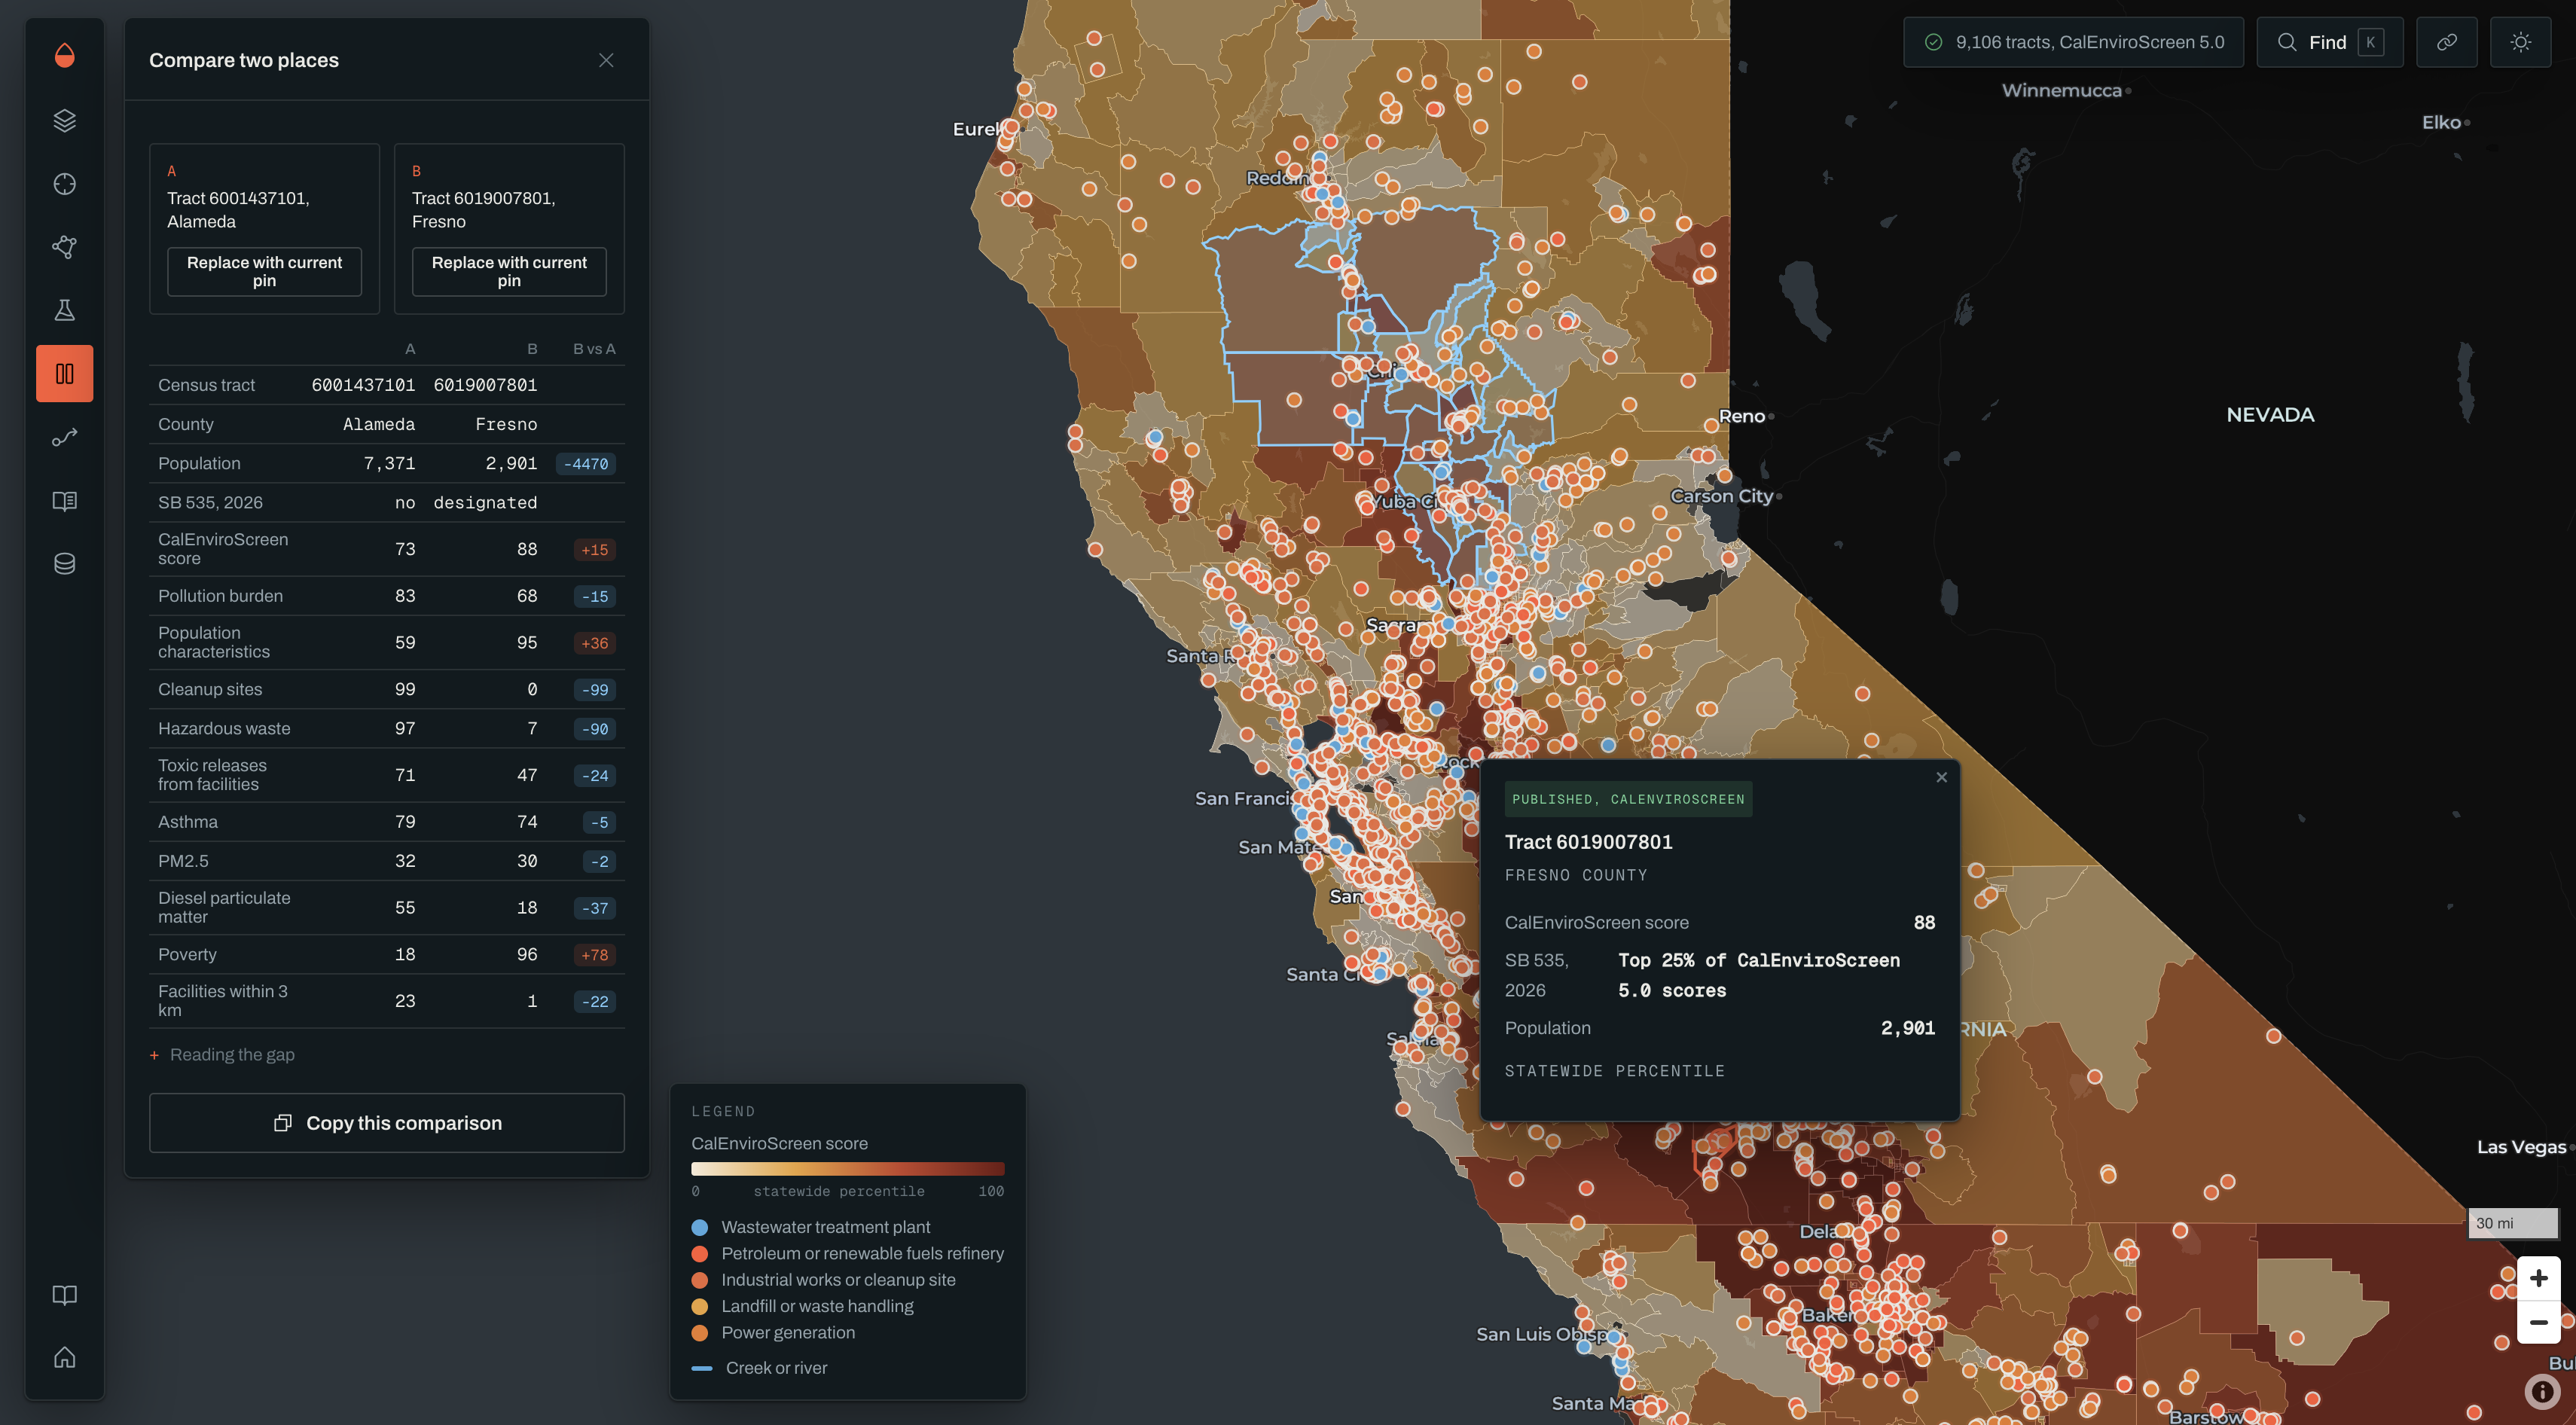
Comparing two areas
-
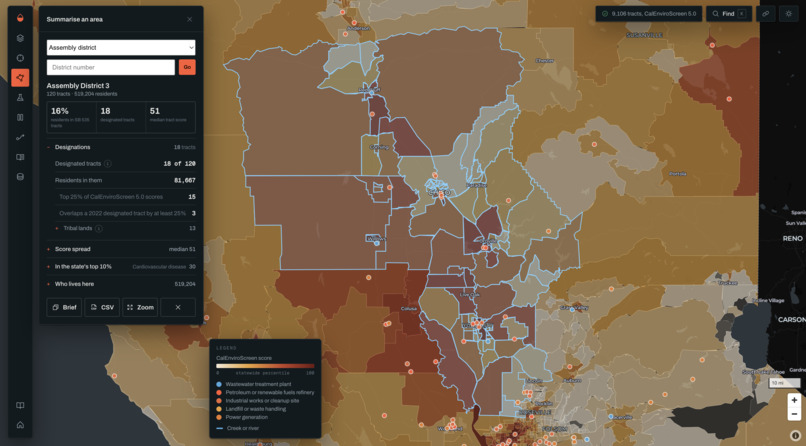
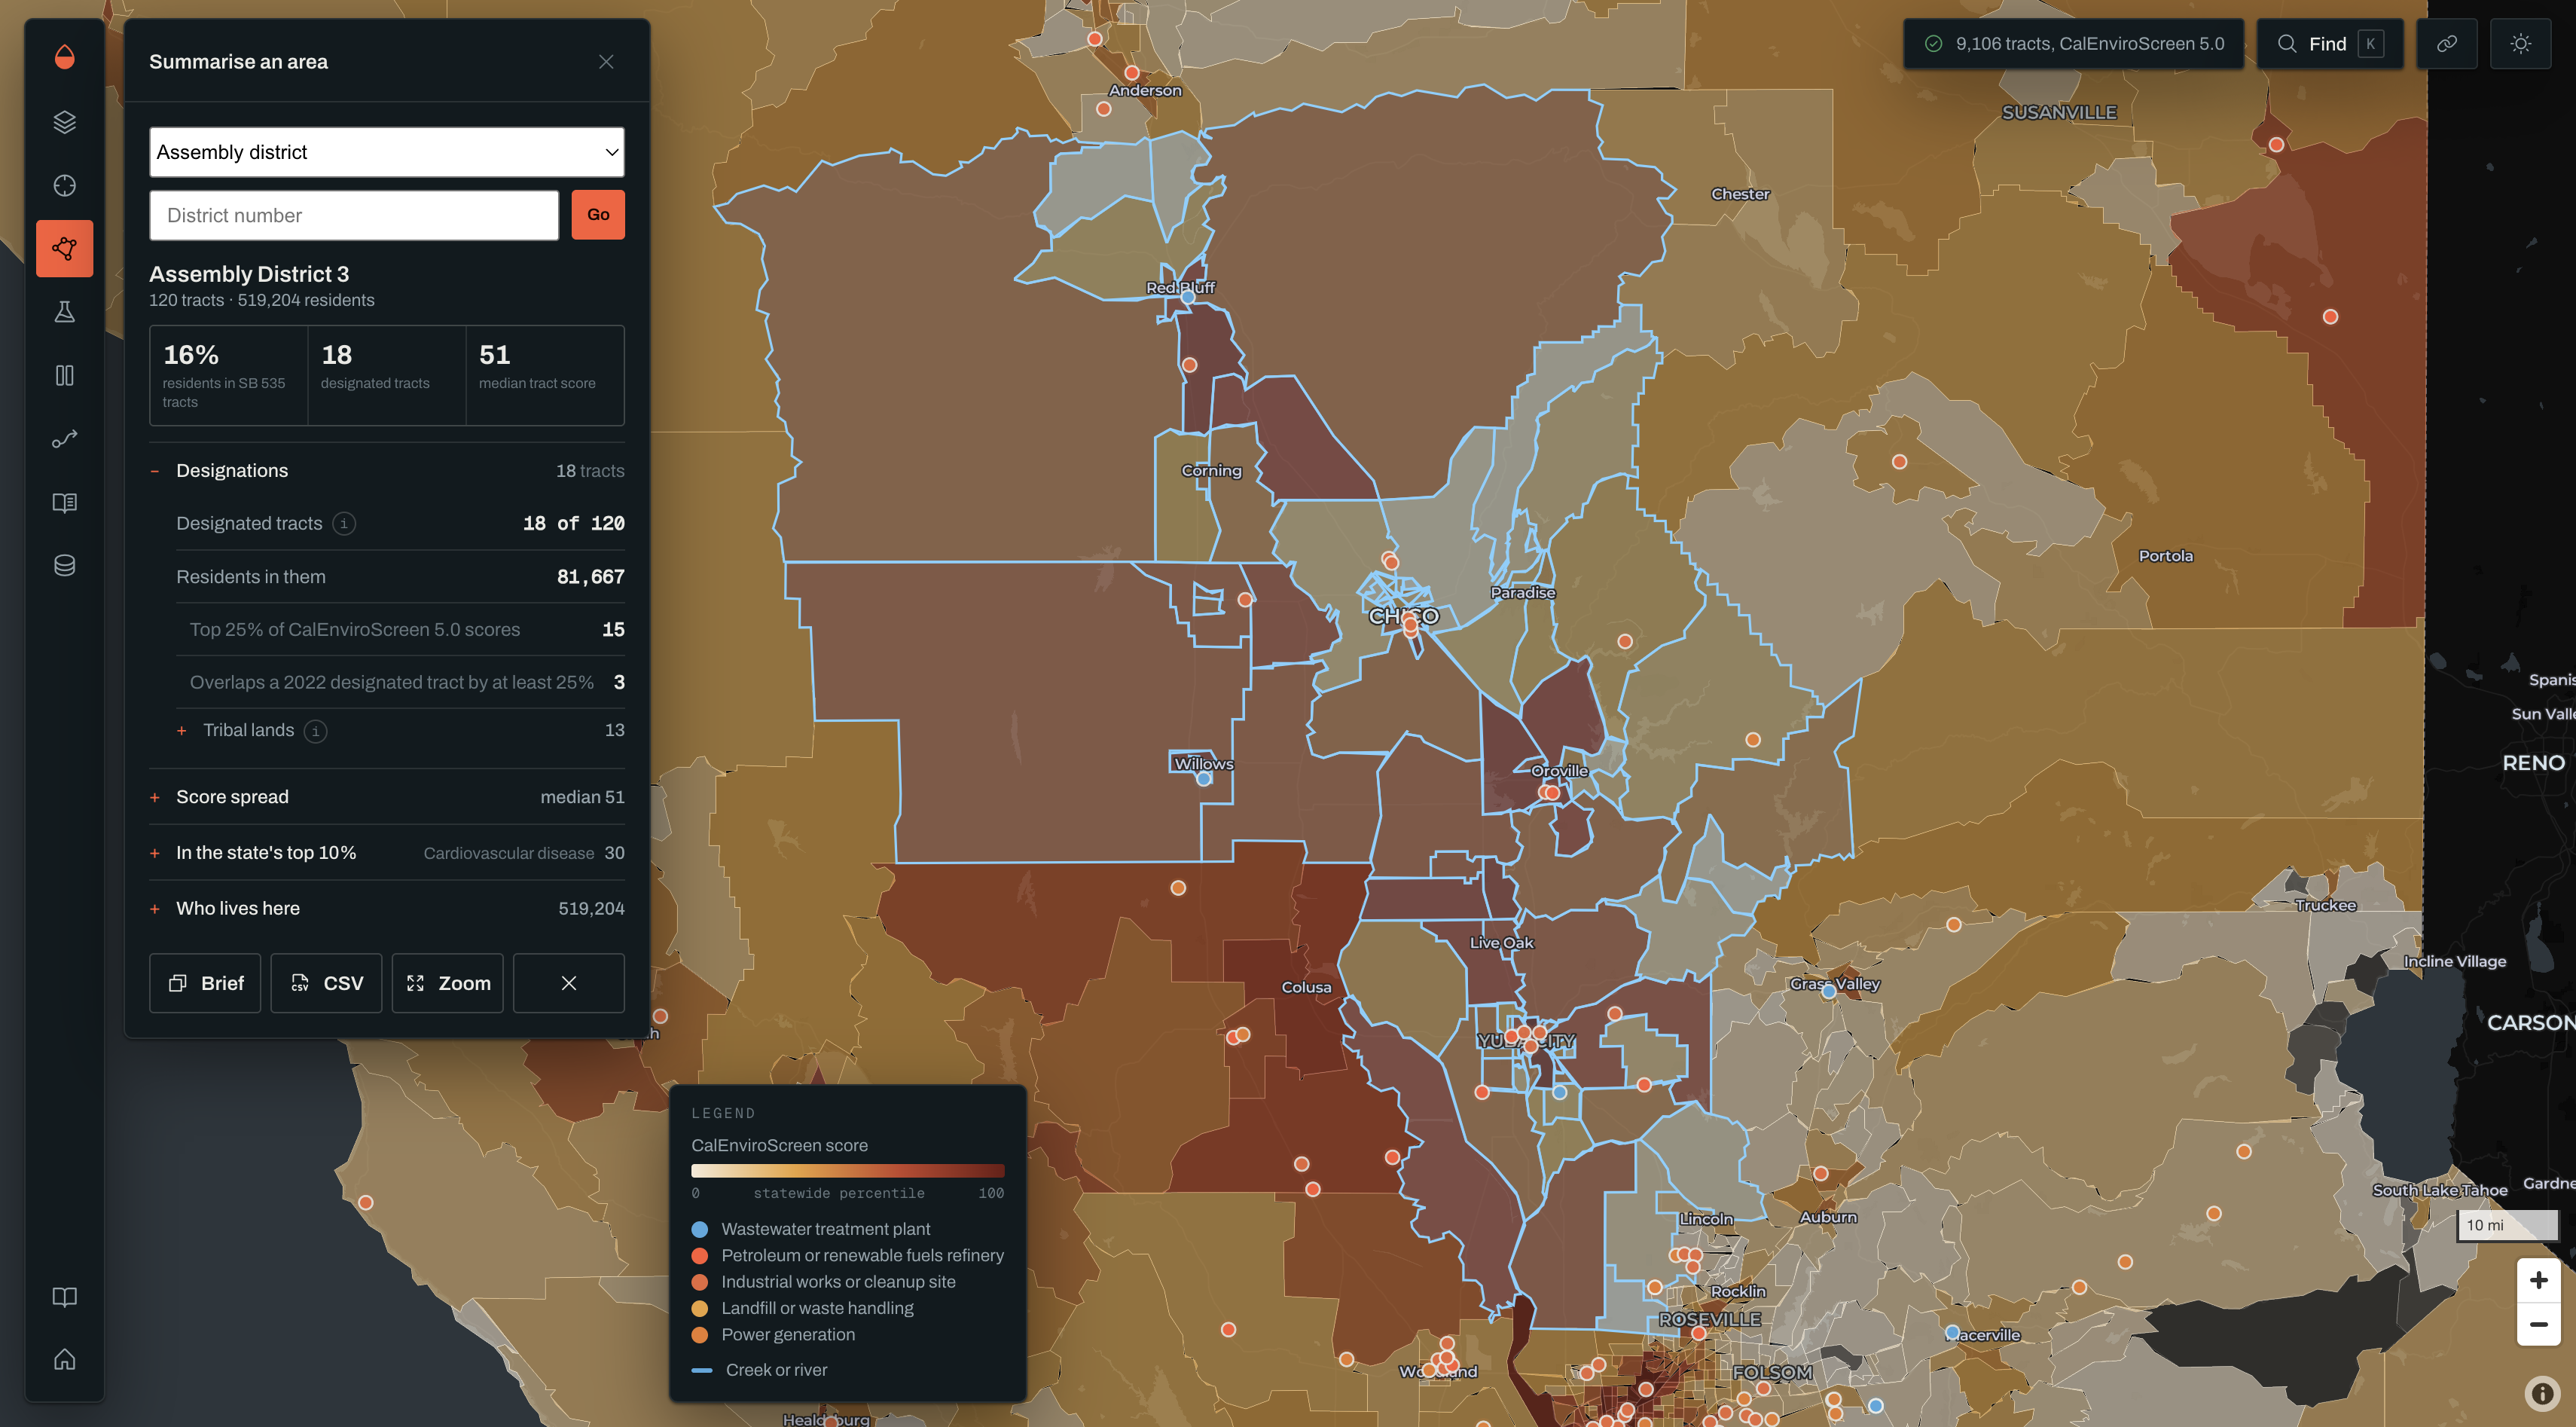
Identifying and characterizing a district
-
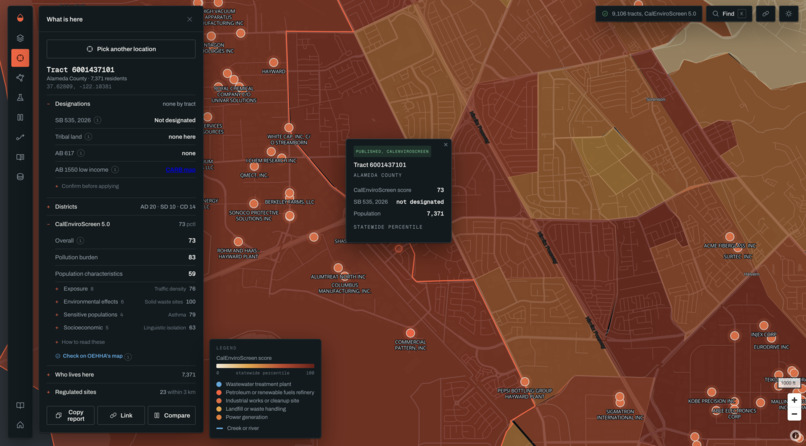
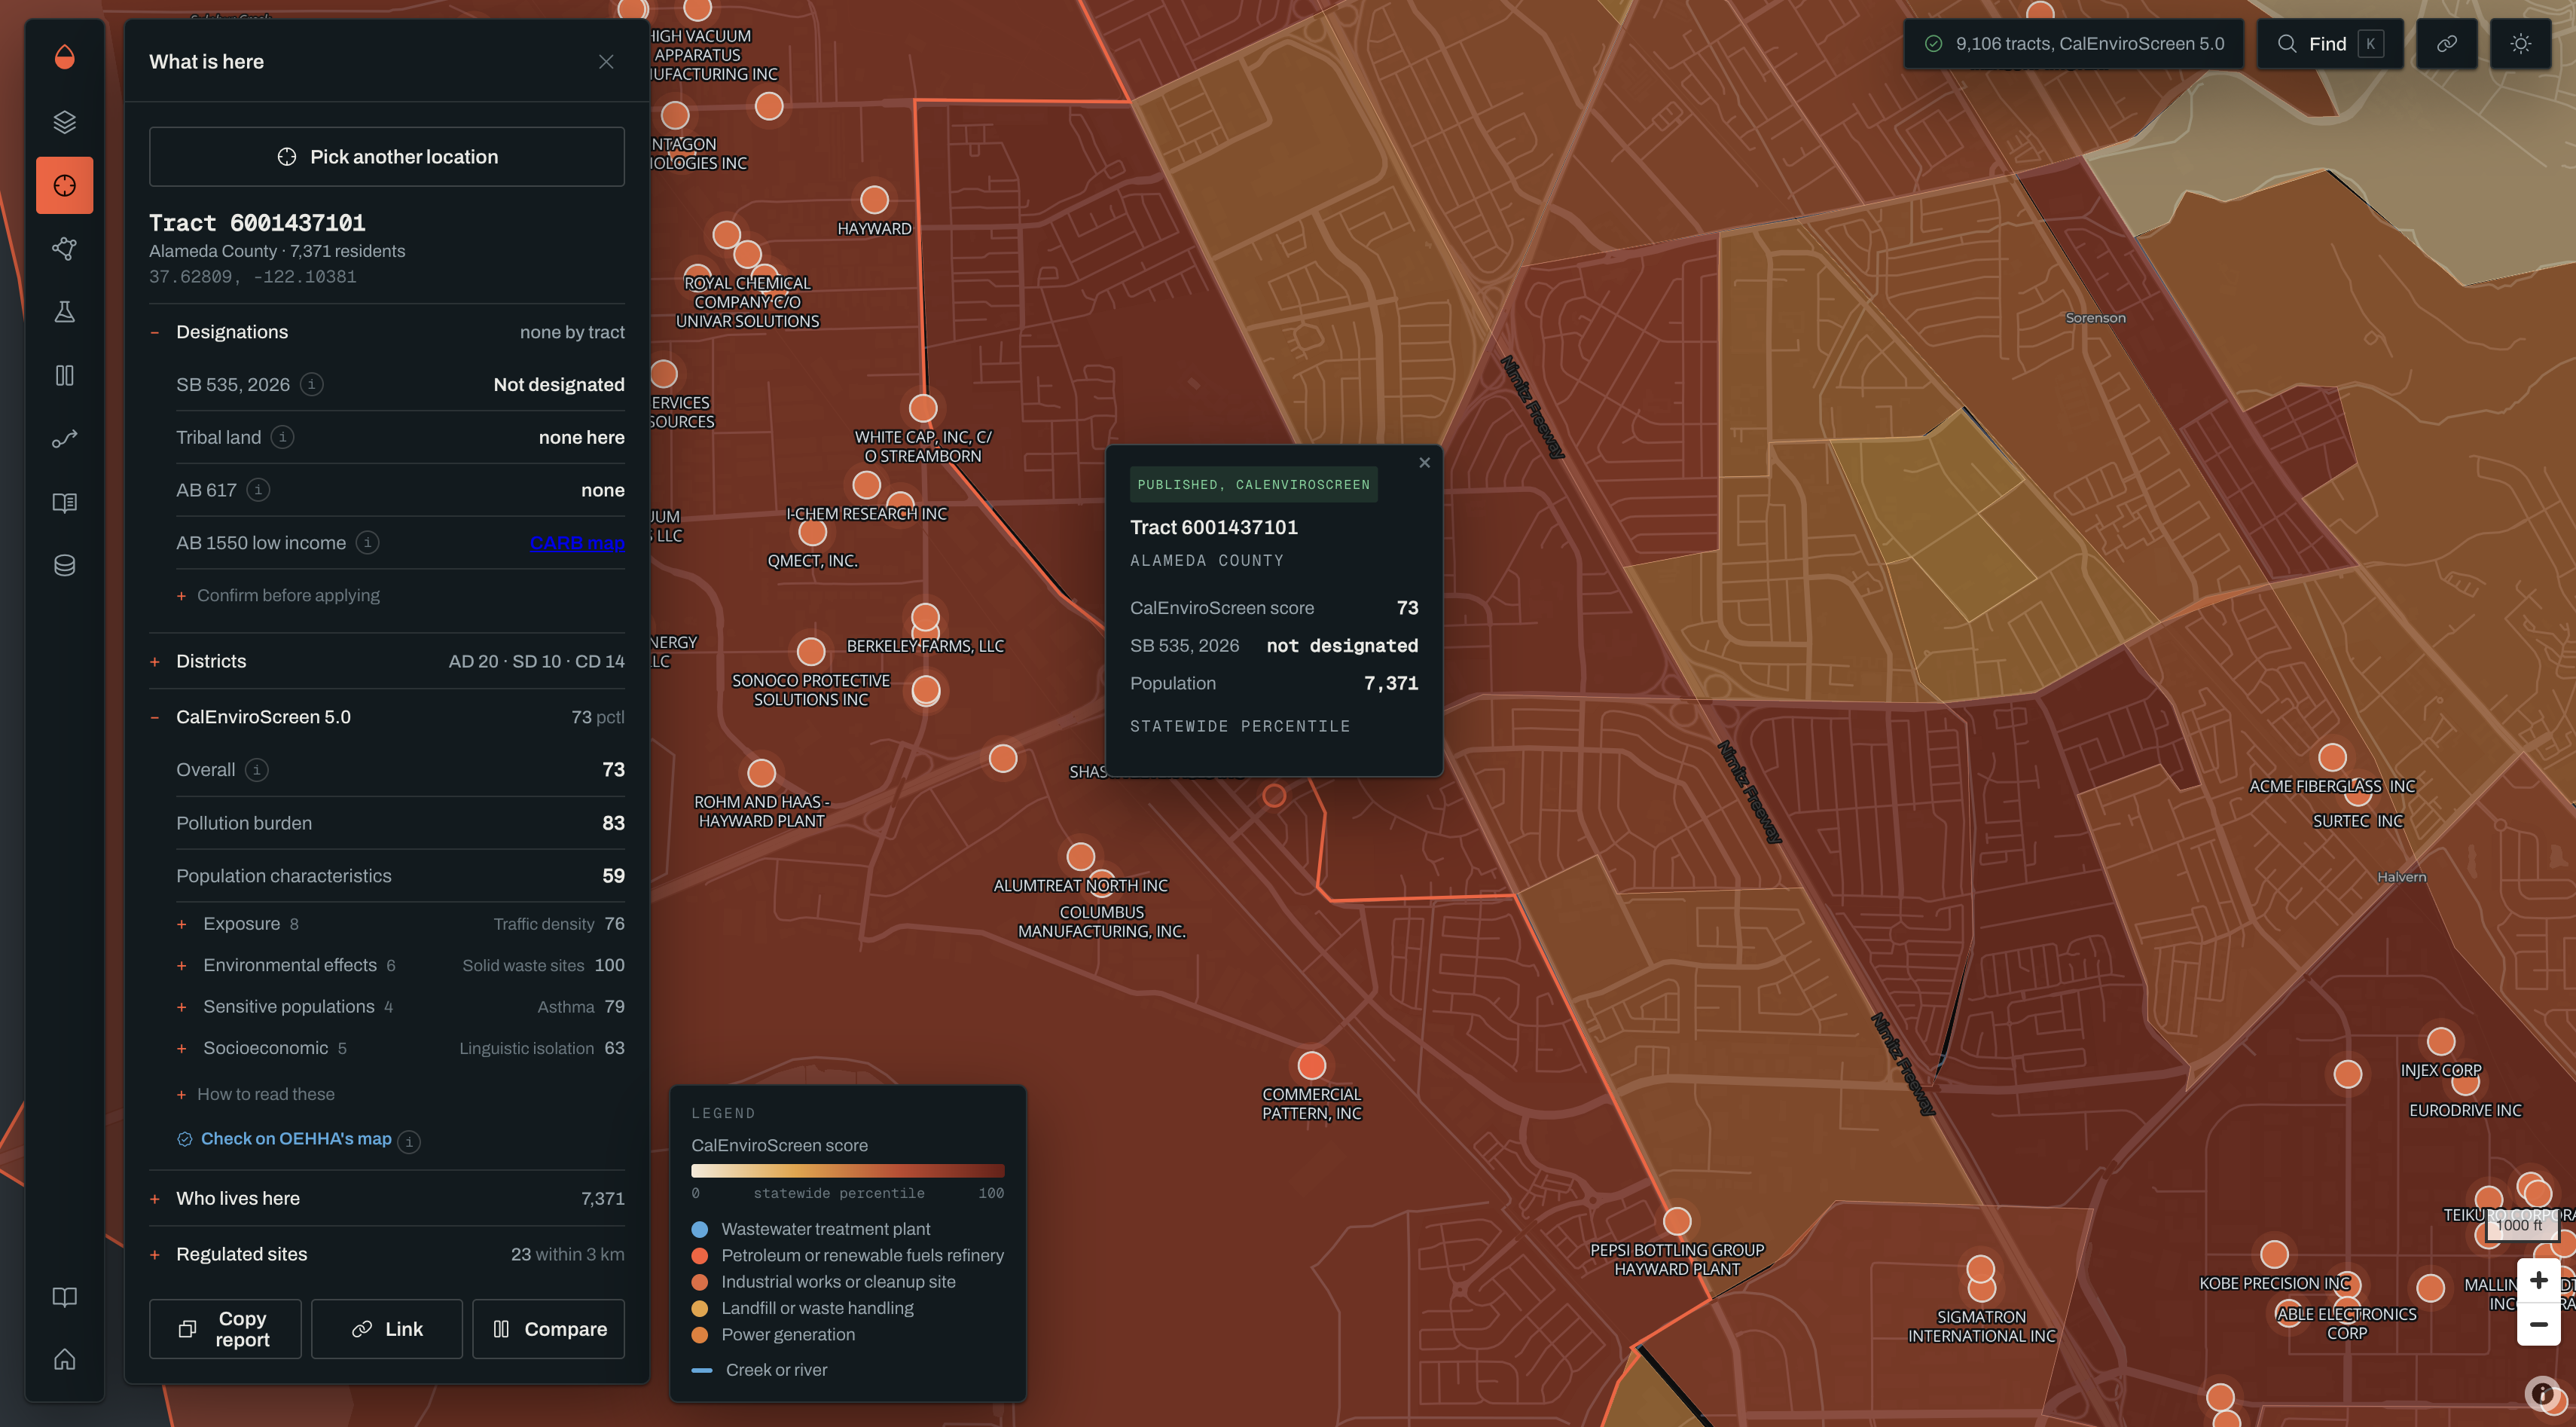
Inspecting an area
-
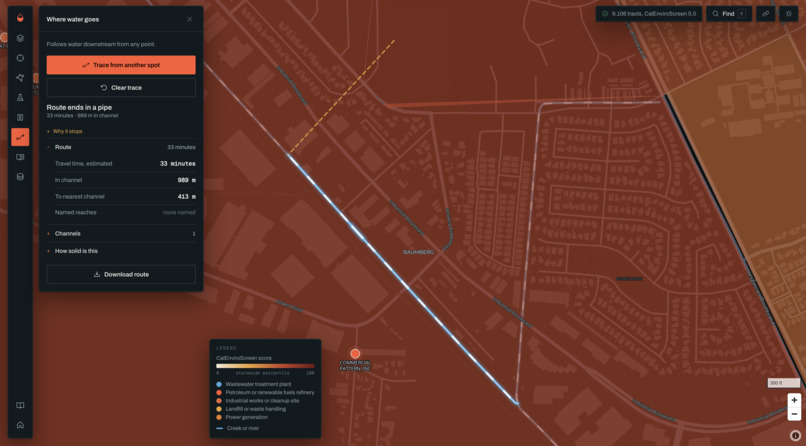
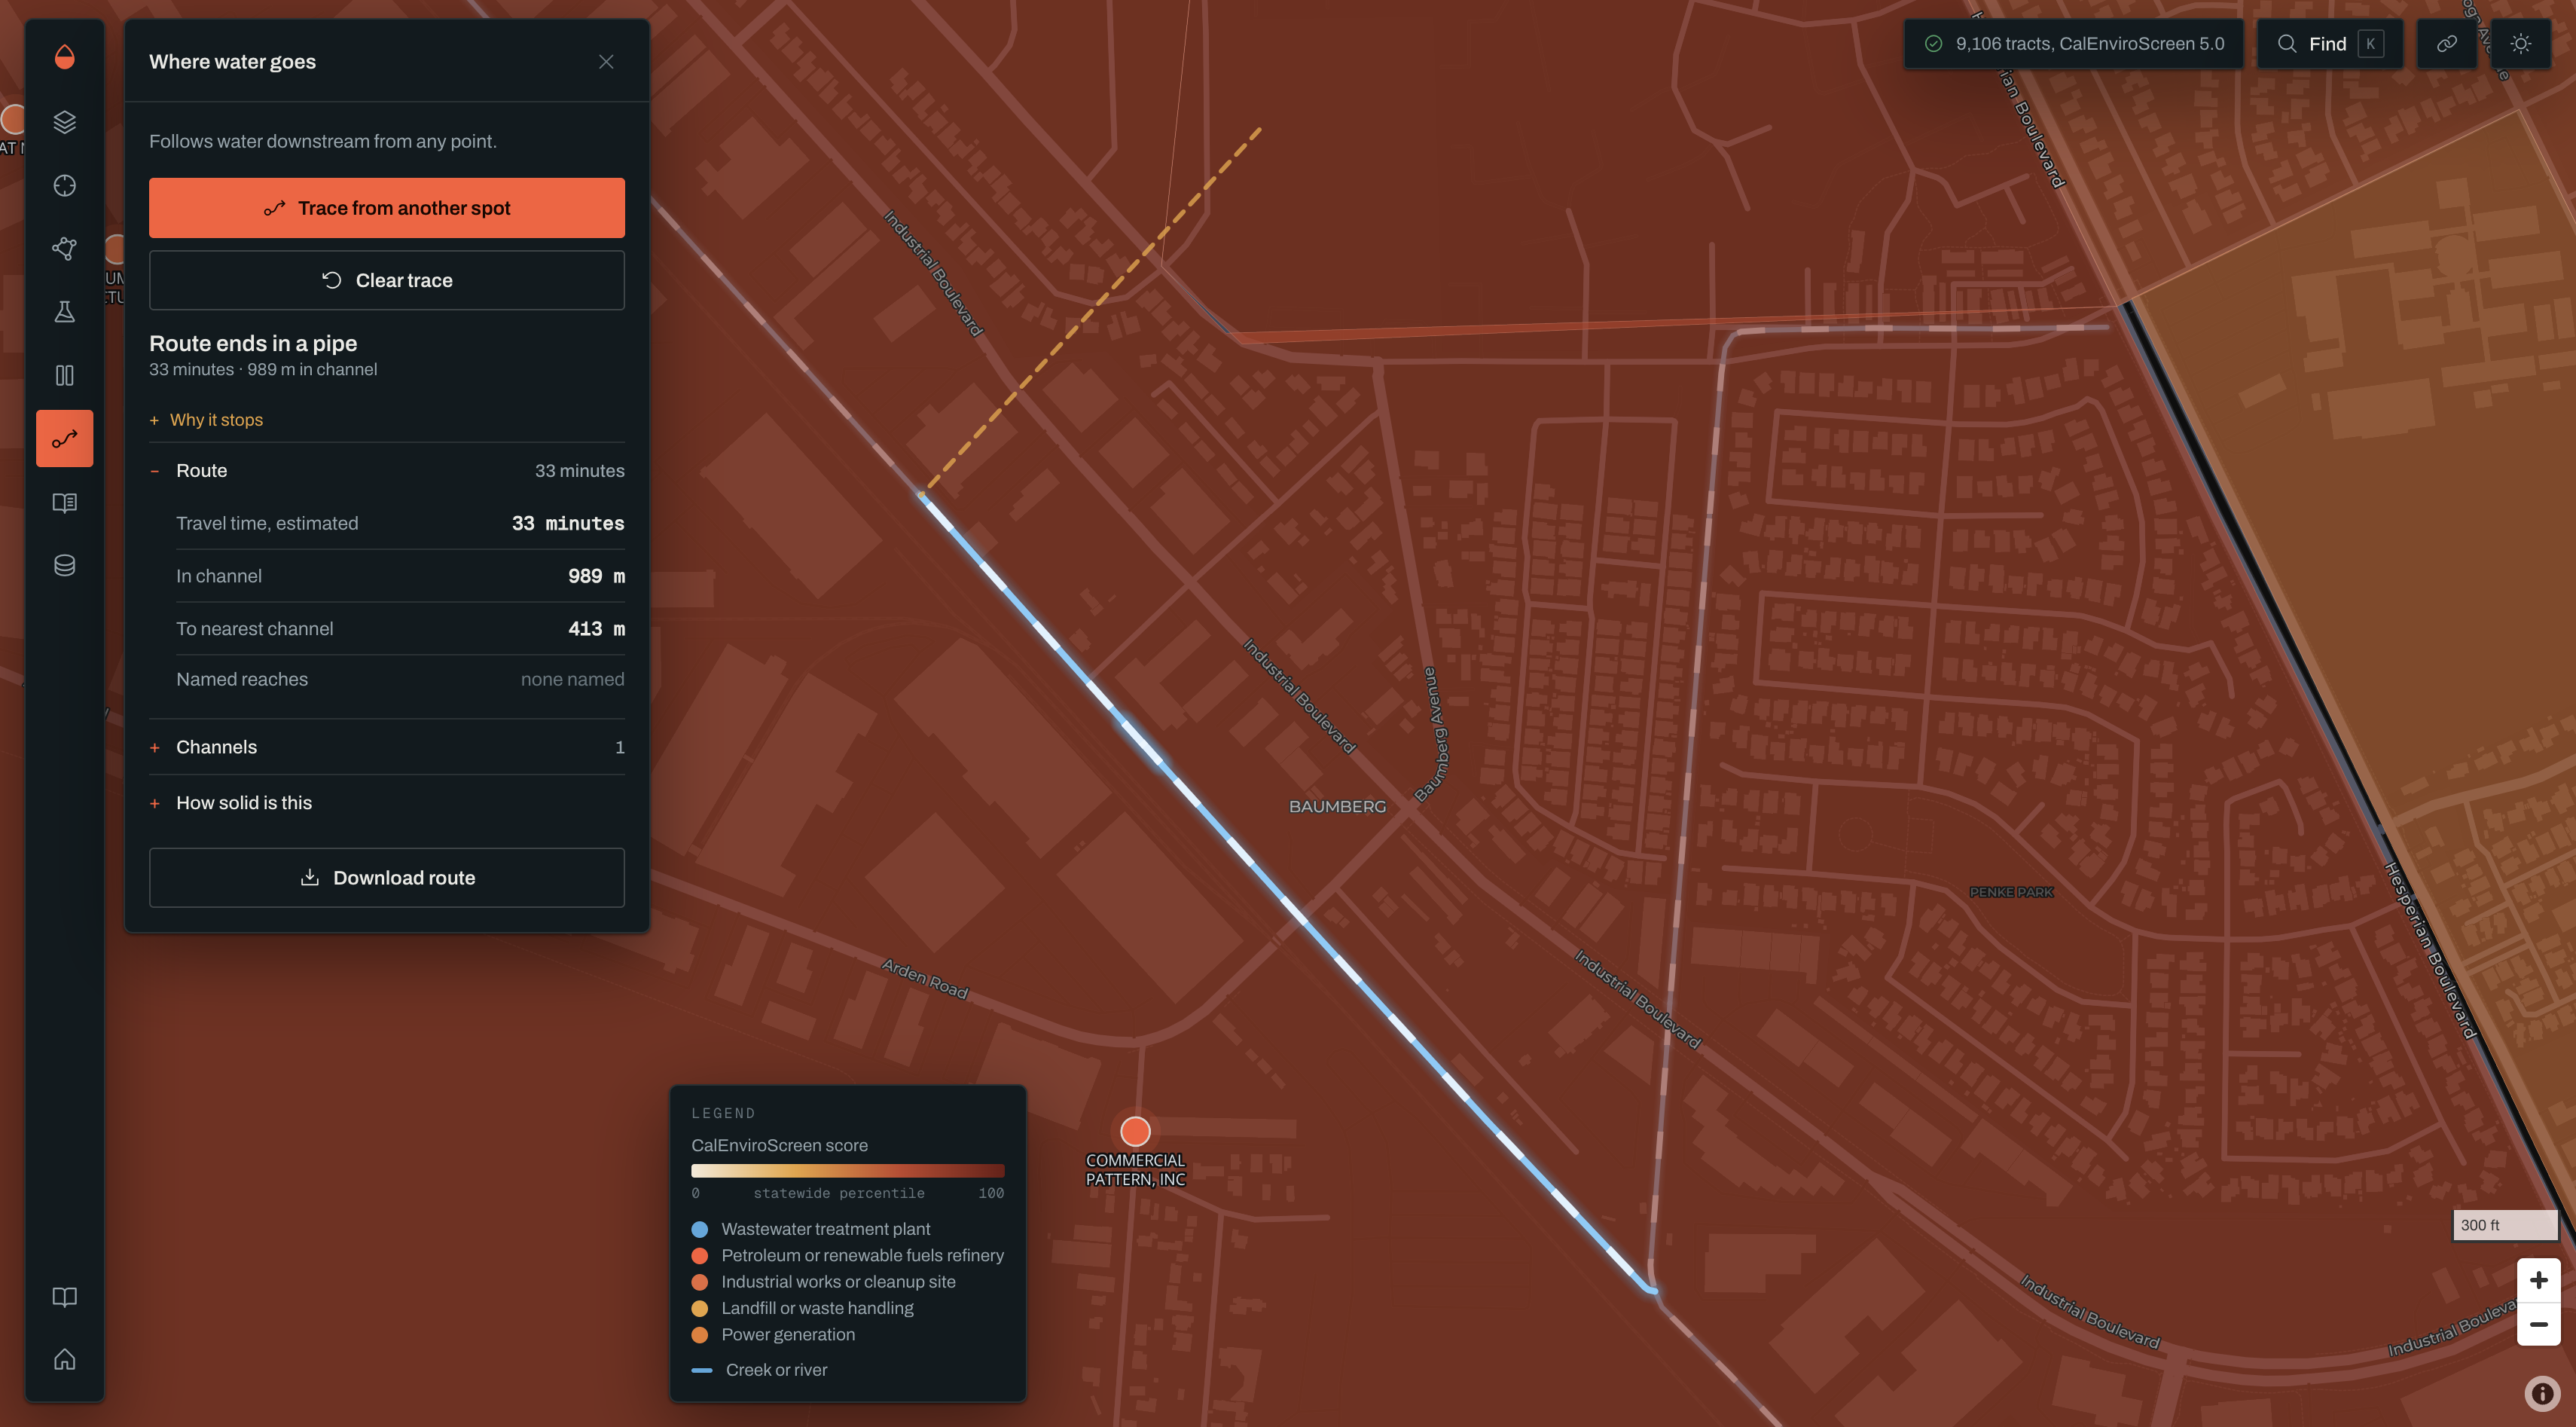
Modeling runoff
Inspiration
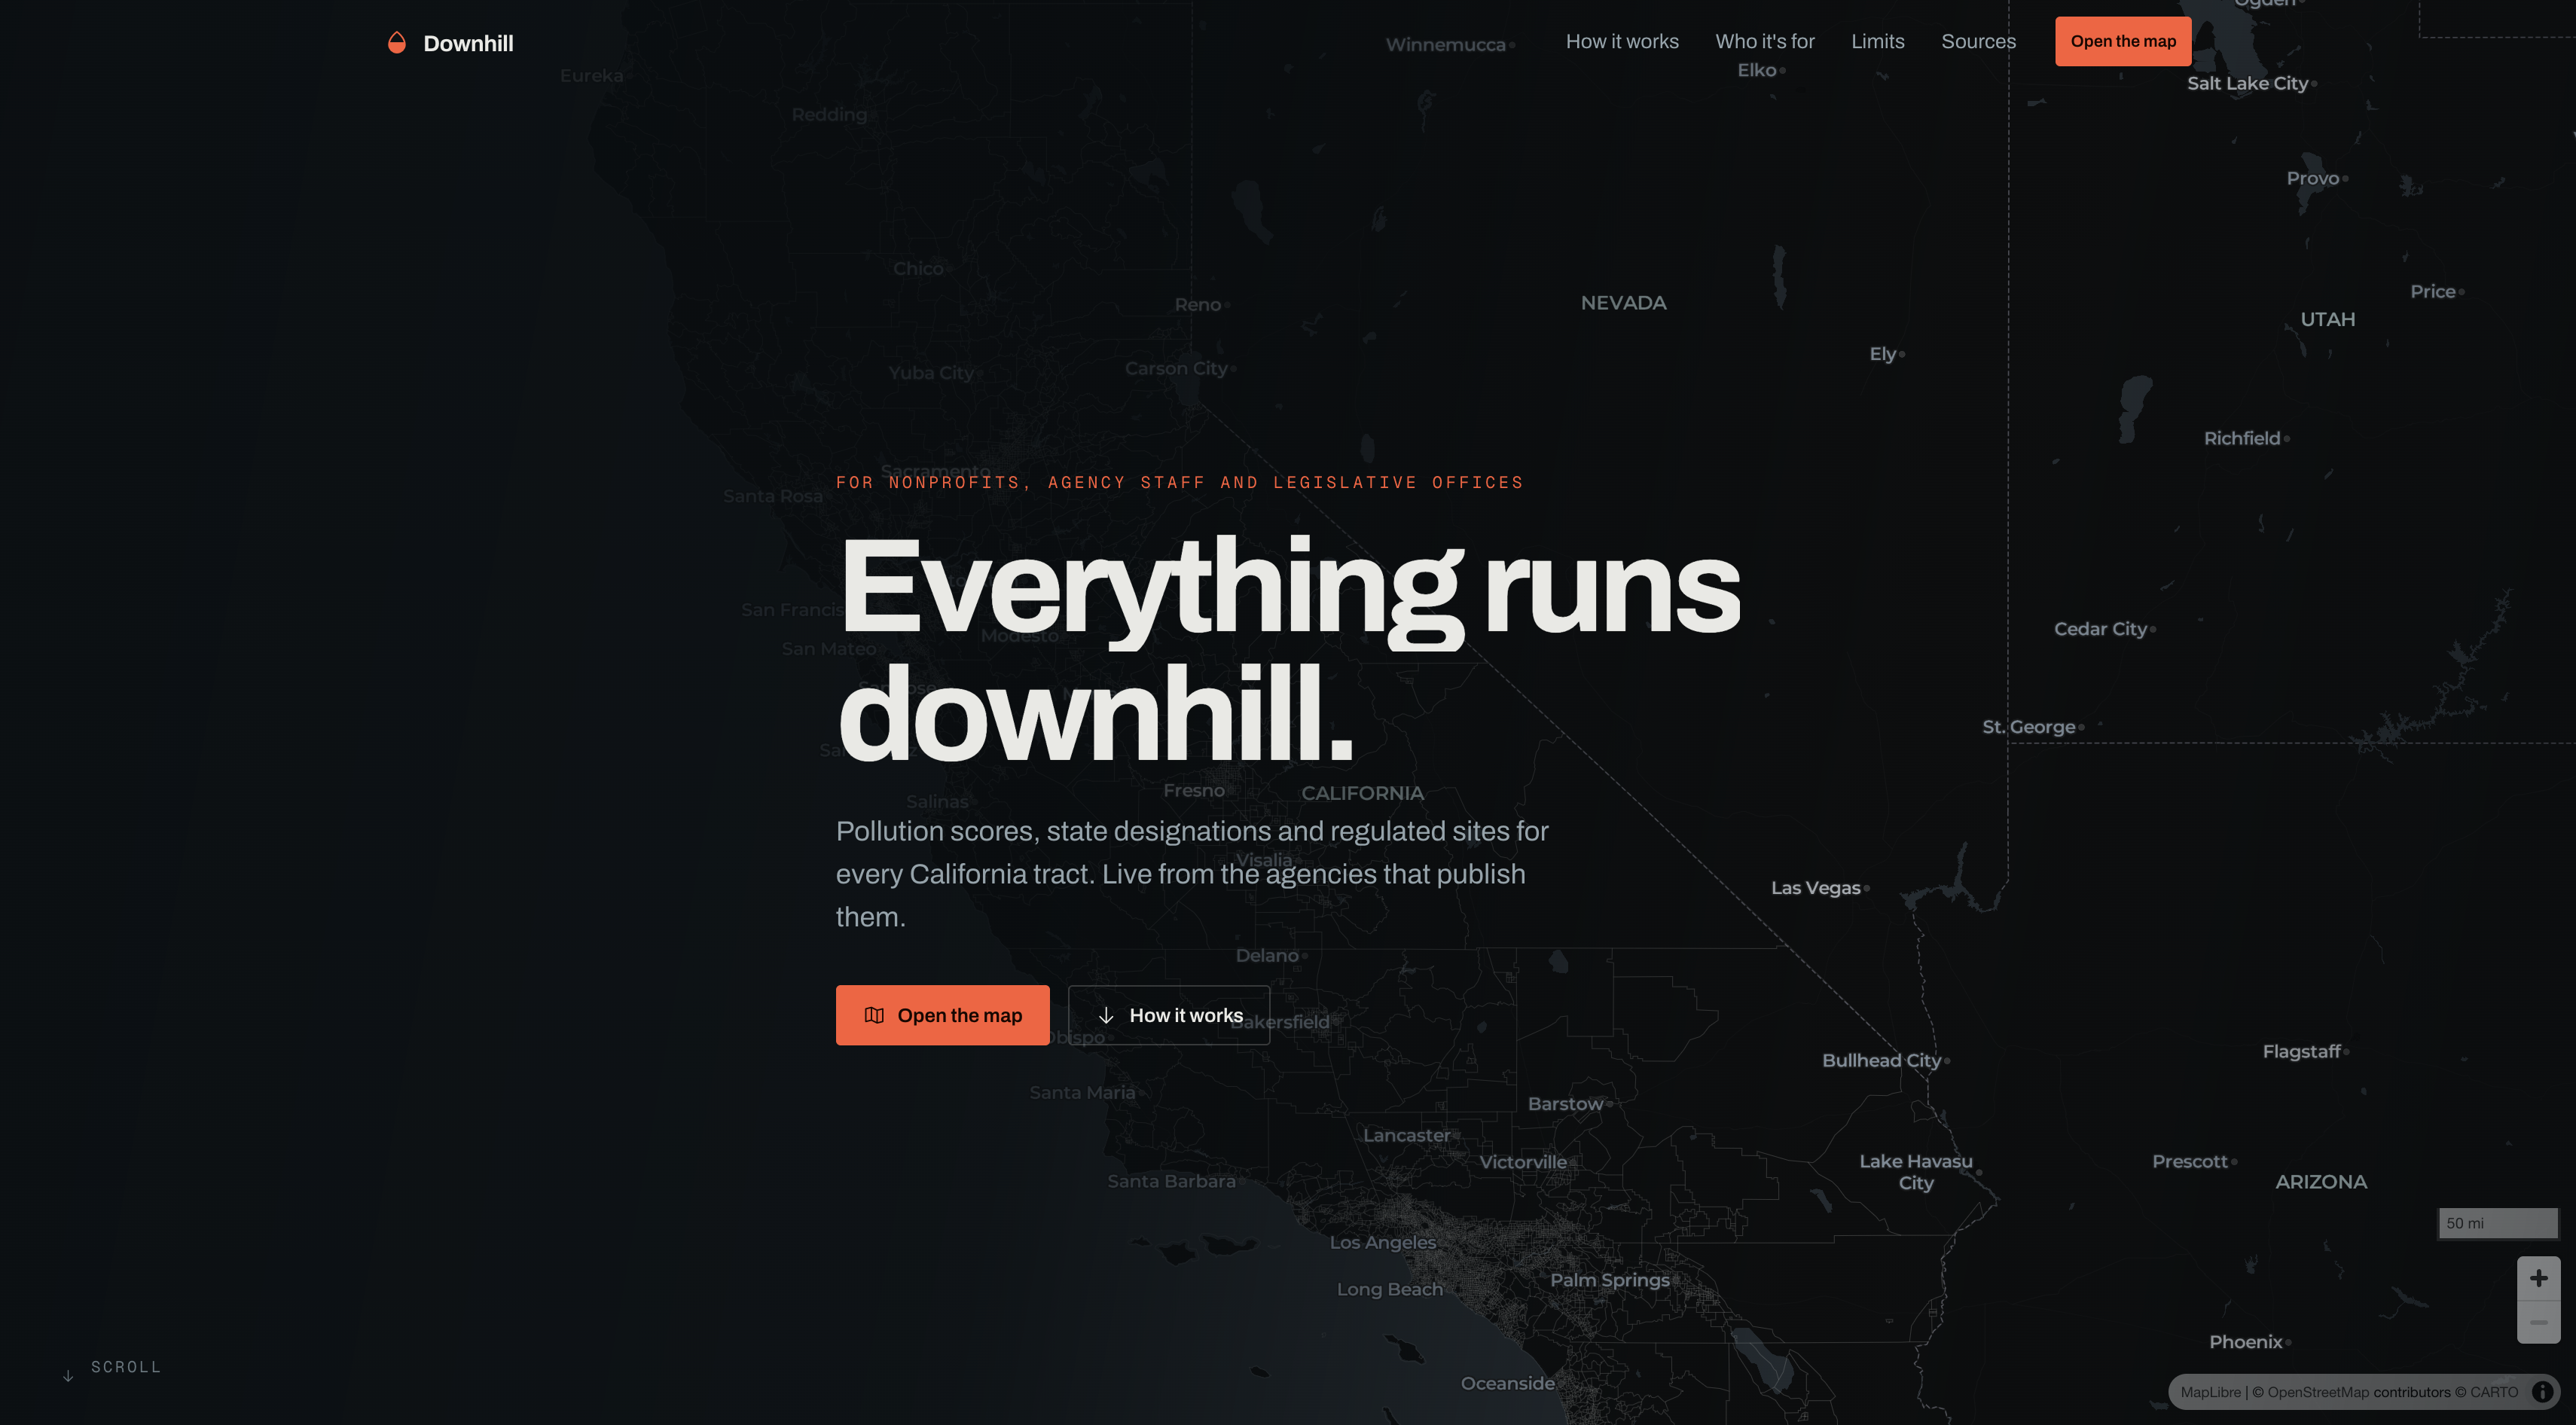
California already ranks every census tract on pollution, health and income. The scores are public, and they decide real money: at least 35% of California Climate Investments has to reach "priority populations," and the state's disadvantaged-community list is drawn largely from those rankings. But using them takes a GIS background. If you write grants for a small nonprofit, or you're a legislative staffer with a district to brief on, you get a percentile and no context. You can't see which sites sit behind it, who lives there, or whether the tract is designated at all.
Downhill puts all of that on one screen and keeps every number tied to the agency that published it.
What it does
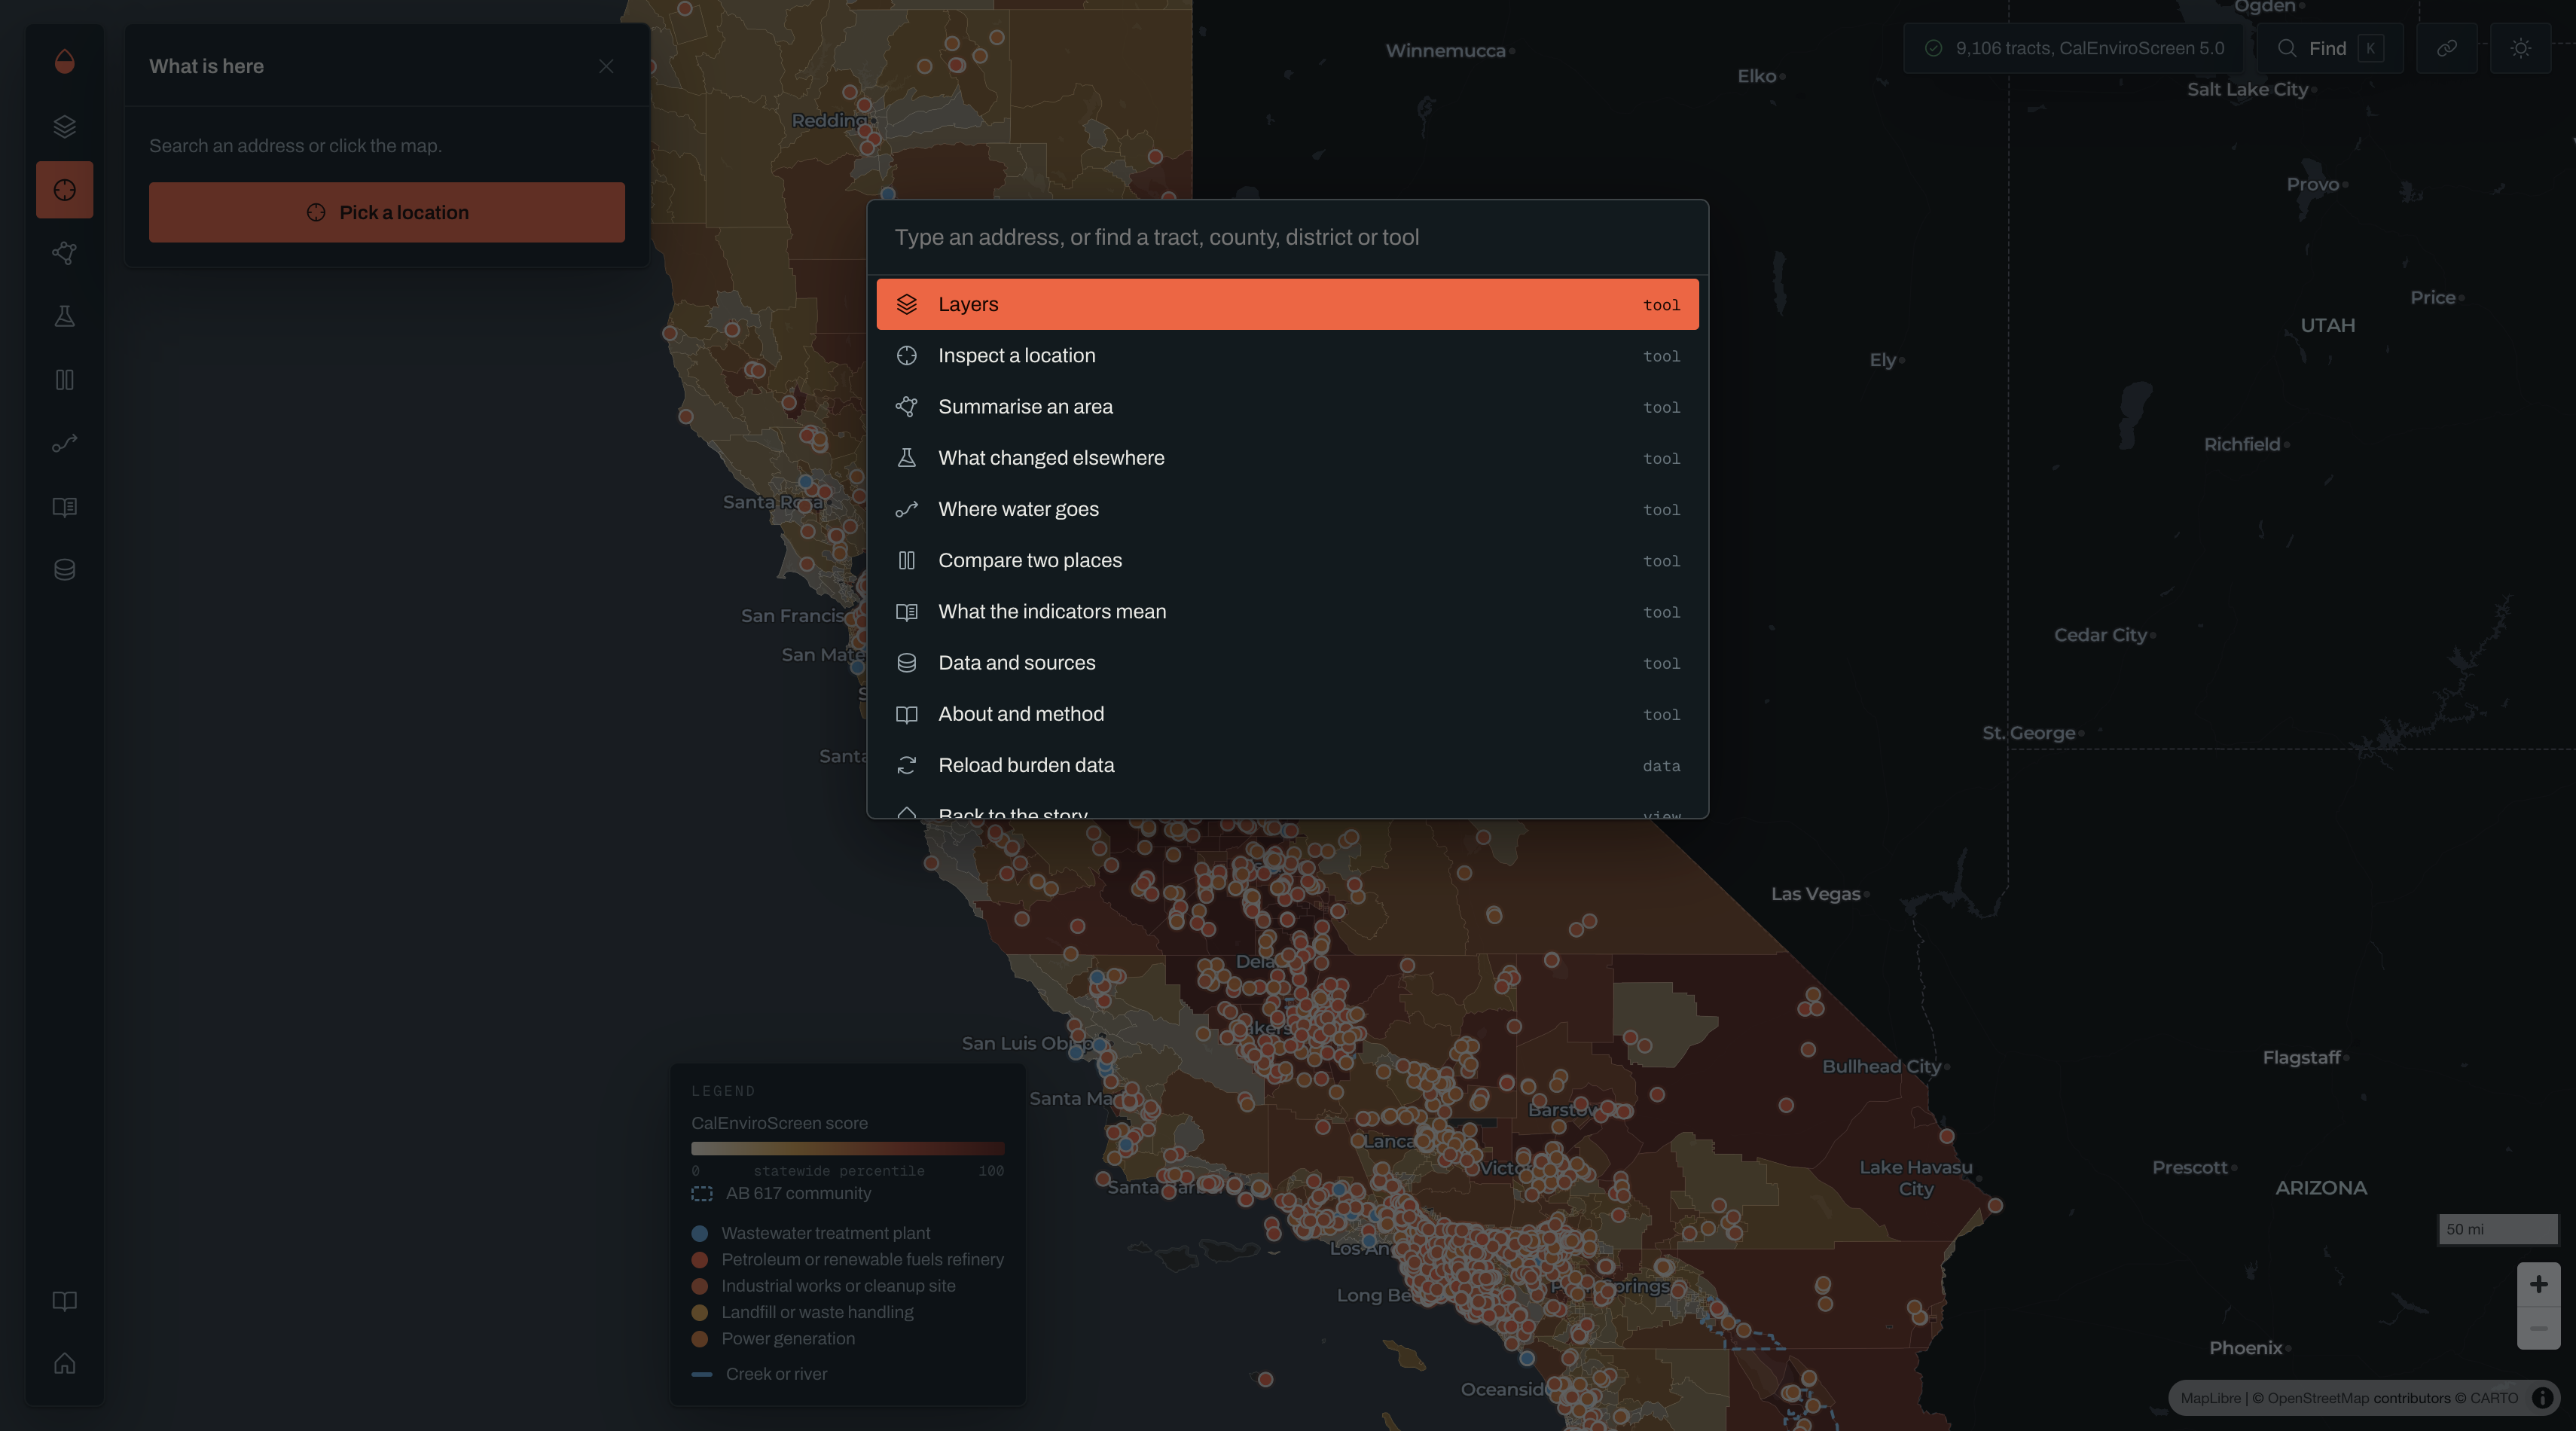
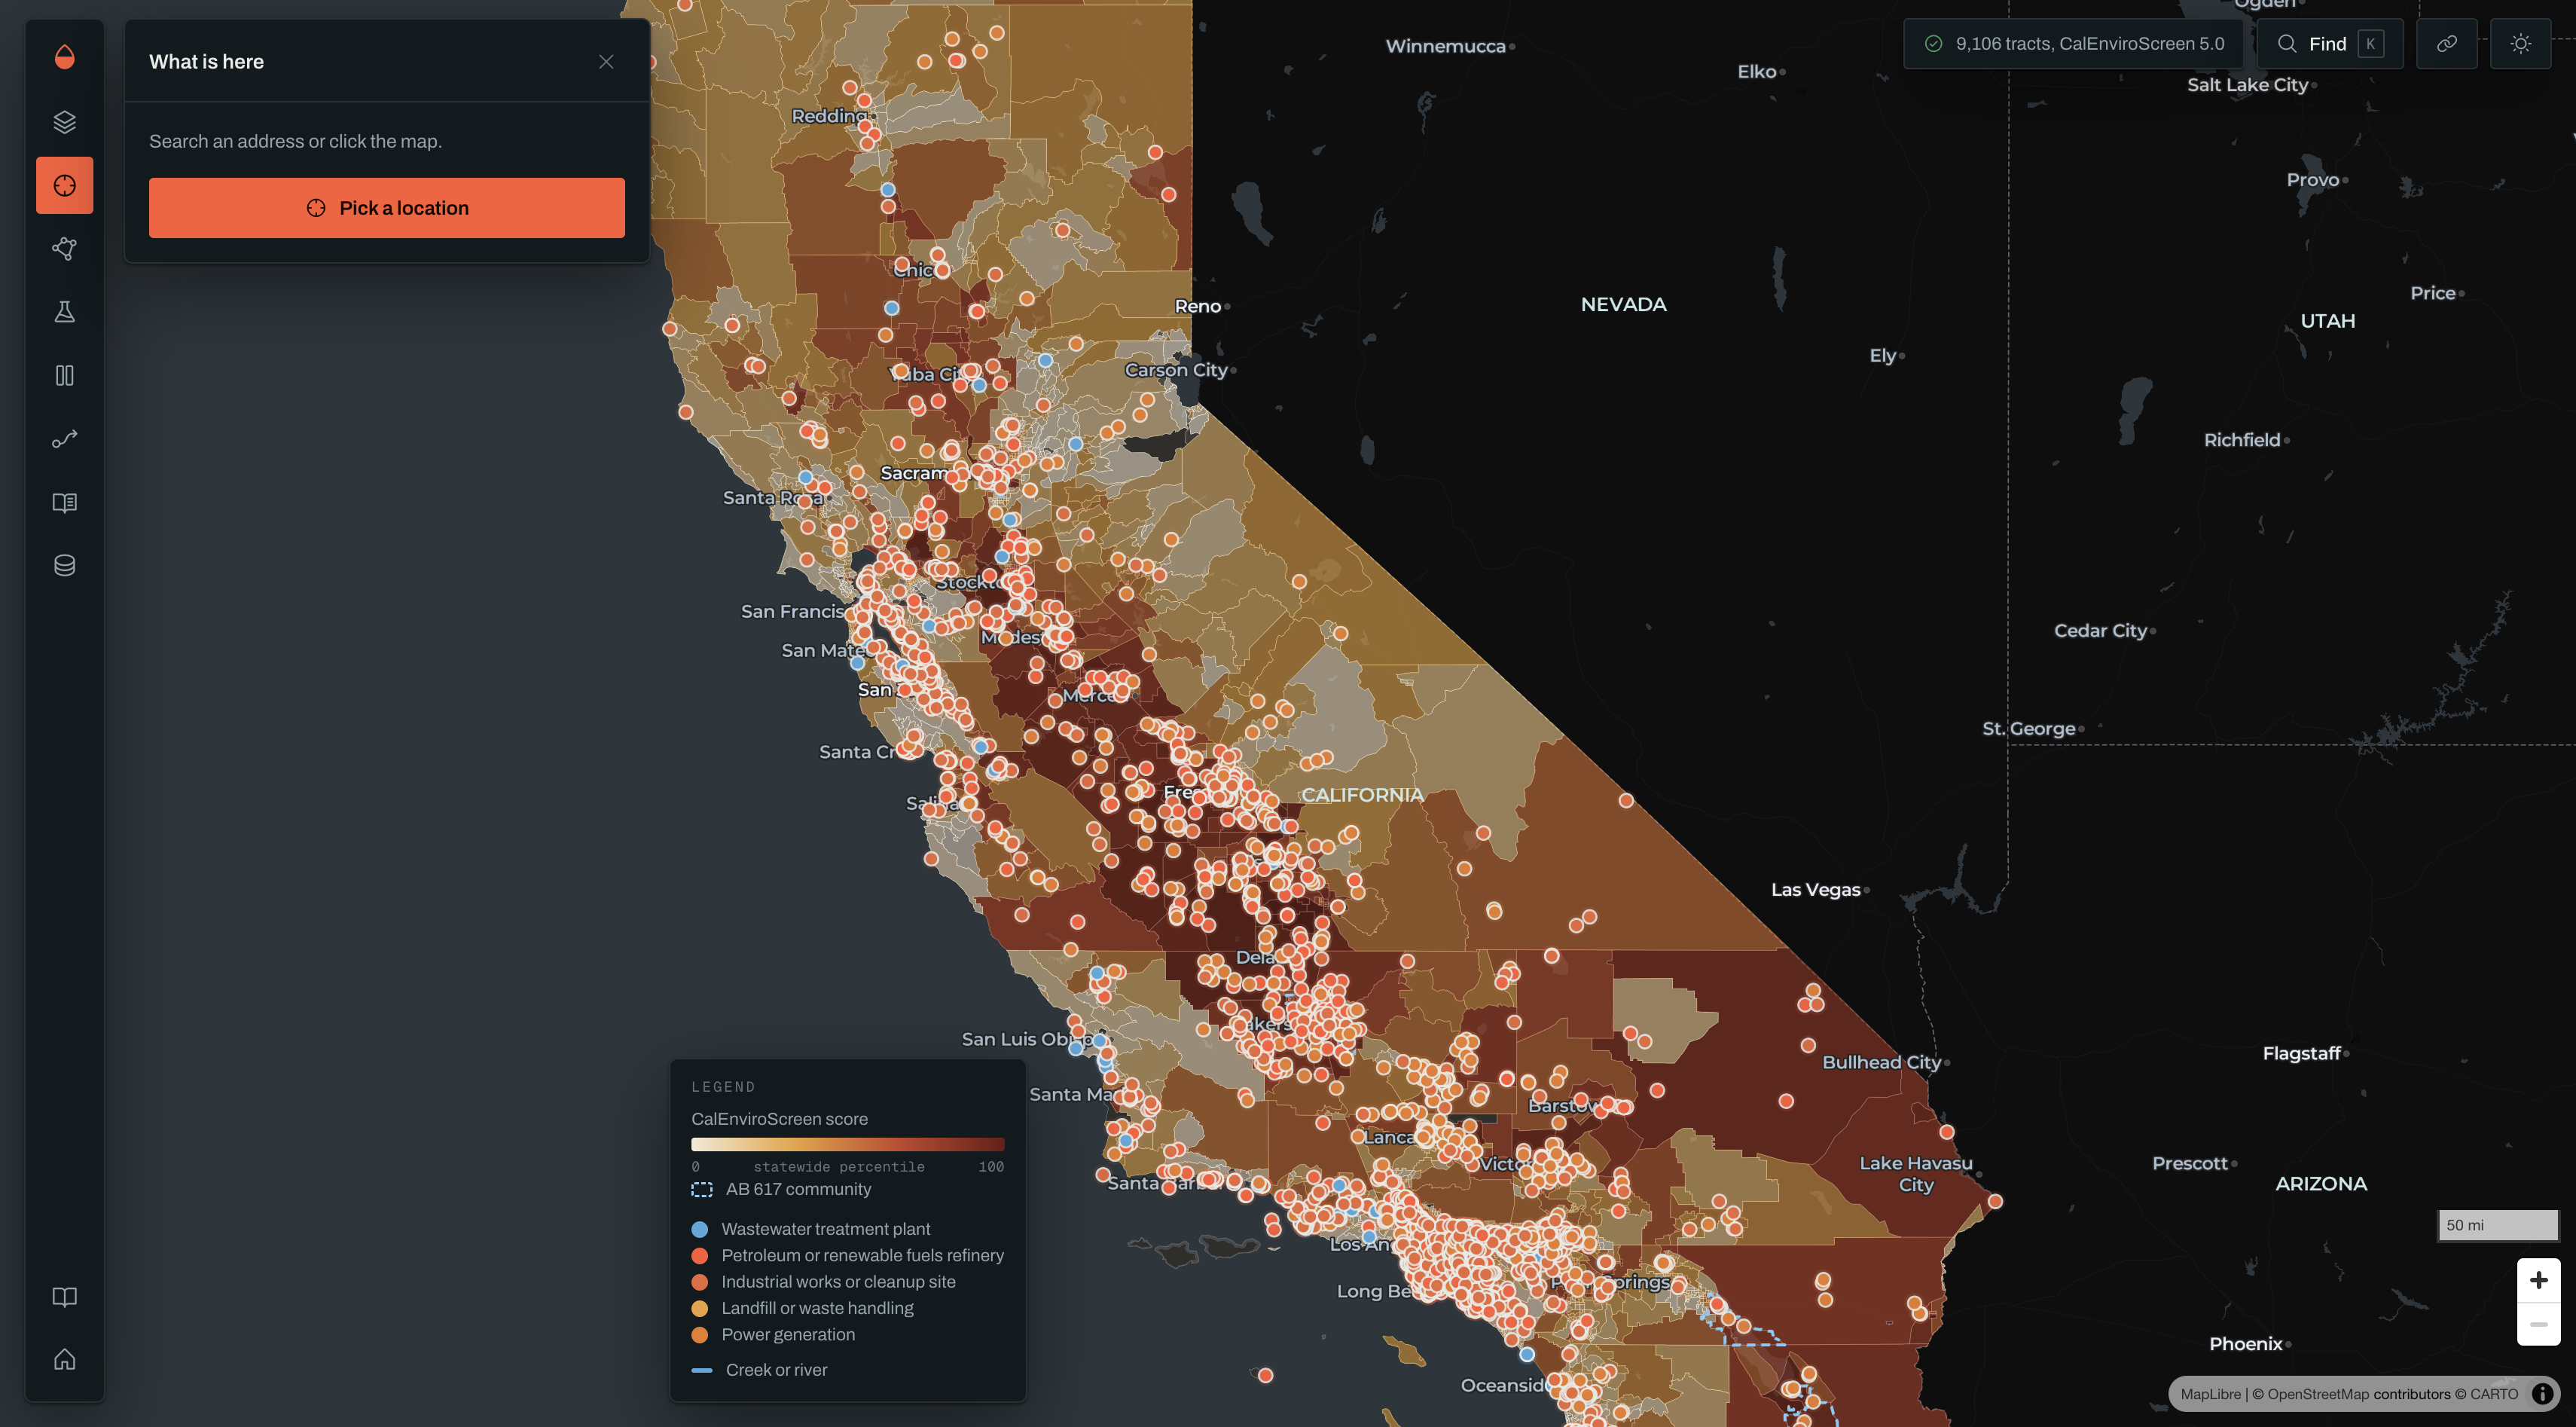
Search an address, or click the map, and you get:
- The tract's CalEnviroScreen 5.0 scores: all 23 measures, folded into OEHHA's four groups
- Designation status: whether CalEPA lists it as a disadvantaged community for 2026, and on which criterion
- Tribal lands, which are designated in their own right, with a flag when a tract is far larger than the land inside it
- AB 617 community air protection areas, plus the Assembly, State Senate and Congressional districts for the point
- Regulated sites nearby, each linked to its EPA compliance file
Then a few tools built for the people who actually use this data:
- Area summaries for a county, district, AB 617 community, or tracts you pick by hand. You get residents, the share living in designated tracts, and a brief and CSV to paste into a grant.
- What changed elsewhere: 17 published natural experiments, like power plant retirements, a coke plant closure, Dublin's coal ban and Atlanta's Olympic traffic limits. Each says what was measured, the study's limits, and links the paper.
- Downstream trace: follows water from any point down OpenStreetMap's stream network to where it ends up.
How we built it
Downhill is a single HTML file with no build step and no server. It runs MapLibre GL for the map and Turf.js for geometry, and everything else is plain JavaScript.
Every layer is fetched live from the publisher each time the page opens:
| Layer | Source |
|---|---|
| Scores and demographics | OEHHA CalEnviroScreen 5.0, ArcGIS feature service |
| Designations and tribal lands | CalEPA SB 535 2026 service |
| AB 617 communities | CARB map service |
| Districts | Census Bureau TIGERweb |
| Regulated sites | EPA Facility Registry Service |
| Address search | Census Bureau geocoder |
| Waterways | OpenStreetMap vector tiles |
Area summaries add up what can be added up. Residents in group \(g\) across area \(A\) are estimated from each tract's population \(p_t\) and published share \(s_{t,g}\):
$$\hat{n}g = \sum{t \in A} p_t \, s_{t,g}$$
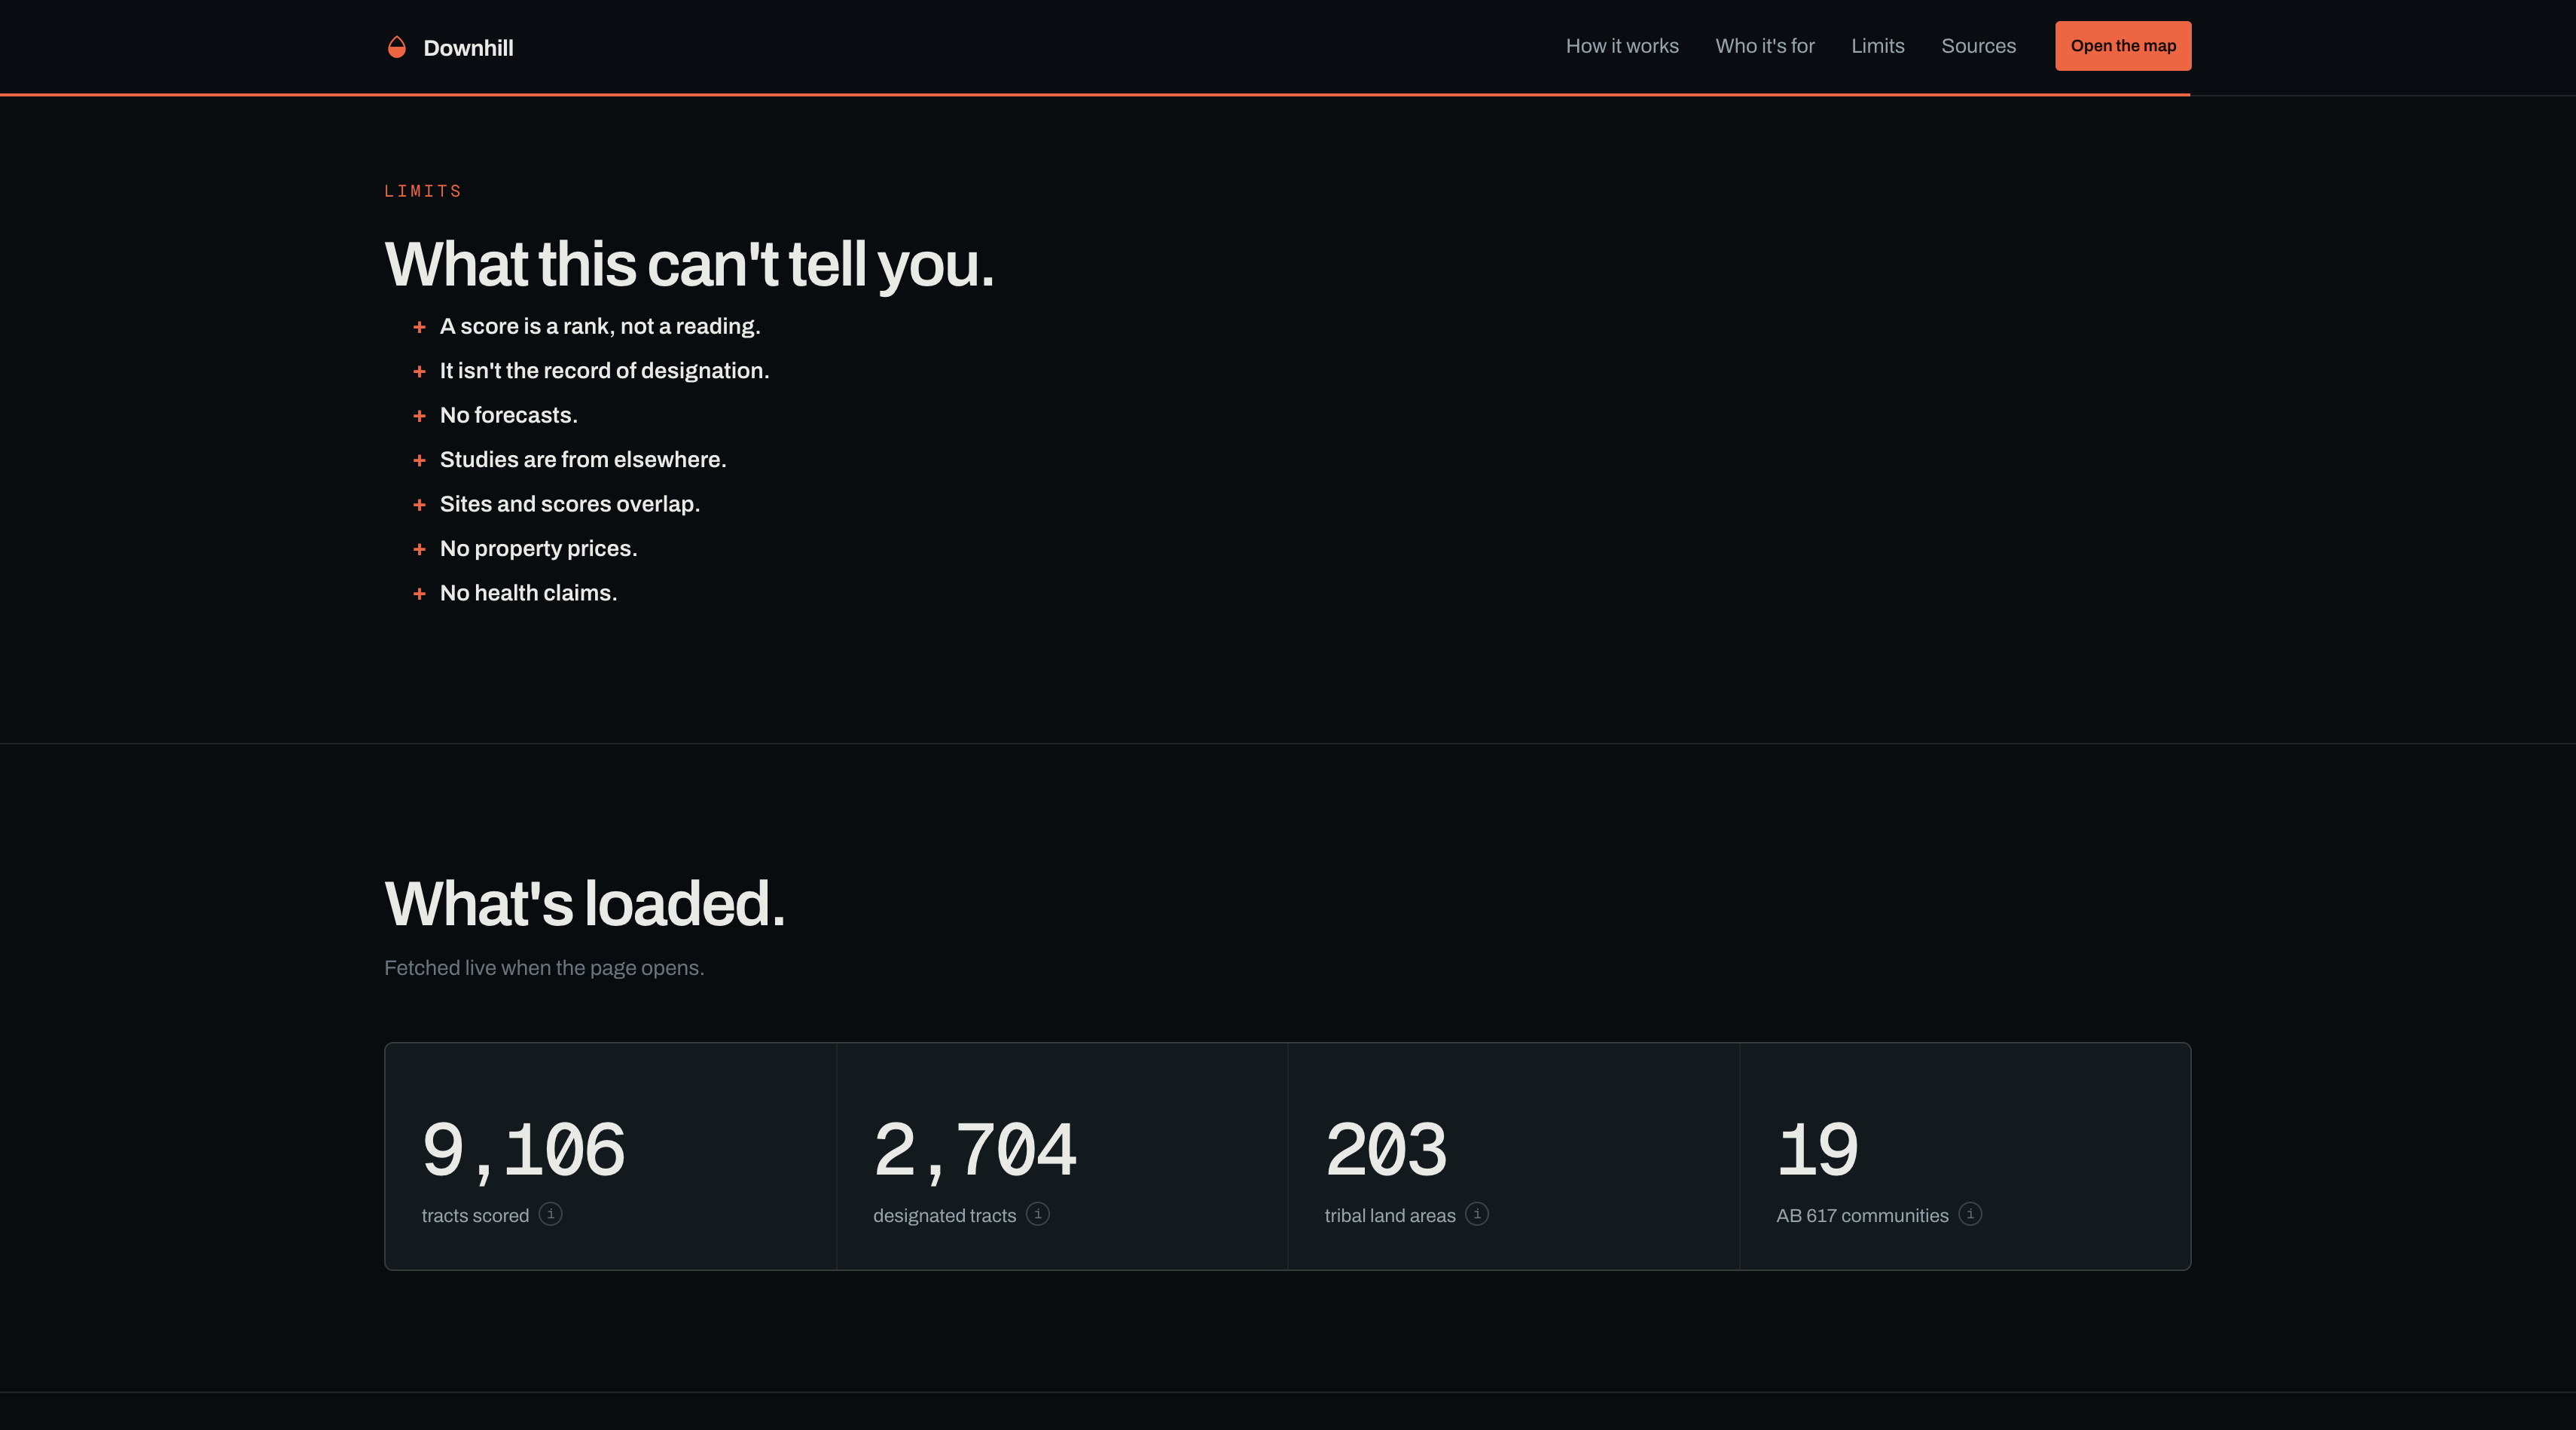
Percentiles are never averaged. An average of ranks isn't a rank, and it hides the worst tracts, so the app shows how many tracts fall in each band instead.
I built it with Claude (Anthropic) as a coding and research assistant. I set the scope, made the design and policy calls, and checked the outputs against the agencies' own services.
Challenges we ran into
- Feedback from the people who make the data. I sent an early version to OEHHA's CalEnviroScreen team. They pointed out that six of the 23 measures are counts of regulated sites, so showing those sites next to high scores and calling it evidence is circular. That changed the purpose of the app: it now names the sites and links their records, and says plainly that proximity proves nothing.
- The service that "wasn't there." CalEnviroScreen 5.0 kept returning "layer not found." The data lives at layer 2, not layer 0. Reading the service's own schema instead of assuming fixed it.
- CORS. The Census geocoder and some state servers don't send CORS headers,
so browser requests are blocked. Every request now tries
fetchfirst and falls back to JSONP. - Saying no to a feature. I wanted a "what if this facility closed" simulator. I didn't build it. Percentiles are relative ranks, the site measures are counts rather than emissions, and OEHHA rules the tool out for forecasts. The studies library replaced it: real measured outcomes, with their limits attached.
- Too much text. Early feedback said the main point got lost in the paragraphs. Every panel now shows facts first, and the explanations sit behind a + / – toggle.
Accomplishments that we're proud of
- Every figure on screen links to the agency or paper it came from
- No data copied into the app, so nothing goes stale
- A methodology document that lists the app's own weaknesses
What we learned
The best innovation comes at an intersection of ideas, where they can support, deny, or add nuance to each other. That is what Downhill does with public datasets. They originally existed separately, until Downhill found a way to analyze them together. That sparks meaningful change.
What's next for Downhill
- Feedback from the groups who'd use it: grant writers, legislative staff, tribal environmental offices
- AB 1550 low-income communities, which need income data CalEnviroScreen doesn't carry
- Enforcement history for each facility, pulled from EPA's compliance records
Built With
- claude
- python


Log in or sign up for Devpost to join the conversation.