-
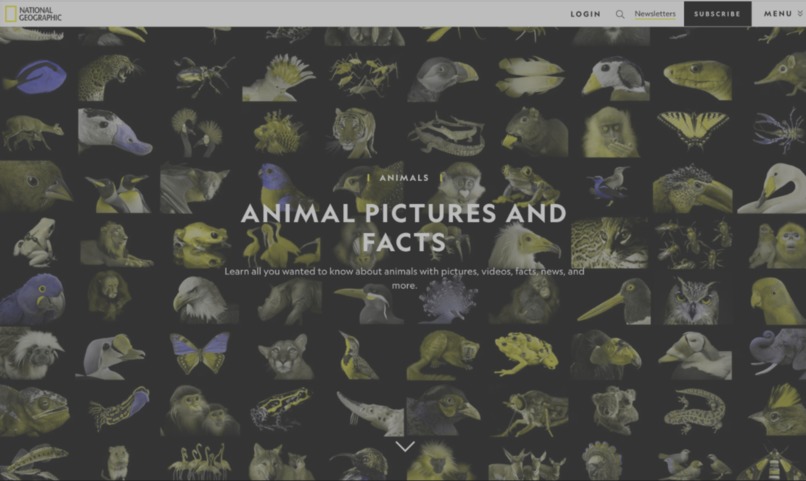
Demo_WebsiteWithDoggleFilter
-
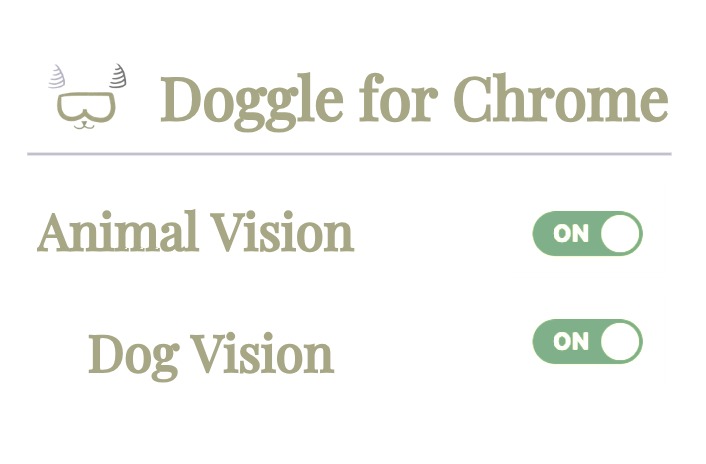
Doggle Extension Interface
-
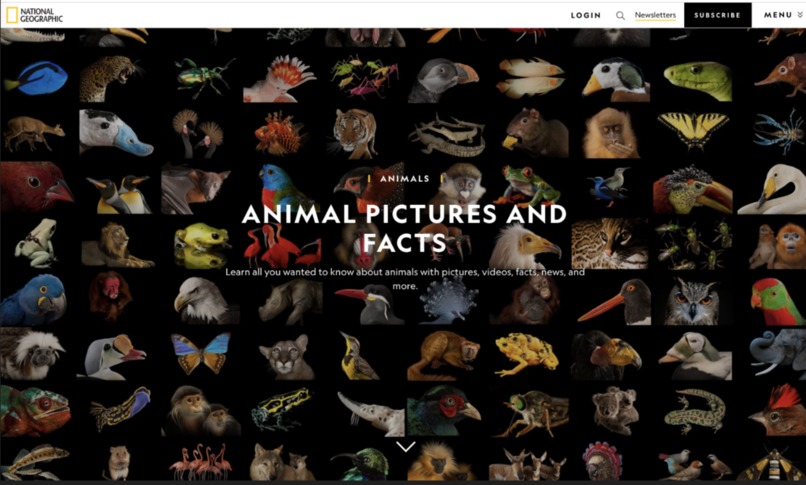
Demo_OriginalWeb


## Inspiration
- "How do animals perceive the world compared to humans?"
- "Given that dogs have fewer cone cells, how different is their color vision?"
- "What's the visual experience of a person with color blindness?"
- "How have animals' visual adaptations influenced their survival and behavior?"
- Drawing from Carvalho et al. 2017's study on primate color vision and MIT's Byrne & Hilbert's insights on color science, we studied and realized the profound implications of color perception on species' lifestyles and evolutionary trajectories. The biological investigation inspired us for this project.
What it does
1. Transformation of Webpage Visuals:
- Simulate deuteranopia by shifting red (570-750nm) to brownish-green and (380-495nm) to greyish-blue.
- Acknowledge the diverse color perceptions stemming from differences in retinal cone cells in humans and animals.
2. Educational & Awareness Drive:
- Offer interactive insights into diverse color perceptions, enhancing user understanding of animal behavior.
- Foster greater awareness and empathy for the richness of biodiversity, animal welfare, and protection.
- Highlight visual impairments, fostering a deeper societal empathy.
How we built it
- HTML, JS, CSS, PHP
- Prototype with Sketch and Procreate
Challenges we ran into
- No APIs, have to code everything by ourselves
- Extremely hard to extract loads of pictures, modify them, and replace them in a high speed.
Accomplishments that we're proud of
-Learnt and discussed comprehensive issues related to the visually impaired -explored various ways of image processing
- The front end works
- We learned a lot from peers
What we learned
- This is not a beginner-friendly project :(
What's next for Doggle(VisionVerse) Chrome Extension
Species-Specific Filters: Differentiate visuals based on animal classes like marine life, birds, and primates.
Knowledge Hub: Incorporate a backend database detailing color explanations and extend a reference section for color scheme insights.
Inclusive Graph Interpretation: Introduce alerts for graphics, especially scientific diagrams, that might confuse visually impaired users by assessing RGB similarity.
Optimization & Enhancement: Debug current functionalities and enhance the user interface for a more intuitive experience.


Log in or sign up for Devpost to join the conversation.