-
-
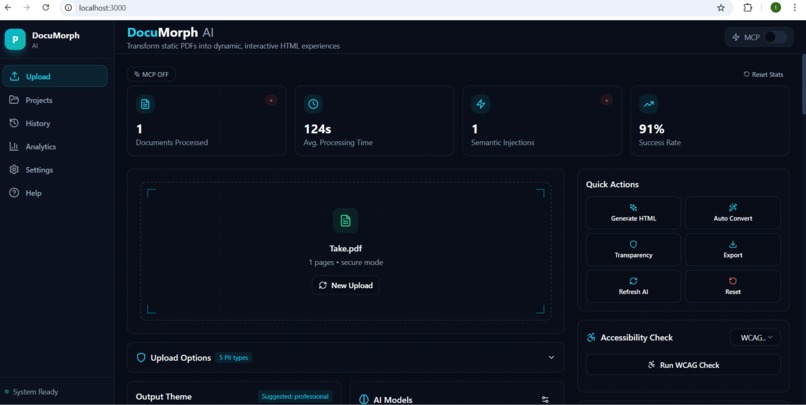
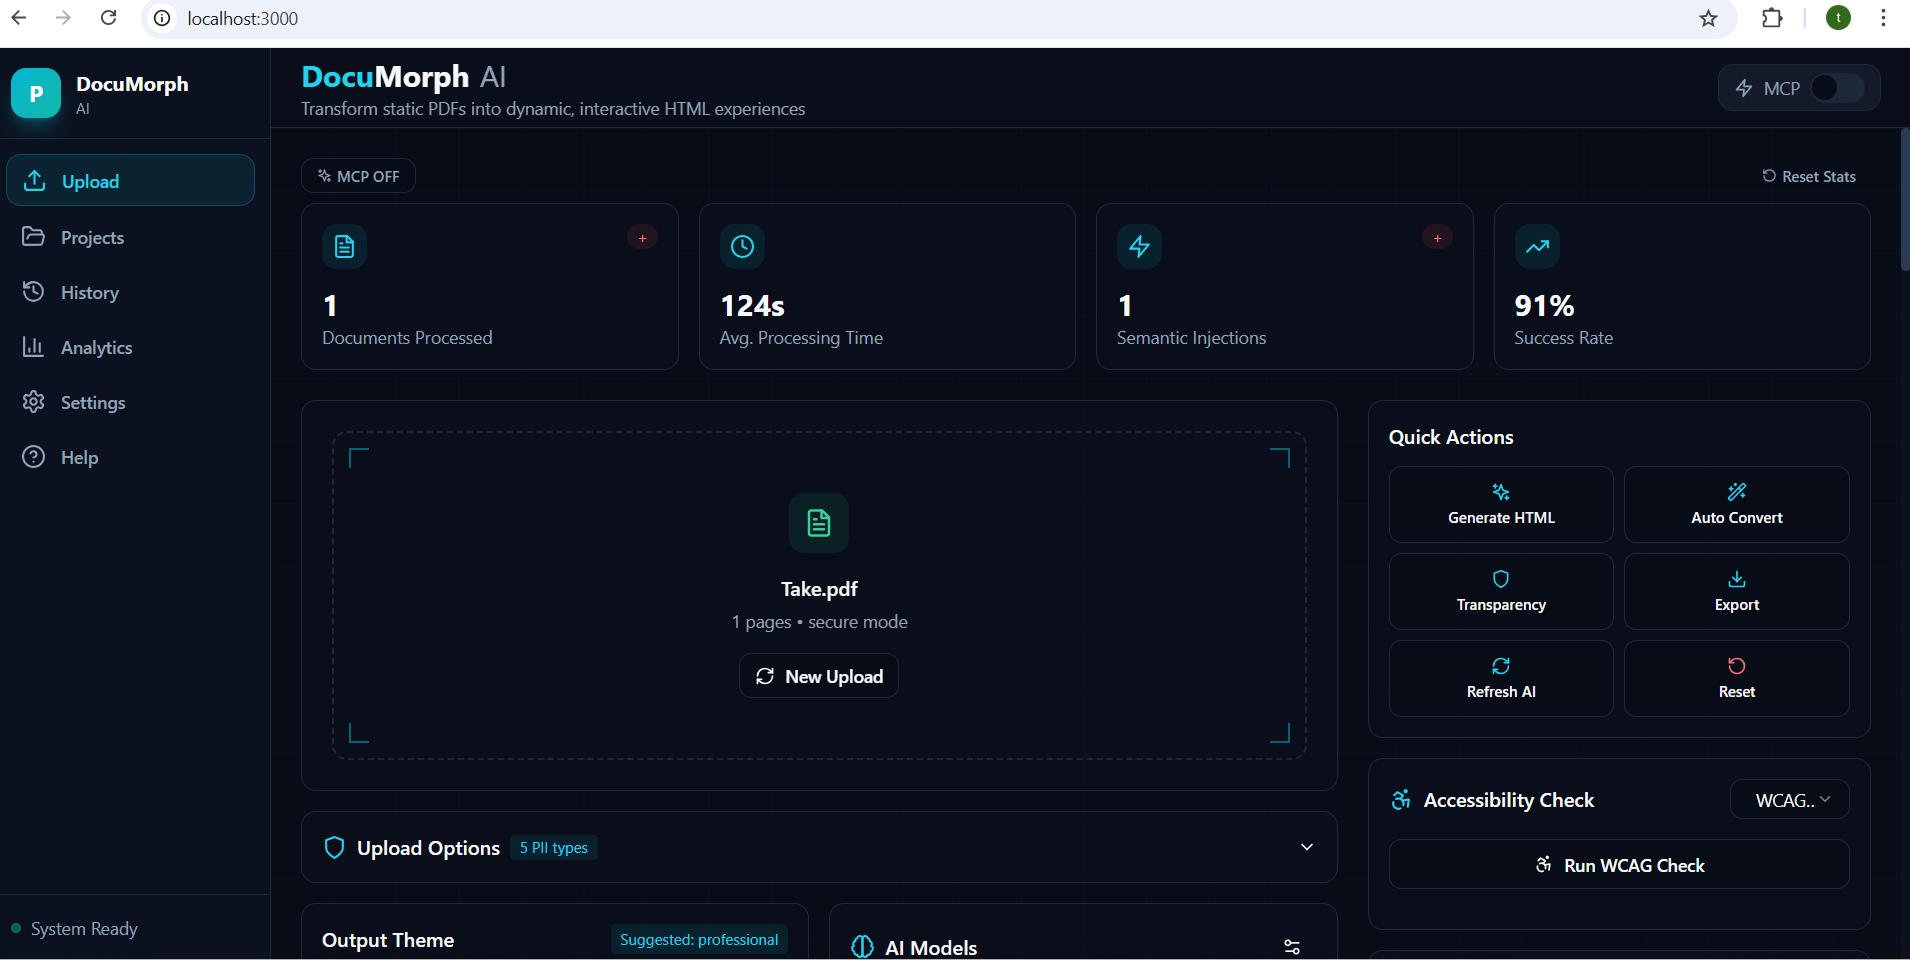
Uploading PDF UI
-
Backend Paddle Screen 3
-

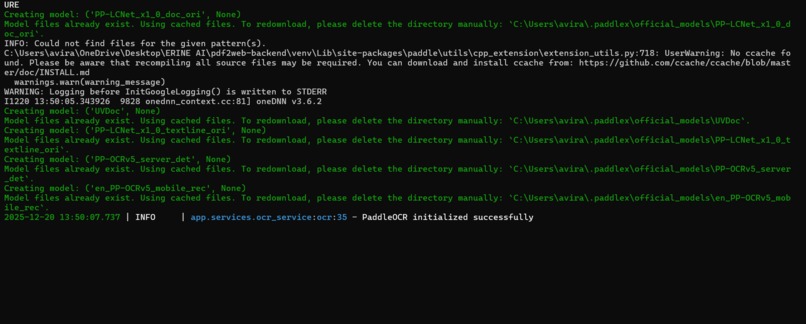
Backend Paddle Screen 1
-
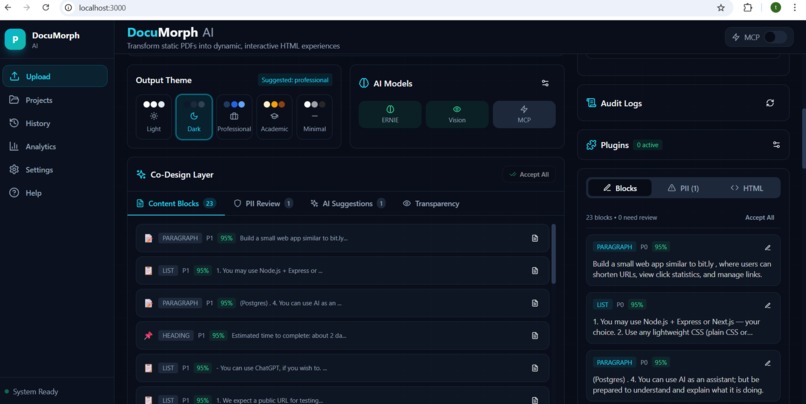
Uploaded PDF UI
-
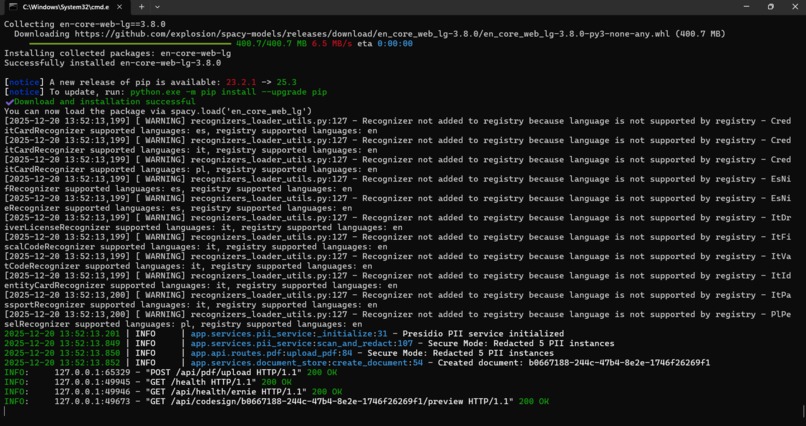
Backend Paddle Screen 2
-
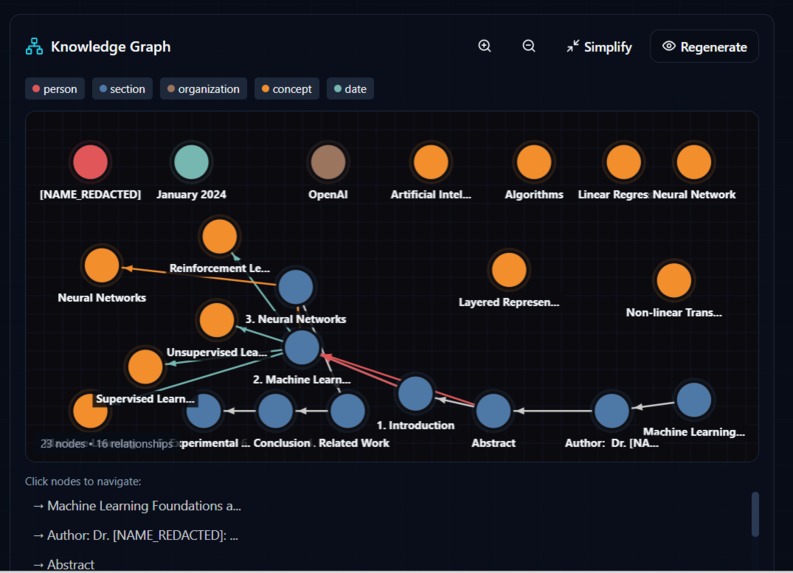
Knowledge Graph


Inspiration
We were frustrated with the limitations of traditional PDF-to-HTML converters. They produce static, inaccessible output that loses all the semantic meaning of the original document. Tables remain as boring text, data stays locked away, and sensitive information gets sent to cloud services without any privacy protection.
When we discovered ERNIE's multimodal vision capabilities on Novita AI, we saw an opportunity to build something revolutionary: a system that doesn't just extract text, but actually sees and understands document structure — detecting tables that should become charts, Q&A sections that could be interactive quizzes, and timelines that deserve visualization.
We also wanted to solve the privacy problem. Why should sensitive documents be sent to cloud AI services? Our solution: process locally first, scrub PII, then only send sanitized content to the cloud.
What it does
DocuMorph AI transforms PDF documents into interactive, responsive HTML webpages through an intelligent pipeline:
1. Privacy-First Local Processing
- Extracts text using PaddleOCR (runs entirely on your machine)
- Detects and redacts PII (emails, phone numbers, SSNs, credit cards) using Presidio
- Nothing sensitive ever leaves your computer
2. ERNIE Vision Analysis
- Sends page images to ERNIE-4.5-VL (vision model)
- AI "sees" the document layout and detects:
- Tables → Suggests bar/line/pie charts
- Q&A sections → Suggests interactive quizzes
- Date sequences → Suggests timeline widgets
- Locations → Suggests interactive maps
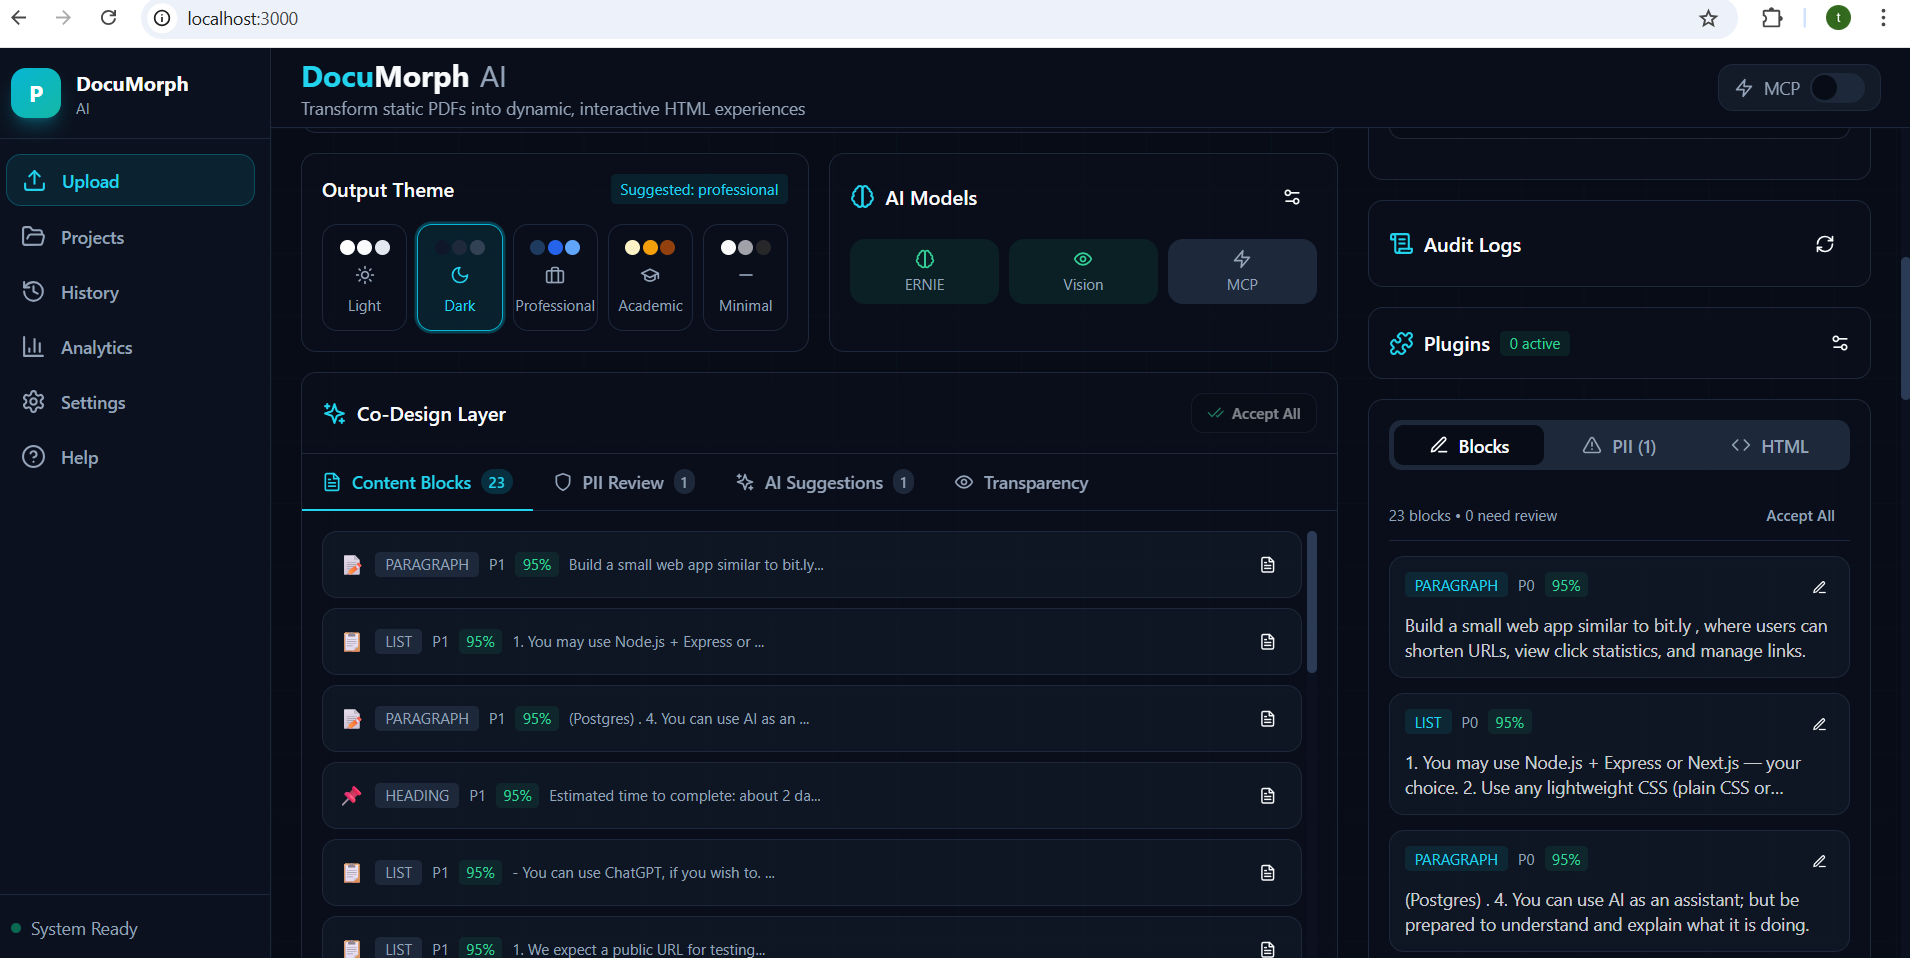
3. Human-in-the-Loop Co-Design
- Review all AI suggestions before generation
- Edit OCR errors, approve/reject PII redactions
- Choose themes, toggle widgets on/off
- You're in control, not the AI
4. Interactive HTML Generation
- ERNIE-4.5 generates semantic HTML with proper structure
- Chart.js visualizations for data
- Interactive quiz widgets
- Responsive design (desktop/tablet/mobile)
- WCAG AA accessible
5. One-Click Deployment
- Deploy to GitHub Pages, Netlify, Vercel, or AWS S3
How we built it
Architecture
┌─────────────────────────────────────────────────────────────┐
│                 LOCAL PROCESSING (Privacy Zone)              │
│  PDF → PaddleOCR → Presidio PII Detection → Content Blocks  │
└─────────────────────────────────────────────────────────────┘
                              ↓
┌─────────────────────────────────────────────────────────────┐
│              CO-DESIGN LAYER (Human Review)                  │
│  Edit blocks • Approve PII • Select theme • Choose widgets  │
└─────────────────────────────────────────────────────────────┘
                              ↓
┌─────────────────────────────────────────────────────────────┐
│                CLOUD AI (Novita AI - ERNIE)                  │
│  ERNIE-4.5 (Text) → Theme analysis, HTML generation         │
│  ERNIE-4.5-VL (Vision) → Page image analysis, detection     │
└─────────────────────────────────────────────────────────────┘
                              ↓
┌─────────────────────────────────────────────────────────────┐
│                      OUTPUT                                  │
│  Interactive HTML • Charts • Quizzes • Responsive Design    │
└─────────────────────────────────────────────────────────────┘
Tech Stack
| Layer | Technologies |
|---|---|
| Backend | FastAPI, Python 3.11, Uvicorn |
| OCR | PaddleOCR (local processing) |
| PII Detection | Microsoft Presidio + spaCy |
| AI Models | ERNIE-4.5 + ERNIE-4.5-VL via Novita AI |
| Frontend | React 18, TypeScript, Vite, Tailwind CSS |
| Real-time | WebSocket for live progress updates |
| Visualization | Chart.js, Recharts |
ERNIE Model Integration
We use two ERNIE models for true multimodal processing:
ERNIE-4.5-21B (Text Model)
- Analyzes document content for theme suggestions
- Generates semantic HTML structure
- Creates accessible, responsive output
ERNIE-4.5-VL-28B (Vision Model)
- Analyzes PDF page images (not just text!)
- Detects visual patterns: tables, charts, Q&A layouts
- Suggests appropriate widget transformations
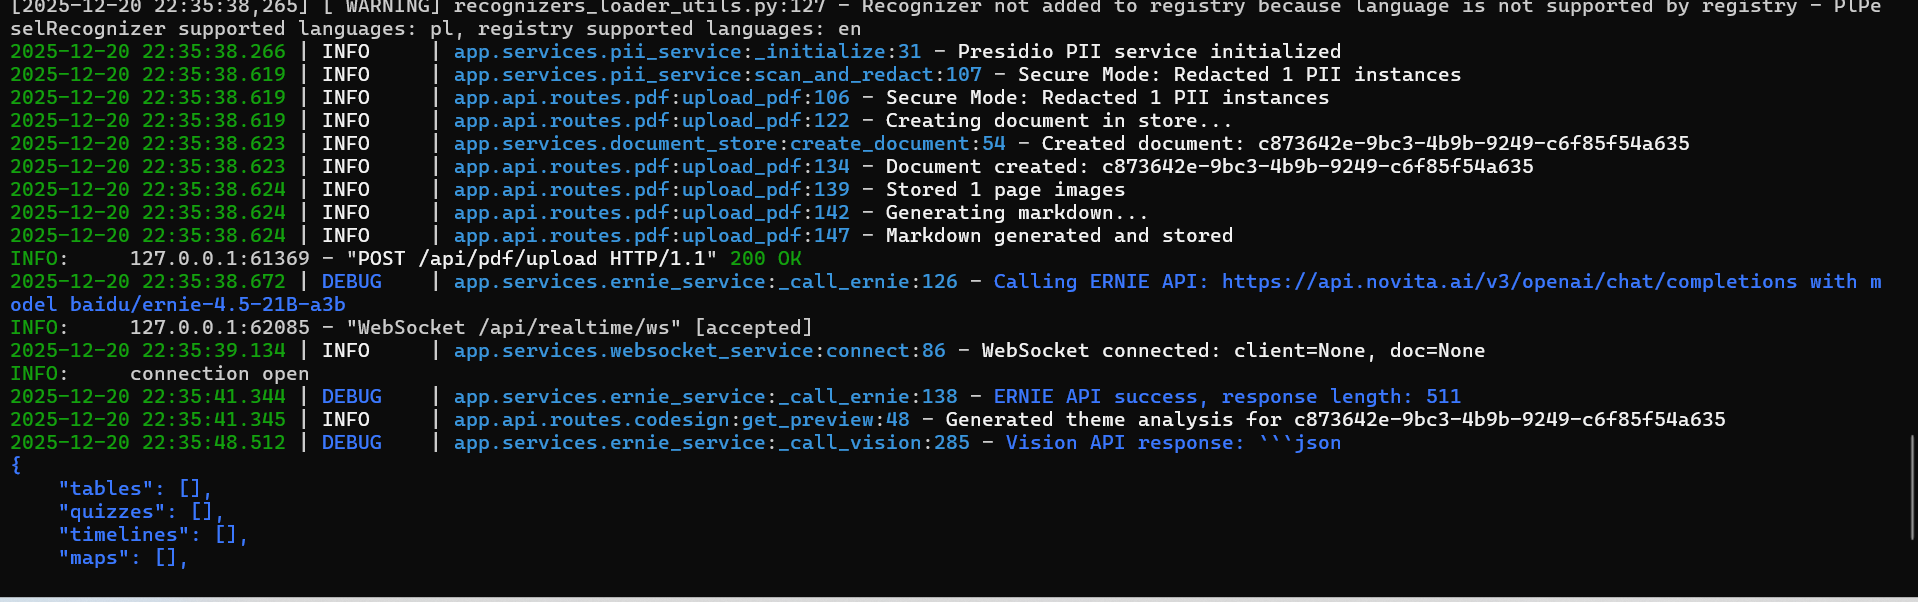
Real API response from our vision analysis: Page 0 - Quiz Detection:
{
  "tables": [],
  "quizzes": [{"question_count": 2, "type": "multiple_choice|true_false"}],
  "timelines": [],
  "maps": [],
  "confidence": 1.0,
  "description": "A quiz document with multiple choice and true/false questions about CPU and Python."
}
Page 1 - Timeline Detection:
{
  "tables": [{"chart_type": "line", "data_summary": "The data shows chronological project milestones over time, from project kickoff to final release."}],
  "quizzes": [],
  "timelines": [{"event_count": 5}],
  "maps": [],
  "confidence": 1.0,
  "description": "The page contains a project timeline with dates and milestones for a project from kickoff to final release."
}
Page 2 - Geographic Location Detection:
{
  "tables": [],
  "quizzes": [],
  "timelines": [],
  "maps": [{"location_count": 4}],
  "confidence": 1.0,
  "description": "The page lists geographic locations and addresses of offices in Bengaluru, Mumbai, New York, and London."
}
Challenges we ran into
1. PaddleOCR Compatibility The newer PaddleX version changed APIs significantly. We had to implement fallback methods and timeout protection to handle different versions gracefully.
2. Real-Time Processing Coordinating WebSocket updates across OCR, PII detection, and AI analysis required careful async handling to provide smooth progress feedback.
3. Vision Model Prompt Engineering Getting ERNIE-VL to return structured JSON for component detection took iteration. We needed specific prompts to identify tables vs. text blocks reliably.
4. Privacy vs. Functionality Balance We wanted maximum privacy (local processing) but also needed cloud AI capabilities. The solution: process and sanitize locally, only send cleaned content to ERNIE.
Accomplishments that we're proud of
✅ True Multimodal AI Usage Not just text — we actually use ERNIE Vision to analyze page images and detect visual patterns.
Privacy-First Architecture Sensitive documents stay local. PII is scrubbed before any cloud calls.
** Complete Working Pipeline** End-to-end: Upload → OCR → PII → Vision Analysis → HTML Generation → Deployment
** Human-in-the-Loop Design** AI suggests, humans decide. No black-box automation.
** Real-Time Feedback** WebSocket updates show exactly what's happening at each step.
🧠 Auto-Generated Knowledge Graph
This feature alone separates DocuMorph AI from 90% of PDF converters. Instead of just extracting text, we build an interactive knowledge graph that shows how concepts, sections, and entities in your document relate to each other. Every knowledge graph is generated live using ERNIE AI. Here's actual server logs from a real document processing:
2026-01-01 22:16:07 | INFO | Generating knowledge graph for document 2bb7c96c-6602-4684-b54b-ebcb53438b97
2026-01-01 22:16:24 | INFO | Generated graph with 23 nodes and 16 edges
POST /api/knowledge-graph/2bb7c96c-6602-4684-b54b-ebcb53438b97/generate HTTP/1.1 200 OK
POST /api/knowledge-graph/2bb7c96c-6602-4684-b54b-ebcb53438b97/simplify HTTP/1.1 200 OK
The AI extracts entities and relationships in ~17 seconds, creating a fully interactive graph visualization.
How It Works
┌─────────────────────────────────────────────────────────────────────────────┐
│                    KNOWLEDGE GRAPH PIPELINE                                 │
├─────────────────────────────────────────────────────────────────────────────┤
│                                                                             │
│  PDF Document                                                               │
│      │                                                                      │
│      ▼                                                                      │
│  ┌─────────────────────────────────────────────────────────────────────┐   │
│  │  ENTITY EXTRACTION (ERNIE AI)                                       │   │
│  │  ─────────────────────────────                                      │   │
│  │  • Sections: Chapter 1, Section 2.1, etc.                           │   │
│  │  • Concepts: Key terms, theories, definitions                       │   │
│  │  • People: Authors, researchers, historical figures                 │   │
│  │  • Dates: Important dates, time periods                             │   │
│  │  • Locations: Places, countries, cities                             │   │
│  │  • Tables/Figures: Data summaries                                   │   │
│  │  • Organizations: Companies, institutions                           │   │
│  └─────────────────────────────────────────────────────────────────────┘   │
│                              │                                              │
│                              ▼                                              │
│  ┌─────────────────────────────────────────────────────────────────────┐   │
│  │  RELATIONSHIP DETECTION (AI-Powered)                                │   │
│  │  ─────────────────────────────────────                              │   │
│  │  • references: "See Section 3 for details"                          │   │
│  │  • builds_on: "Building on concepts from Chapter 1"                 │   │
│  │  • summarizes: "Table X summarizes data from Section Y"             │   │
│  │  • defines: Section defines a concept                               │   │
│  │  • contains: Parent-child hierarchy                                 │   │
│  │  • related_to: Semantic similarity                                  │   │
│  │  • contrasts / supports: Argument relationships                     │   │
│  └─────────────────────────────────────────────────────────────────────┘   │
│                              │                                              │
│                              ▼                                              │
│  ┌─────────────────────────────────────────────────────────────────────┐   │
│  │  INTERACTIVE VISUALIZATION (vis.js Compatible)                      │   │
│  │  ─────────────────────────────────────────────                      │   │
│  │  • Color-coded nodes by entity type                                 │   │
│  │  • Force-directed layout for natural clustering                     │   │
│  │  • Click-to-navigate: Jump to any section instantly                 │   │
│  │  • Hover tooltips with full context                                 │   │
│  │  • Simplify mode for co-design preview                              │   │
│  └─────────────────────────────────────────────────────────────────────┘   │
│                                                                             │
└─────────────────────────────────────────────────────────────────────────────┘
Why This Matters
Traditional PDF converters give you a flat Table of Contents. We give you a semantic map of your document:
| Traditional ToC | DocuMorph Knowledge Graph |
|---|---|
| Linear list of sections | Interactive node-edge visualization |
| No relationships shown | AI-detected references, dependencies |
| Static navigation | Click any node to jump to content |
| Text-only | Color-coded by entity type |
| Manual creation | Auto-generated by ERNIE AI |
Real API Response
When we process a research paper, the knowledge graph API returns real data. Here's actual server output:
2026-01-01 22:16:07 | INFO | Generating knowledge graph for document 2bb7c96c-...
2026-01-01 22:16:24 | INFO | Generated graph with 23 nodes and 16 edges
{
  "document_id": "abc123",
  "nodes": [
    {"id": "entity_section_1", "label": "Introduction", "type": "section", "color": "#4e79a7"},
    {"id": "entity_ai_0", "label": "Machine Learning", "type": "concept", "color": "#f28e2c"},
    {"id": "entity_ai_1", "label": "Neural Networks", "type": "concept", "color": "#f28e2c"},
    {"id": "entity_date_1234", "label": "January 2024", "type": "date", "color": "#76b7b2"}
  ],
  "edges": [
    {"from": "entity_section_1", "to": "entity_ai_0", "type": "defines", "label": "defines"},
    {"from": "entity_ai_1", "to": "entity_ai_0", "type": "builds_on", "label": "builds on"}
  ],
  "metadata": {
    "total_nodes": 24,
    "total_edges": 31,
    "entity_types": ["section", "concept", "person", "date", "table"],
    "relationship_types": ["contains", "precedes", "references", "builds_on", "defines"]
  }
}
Entity Types & Visual Encoding
| Entity Type | Color | Shape | Example |
|---|---|---|---|
| Section | Blue (#4e79a7) | Box | "Chapter 1: Introduction" |
| Concept | Orange (#f28e2c) | Ellipse | "Machine Learning" |
| Person | Red (#e15759) | Circle | "Alan Turing" |
| Date | Teal (#76b7b2) | Diamond | "January 2024" |
| Location | Green (#59a14f) | Triangle | "San Francisco" |
| Table | Yellow (#edc949) | Square | "Table 3: Results" |
| Organization | Brown (#9c755f) | Database | "OpenAI" |
Human-in-the-Loop: Simplify Before Export
Users can preview and simplify the graph in the co-design layer:
# Simplify to top 15 nodes, focusing on sections and concepts
POST /api/knowledge-graph/{id}/simplify
{
  "max_nodes": 15,
  "entity_types": ["section", "concept"]
}
This ensures the final HTML doesn't overwhelm readers with a 100-node graph — they see a clean, navigable overview.
Frontend Integration
The React frontend renders the knowledge graph using vis.js with click-to-navigate:
// Click any node to jump to that section in the document
network.on('click', (params) => {
  if (params.nodes.length > 0) {
    const node = graph.nodes.find(n => n.id === params.nodes[0]);
    if (node.data.block_id) {
      document.getElementById(node.data.block_id).scrollIntoView({ behavior: 'smooth' });
    }
  }
});
What we learned
- ERNIE Vision is powerful: It can understand document layouts, not just read text
- Privacy and AI can coexist: Local preprocessing + cloud AI is a viable pattern
- Human oversight matters: AI suggestions with human approval beats full automation
- Novita AI makes ERNIE accessible: Easy API access with generous free credits
What's next for DocuMorph AI
- More widget types: Flowcharts, org charts, Gantt charts
- Batch processing: Handle multiple PDFs at once
- Template marketplace: Share and download HTML themes
- Collaboration: Multiple users co-designing the same document
- Mobile app: Process PDFs directly from phone camera
Built With
- ernie
- ernie-4.5-vl
- novita-ai
- fastapi
- python
- react
- typescript
- paddleocr
- presidio
- websocket
- tailwindcss
- chartjs
Built With
- ernie
- ernie-4.5-vl
- fastapi
- novita-ai
- paddleocr
- presidio
- python
- react
- tailwindcss
- typescript
- websocket


Log in or sign up for Devpost to join the conversation.