Inspiration
DocuLink is inspired by Obsidian, which visualizes data through graphs. Obsidian does an excellent job of showing the relationships between personal data, but its focus is on individual use. On the other hand, Confluence stores all the crucial company data, and this data is created collaboratively by coworkers. This means that data can sometimes be fragmented, making it harder to connect the dots across different teams and departments.
For example, one department may create documentation about a new product feature, while another might write a similar document without knowing about the first one. This leads to duplicated efforts and confusion.
Our goal with DocuLink is to solve this problem by showing the relationships between documents, enabling users to quickly discover relevant connections and avoid redundant work.
What it does
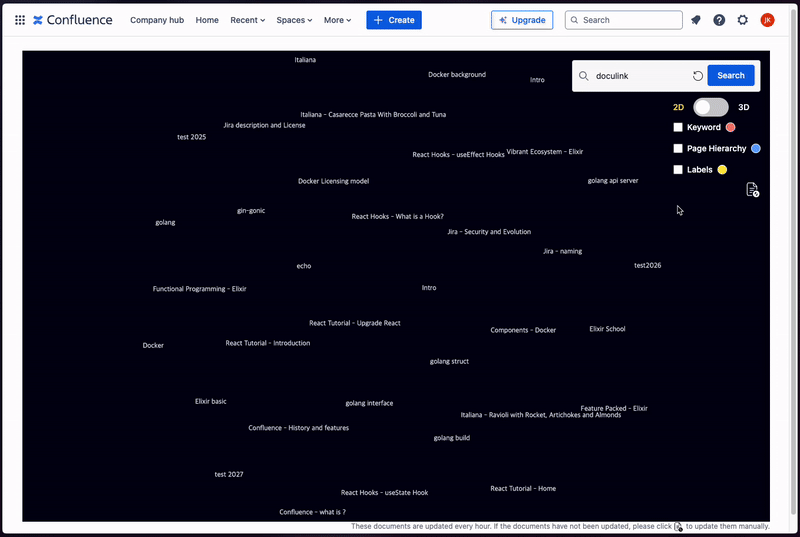
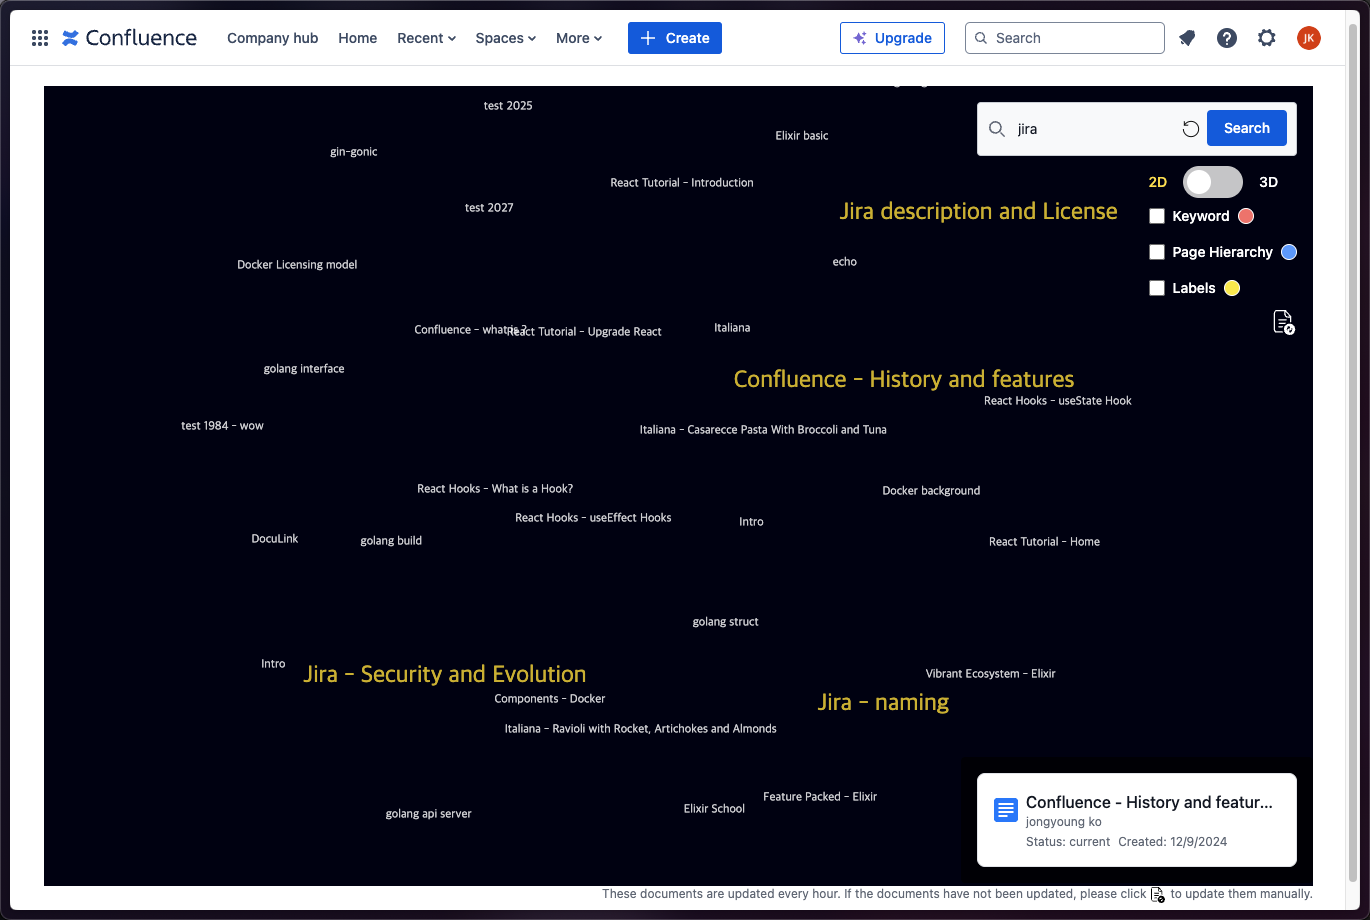
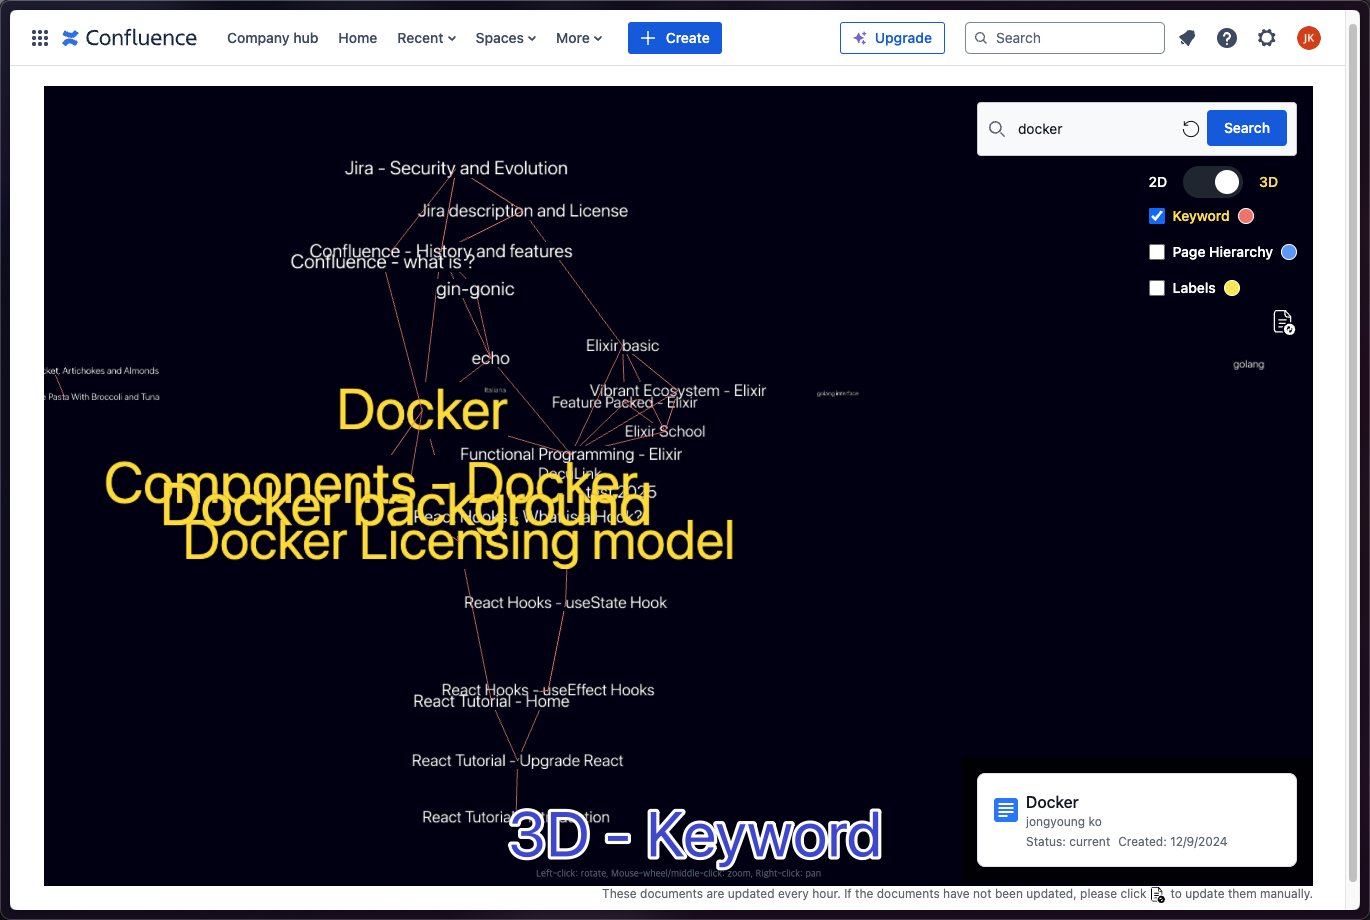
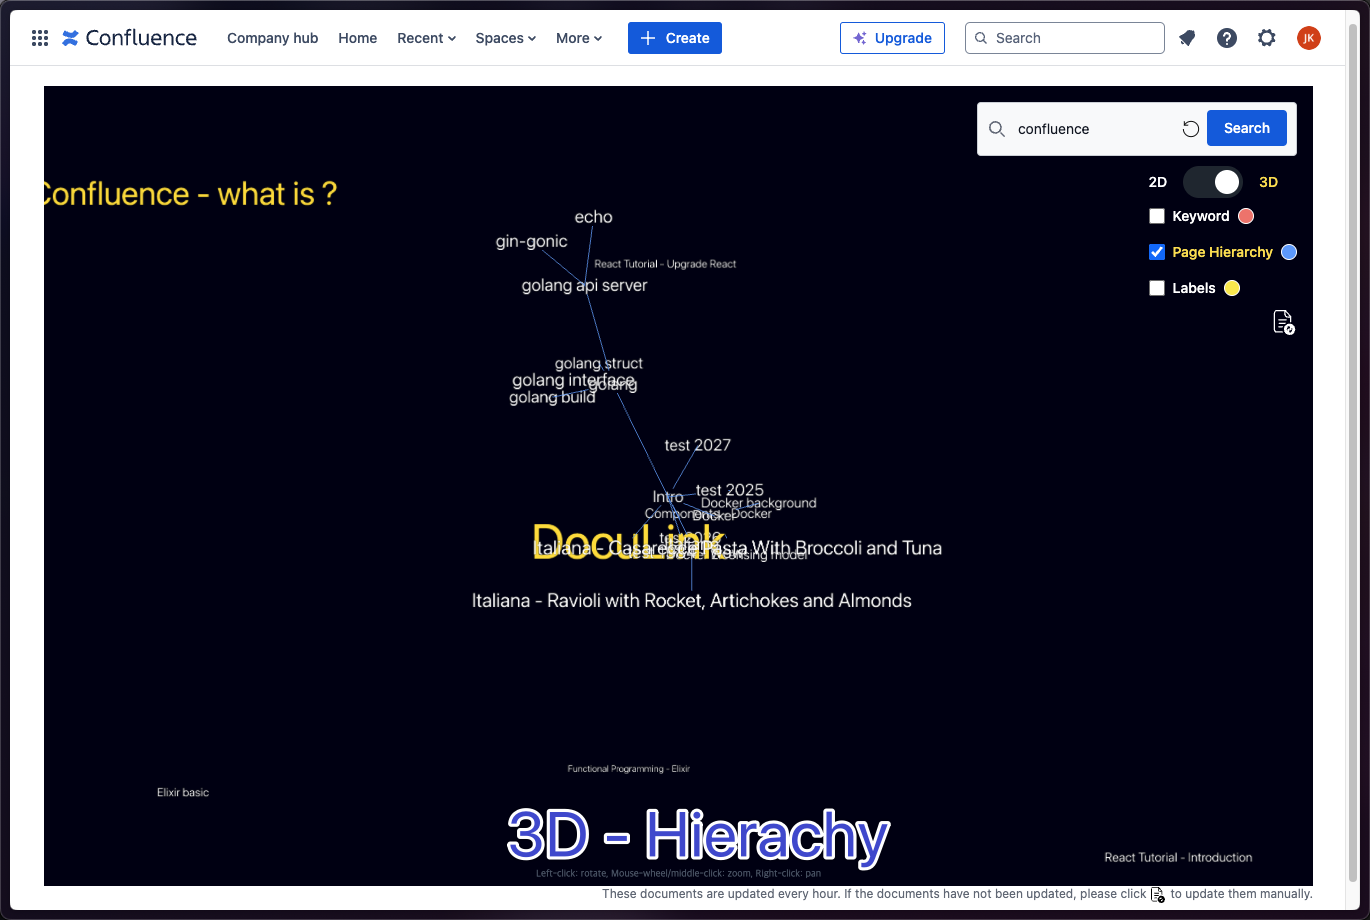
Graph Visualization: Displays a 2D or 3D graph that connects documents, showing their relationships in a visually intuitive way. This allows users to easily navigate through the network of documents and understand how different pieces of content are related.
Search Results Display: When a user performs a search, the search results are highlighted directly on the graph, making it easy to find relevant documents and see their connections within the broader context.
Document Information: When the user hovers over a node in the graph, important information about the document (e.g., title, author, created date) is displayed. This provides quick access to key details without needing to open each document individually.
How we built it
We built the Confluence application using Forge, a platform that provides basic examples and makes it easy to develop apps quickly. This was a great help in speeding up the development process.
We used Forge’s scheduledTrigger to analyze Confluence documents and detect links between them. The identified documents and their links were then stored in a storage system. We developed an API to serve this stored data to the frontend.
On the frontend, the data is used to visualize the relationships between documents in the form of an interactive graph, making it easy to explore and understand how different pieces of content are connected.
Challenges we ran into
- More Diverse and Accurate Document Connections: It was challenging to extract meaningful links from Confluence's diverse and complex document structures. We addressed this by using multiple link categories. Since it was difficult to extract a large number of meaningful connections using just one category, we worked on extracting an appropriate number of links across various categories.
- Clear UI: As the number of document connections increased, the graph became more complex and difficult to read. To solve this, we introduced a search function that allows users to more easily find the information they want to see.
What we learned
Atlassian Products: Through this project, we gained a deeper understanding of the APIs and features provided by various Atlassian products. This hands-on experience will be invaluable as we continue to use these tools in the future.
Rovo AI: Combining collaboration tools with AI has shown great potential to deliver fascinating outcomes. Although we attempted to integrate Rovo into our project and explored its documentation, we were unable to fully implement it. However, this experience allowed us to explore its possibilities and think about future potential applications.
What's next for DocuLink
Looking forward, we plan to expand DocuLink with new features:
- More linking options:
- Links created by Rovo (or other automation tools)
- Links based on page labels, enhancing the ability to connect related content.
- Enhanced document information:
- show more document metadata


")
![조수현[ 학부재학 / 컴퓨터융합소프트웨어학과 ] ](https://lh3.googleusercontent.com/a/ACg8ocId7bAP-9kt4HXSi-bxI_PrDz0mEM9pZNxClrhWFW9v4OsQjA=s96-c?type=square "조수현[ 학부재학 / 컴퓨터융합소프트웨어학과 ] ")


Log in or sign up for Devpost to join the conversation.