-
-
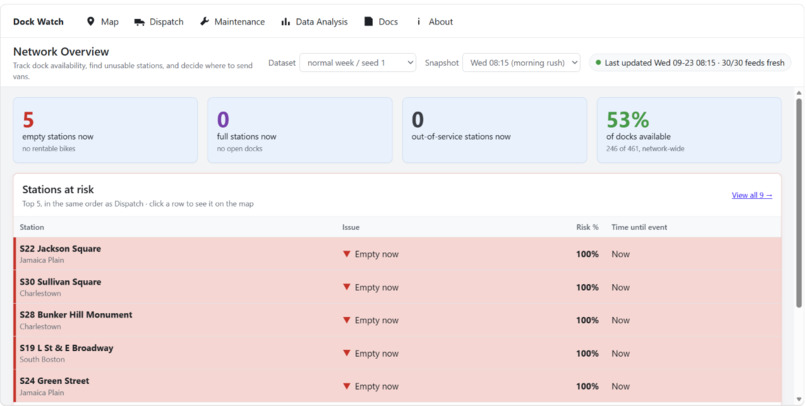
Main Page
-
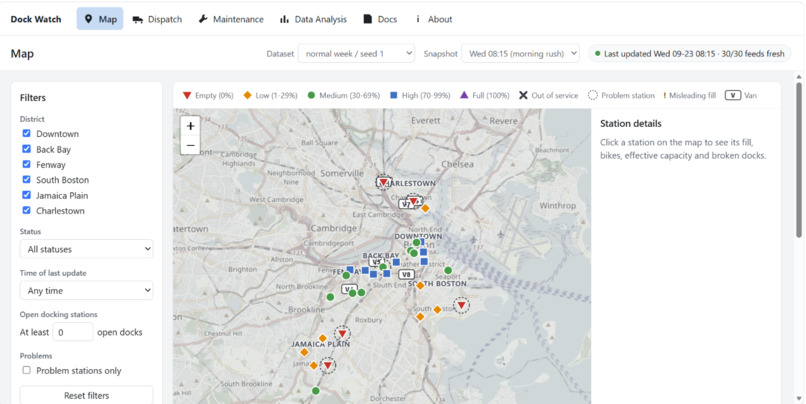
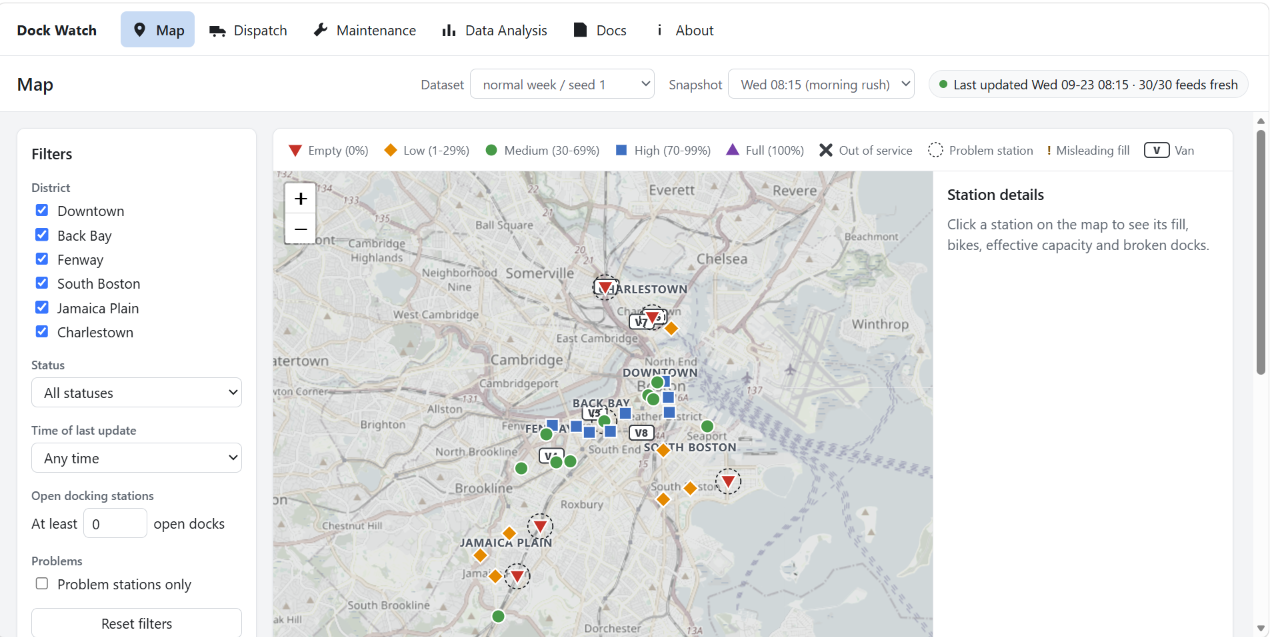
Map Page
-
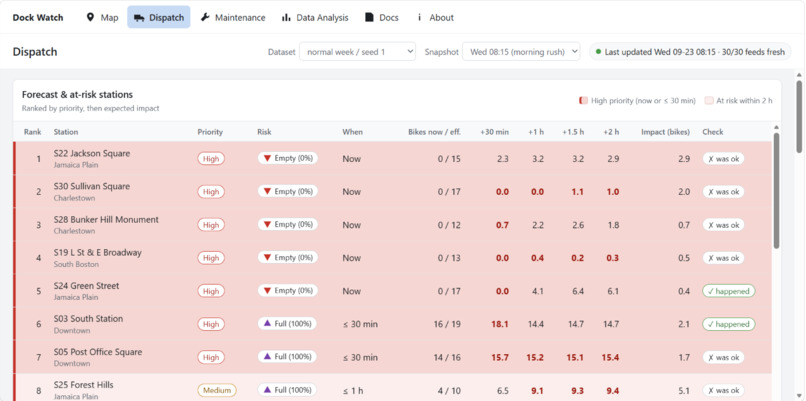
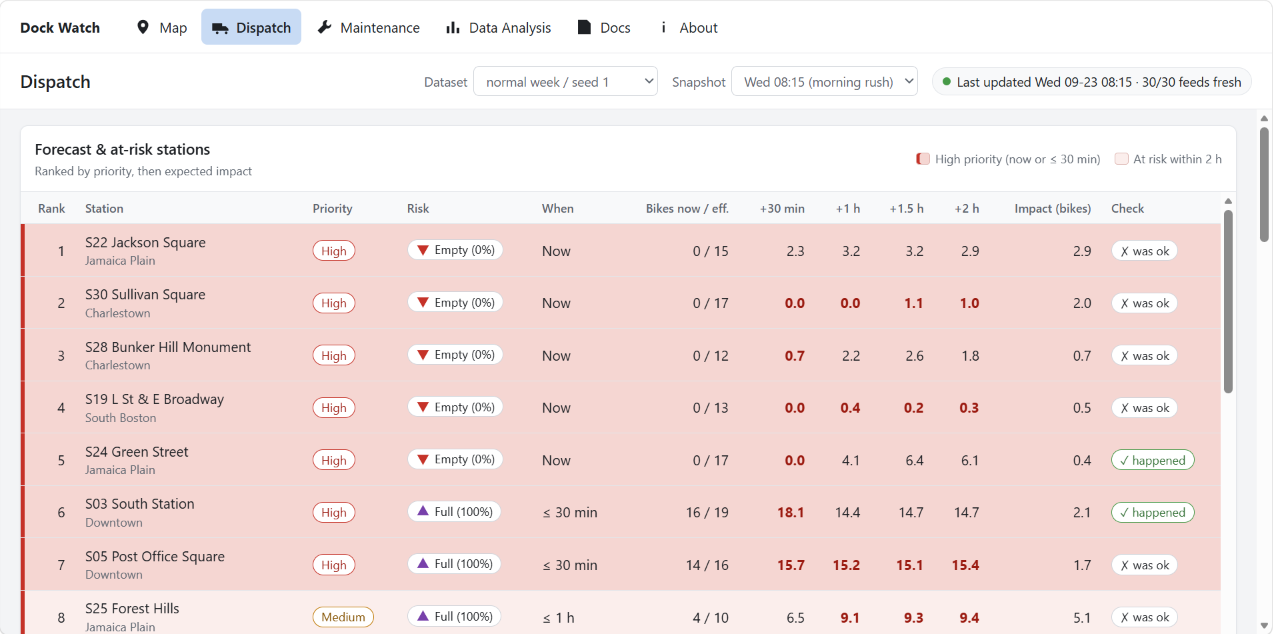
Dispatch Page
-
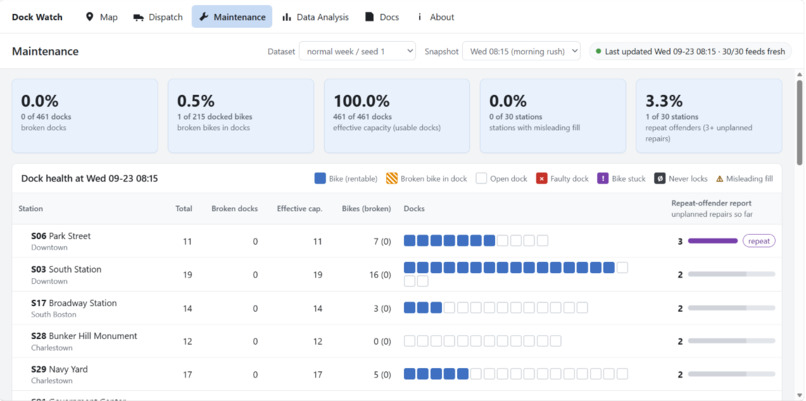
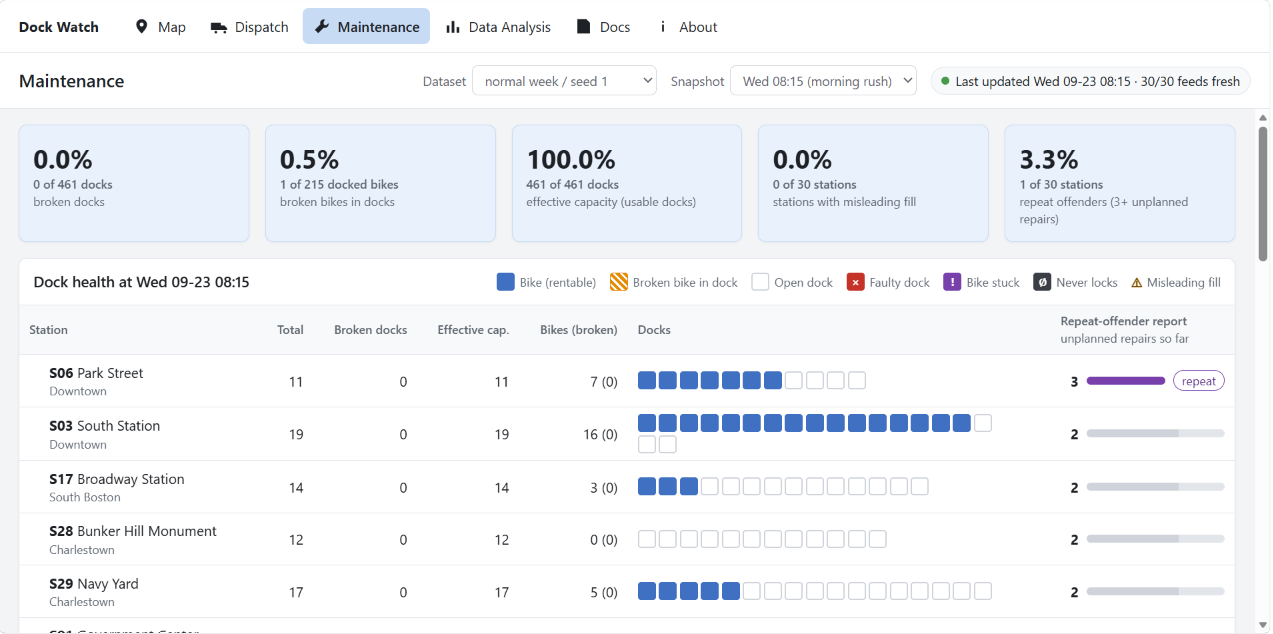
Maintenance Page
-
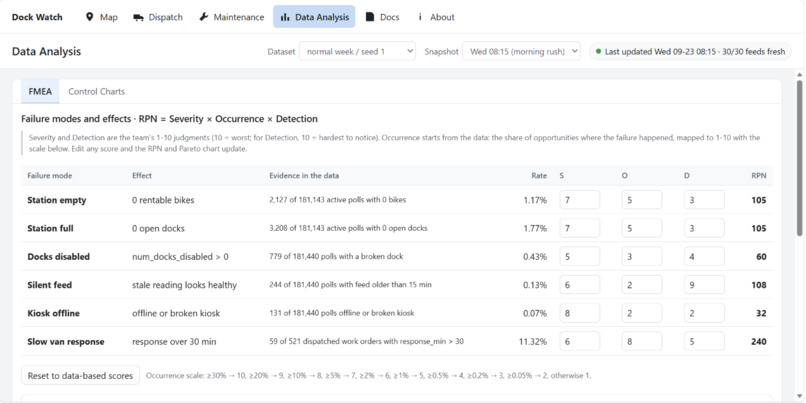
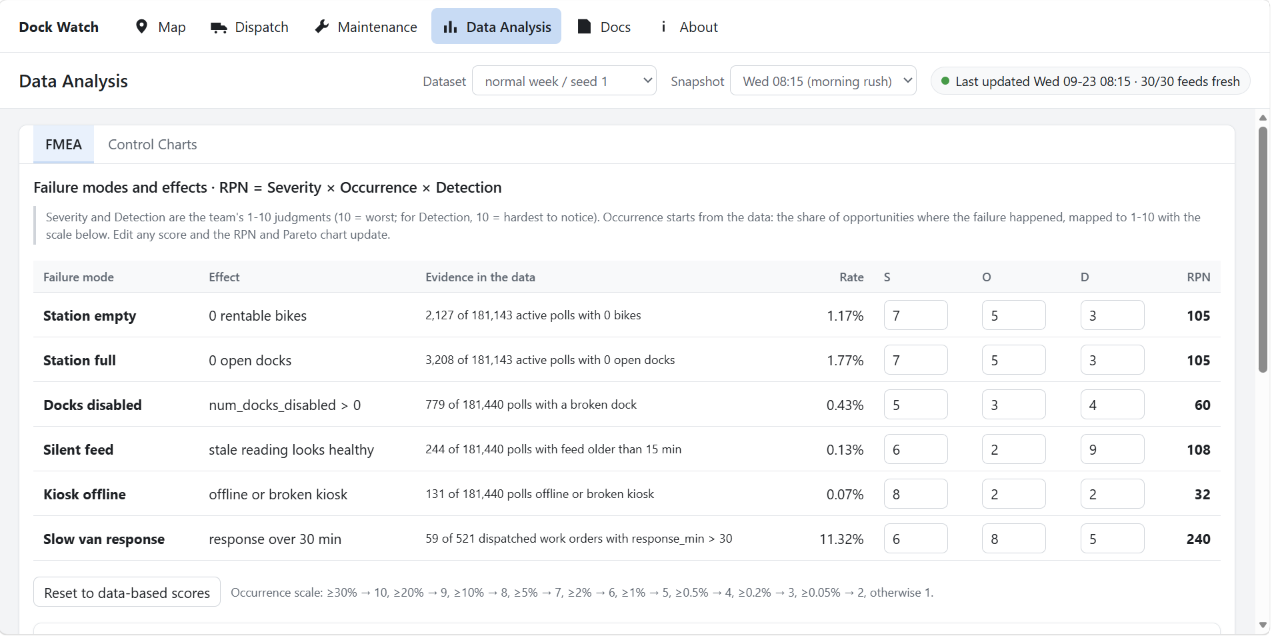
Data Analysis Page
-
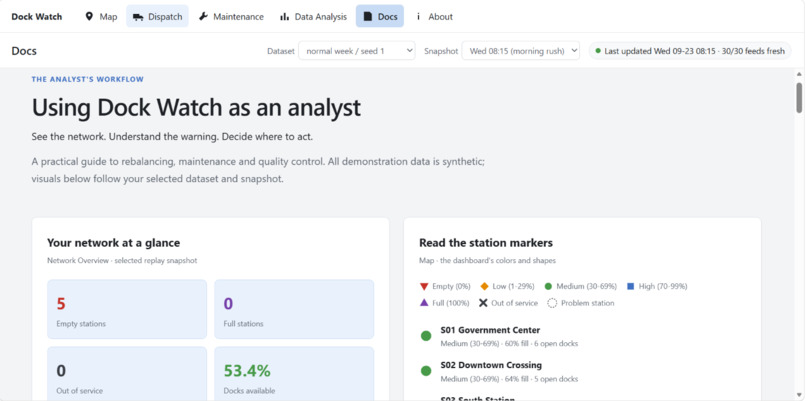
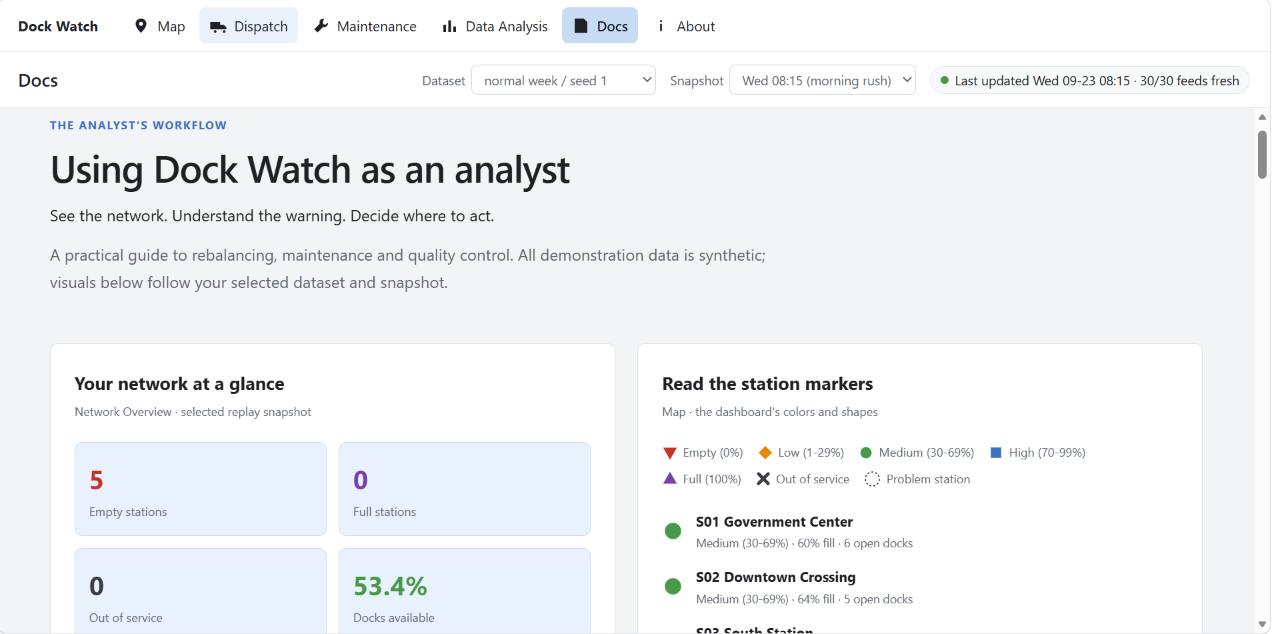
Documentation Page
Inspiration
Municipal bikeshare systems face a recurring operational challenge: during rush hour, some stations run out of bikes while others run out of available docks. Without reliable station data or a centralized dashboard, planners may struggle to identify problems early and dispatch maintenance or rebalancing vans where they are needed most.
Our project, Dock Watch, explores how a data-driven operations dashboard could help address this problem. We wanted to go beyond displaying station availability and build a tool that helps planners understand what is going wrong, anticipate what might happen next, and decide where to focus their efforts.
What We Built
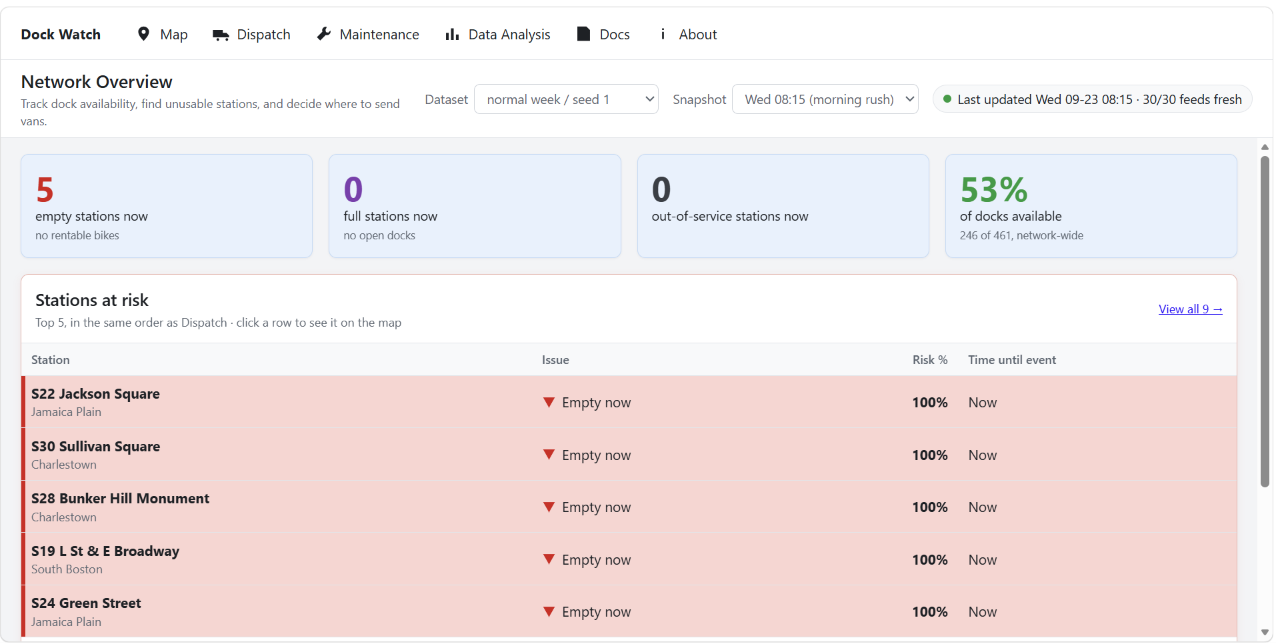
Dock Watch is a desktop-first dashboard for monitoring and managing a municipal bikeshare network. Its overview page summarizes network conditions, highlights stations at risk, and provides quick access to the tools planners need to investigate and respond to problems.
The dashboard includes several interconnected features:
- Network overview and live map: Visualize station availability, identify empty and full stations, and locate stations that are out of service.
- Dock health monitoring: Examine individual dock conditions and account for broken docks when calculating a station's effective capacity, preventing faulty equipment from distorting availability estimates.
- Stockout and fullout analysis: Track when stations run out of bikes or available docks, examine how long these events last, and identify recurring rush-hour patterns.
- Forecasting and dispatch support: Use historical patterns to identify stations at risk of becoming empty or full and support decisions about bike rebalancing and maintenance tasks.
- Maintenance tracking: Organize repair tickets, identify repeat problems, and monitor repair performance.
- Failure analysis: Apply Failure Mode and Effects Analysis (FMEA), Pareto analysis, and statistical control charts to investigate recurring issues and help prioritize operational improvements.
How We Built It
We developed the dashboard around synthetic datasets representing 20 stations across four districts, with observations collected at five-minute intervals over multiple weeks. The datasets model commuter behavior, weekday morning and evening rush hours, station outages, and broken docks. We also incorporated overnight bike redistribution by vans to represent how the network could be rebalanced before the next day's commute.
Building realistic data was an important part of the project because the challenge assumes that agencies lack existing telemetry and monitoring infrastructure. Synthetic data allowed us to demonstrate how station observations could be transformed into useful operational insights without claiming access to a real municipal bikeshare system.
We iteratively refined the application across multiple rounds of development. We improved the commuter-flow and overnight redistribution models, adjusted statistical control-chart groupings, streamlined dispatch and maintenance views, and added an overview page that brings the most important network conditions and risks together. We also standardized the interface's color system and preserved distinct station-status markers to improve consistency and readability.
Challenges and What We Learned
One challenge was connecting station-level observations to meaningful network-wide decisions. A station's reported dock count alone does not necessarily reflect its usable capacity: broken docks can make a station appear full or empty when its actual operating capacity is different. Accounting for these failures helps make availability metrics more informative.
Another challenge was designing the dashboard to support action rather than simply display information. Forecasts, risk rankings, maintenance records, and dispatch tools need to work together so that planners can move from identifying a problem to deciding what to do about it.
The project also demonstrated the importance of realistic data assumptions and careful statistical analysis. Commuter flows, rush-hour patterns, station failures, and overnight redistribution all affect how well a monitoring system represents network behavior.
Ultimately, Dock Watch explores how data collection, visualization, forecasting, and reliability-engineering methods can be combined into a practical decision-support tool. By making station problems easier to identify and prioritize, the dashboard aims to help bikeshare operators respond more strategically to service disruptions and improve the availability of bikes and docks across the network.

Log in or sign up for Devpost to join the conversation.