Inspiration
I love using APIs and Postman, this hack has given opportunity to make something using datasets which we can Visualize into charts, Graphs, Maps.
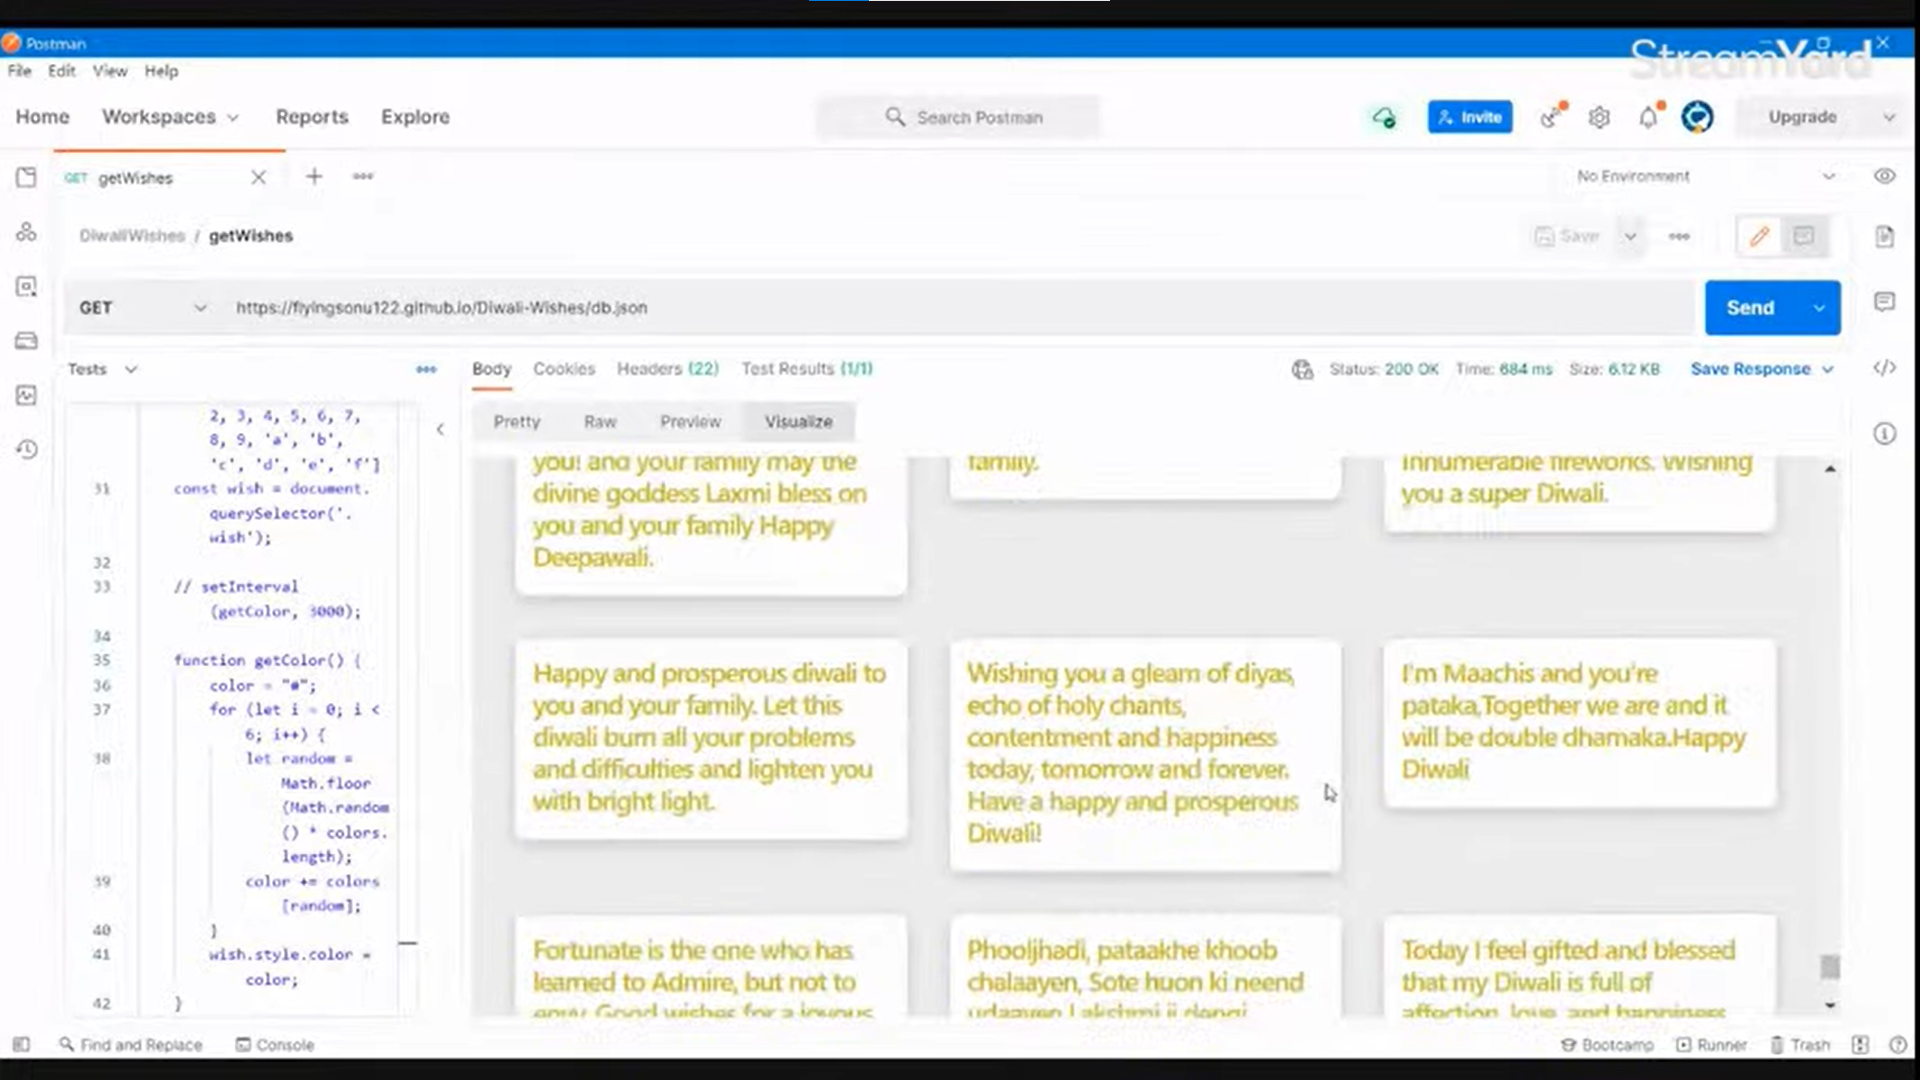
What it does
It uses Postman’s Visualizer feature to see your requested data in postman workspace using Html, CSS, and JavaScript.
How we built it
I build it using postman’s Visualizer feature.
Challenges we ran into
Initially, it was difficult for me to write tests but I watched demo video from Postman Blog.
Accomplishments that we're proud of
I am happy using Postman’s Visualizer feature to make something interesting. further I will use it make something big and spectacular.
What we learned
I learned about postman workspace, how to make collection and requests and how to write tests.
What's next for Diwali Wishes
I will make it more exciting.
Built With
- postman
- visualizer


Log in or sign up for Devpost to join the conversation.