Inspiration
The Divvy app only provides real-time availability for bikes currently docked at docking stations, making it difficult to predict when and where bikes will be available, especially during high-demand periods (summer). We adapted the k-means clustering algorithm in order to construct "path clusters" based on common routes taken at specific months/days/hours, using a 4D Euclidean distance metric to evaluate the similarity of paths.
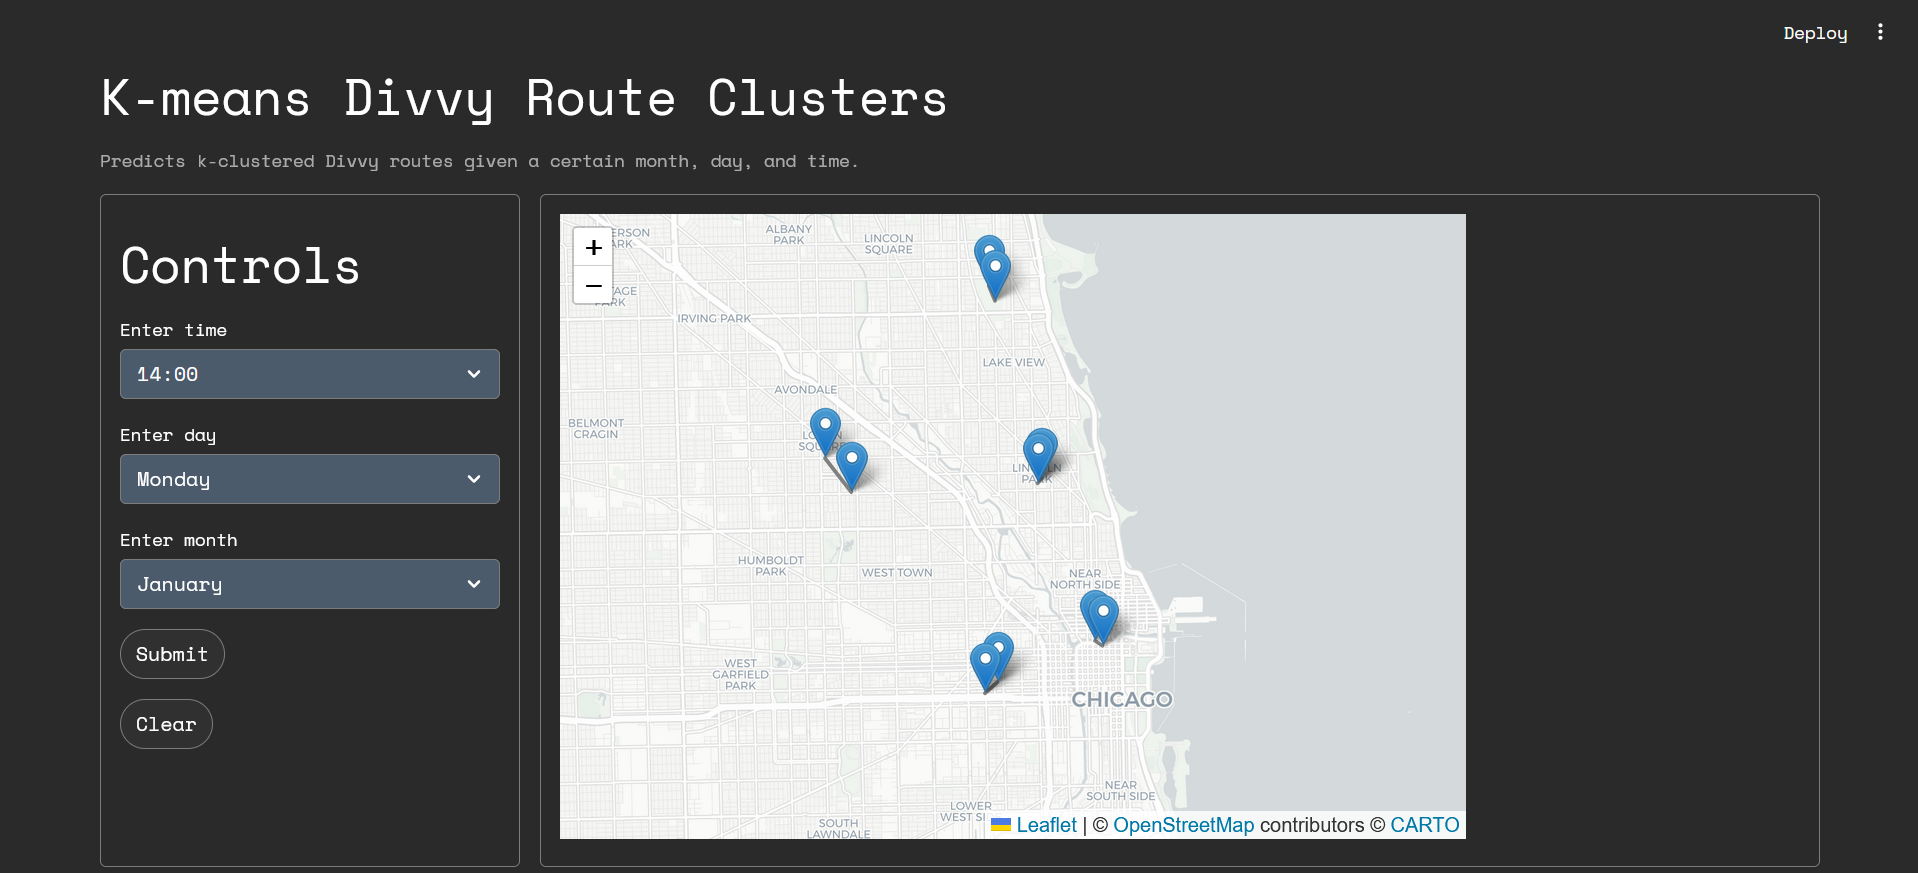
What it does
K-Means Bike answers the question: where do Chicagoans bike, and when? On a clean, interactive map, it displays the most common Divvy bike routes taken on any given month, day of the week, and time of day prompted by the user. It tells the stories of students at university campuses across Chicago and Evanston taking Divvy bikes to classes, Northsiders exploring the beautiful trails spanning West Ridge Nature Park, and 9-to-5ers heading from the Loop to River North for happy hours. Beat the crowd on nice sunny days, optimize your morning commute, and know which bike stations to avoid at any given time.
How we built it
K-Means Bike was developed entirely using Python:
Pandas, Scikit-Learn: backend data processing, machine learning algorithm
Folium: web map development
Streamlit: frontend framework, UI
DigitalOcean: deployment
Challenges we ran into
We were challenged by the computational cost of wrangling, loading, training on, and predicting on a large dataset (5.9 million observations), which lead to many failed push and pull attempts on GitHub due to their 100MB file size limit.
We ran into issues with our web hosting provider, which prevented us from properly deploying on our intended .tech domain.
One of our members is a first-time hackathon competitor, and faced the challenge of learning the functionalities of Streamlit and Folium on the go.
Accomplishments that we're proud of
Successfully processed 5.9 million observations from Divvy datasets by using the pickle file type to strongly compress dataframes in working around the GitHub file size limit.
What we learned
We learned how to use Folium and Streamlit to display the routes visually on a map for the users. We practiced designating different scripts to members of the team (frontend, backend) and connecting interlocking pieces together without complete scripts. We learned how to train a clustering algorithm using a subset of the full dataset in order to predict future results to a sufficient degree of accuracy.
What's next for K-Means Bike
Additional Variables: We intend to take into account more factors through our predictive models, such as weather, traffic, or construction.
Thumbnail: Photo by Luis Ayala on Unsplash.
Built With
- folium
- pandas
- python
- scikit-learn
- streamlit

Log in or sign up for Devpost to join the conversation.