-
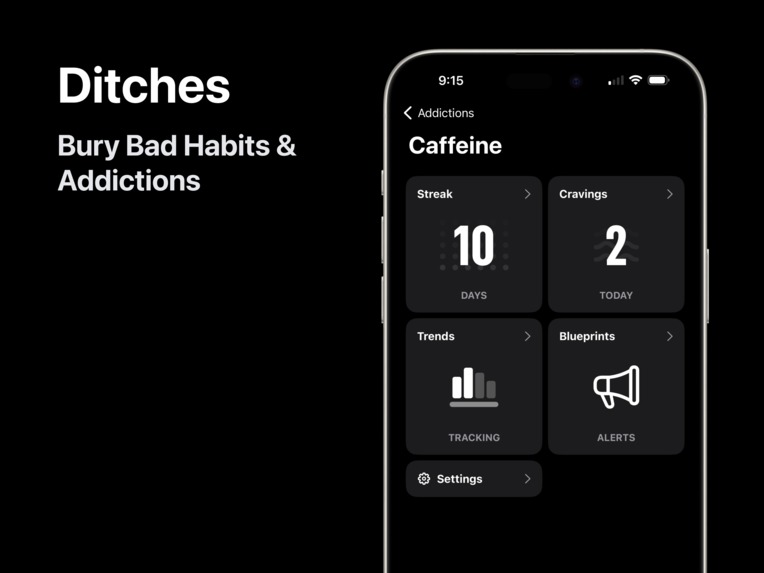
Addiction Overview Screen
-
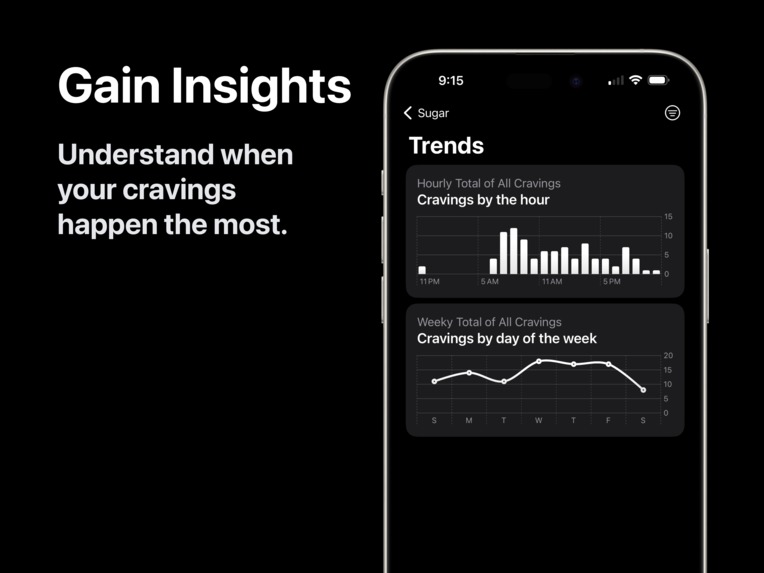
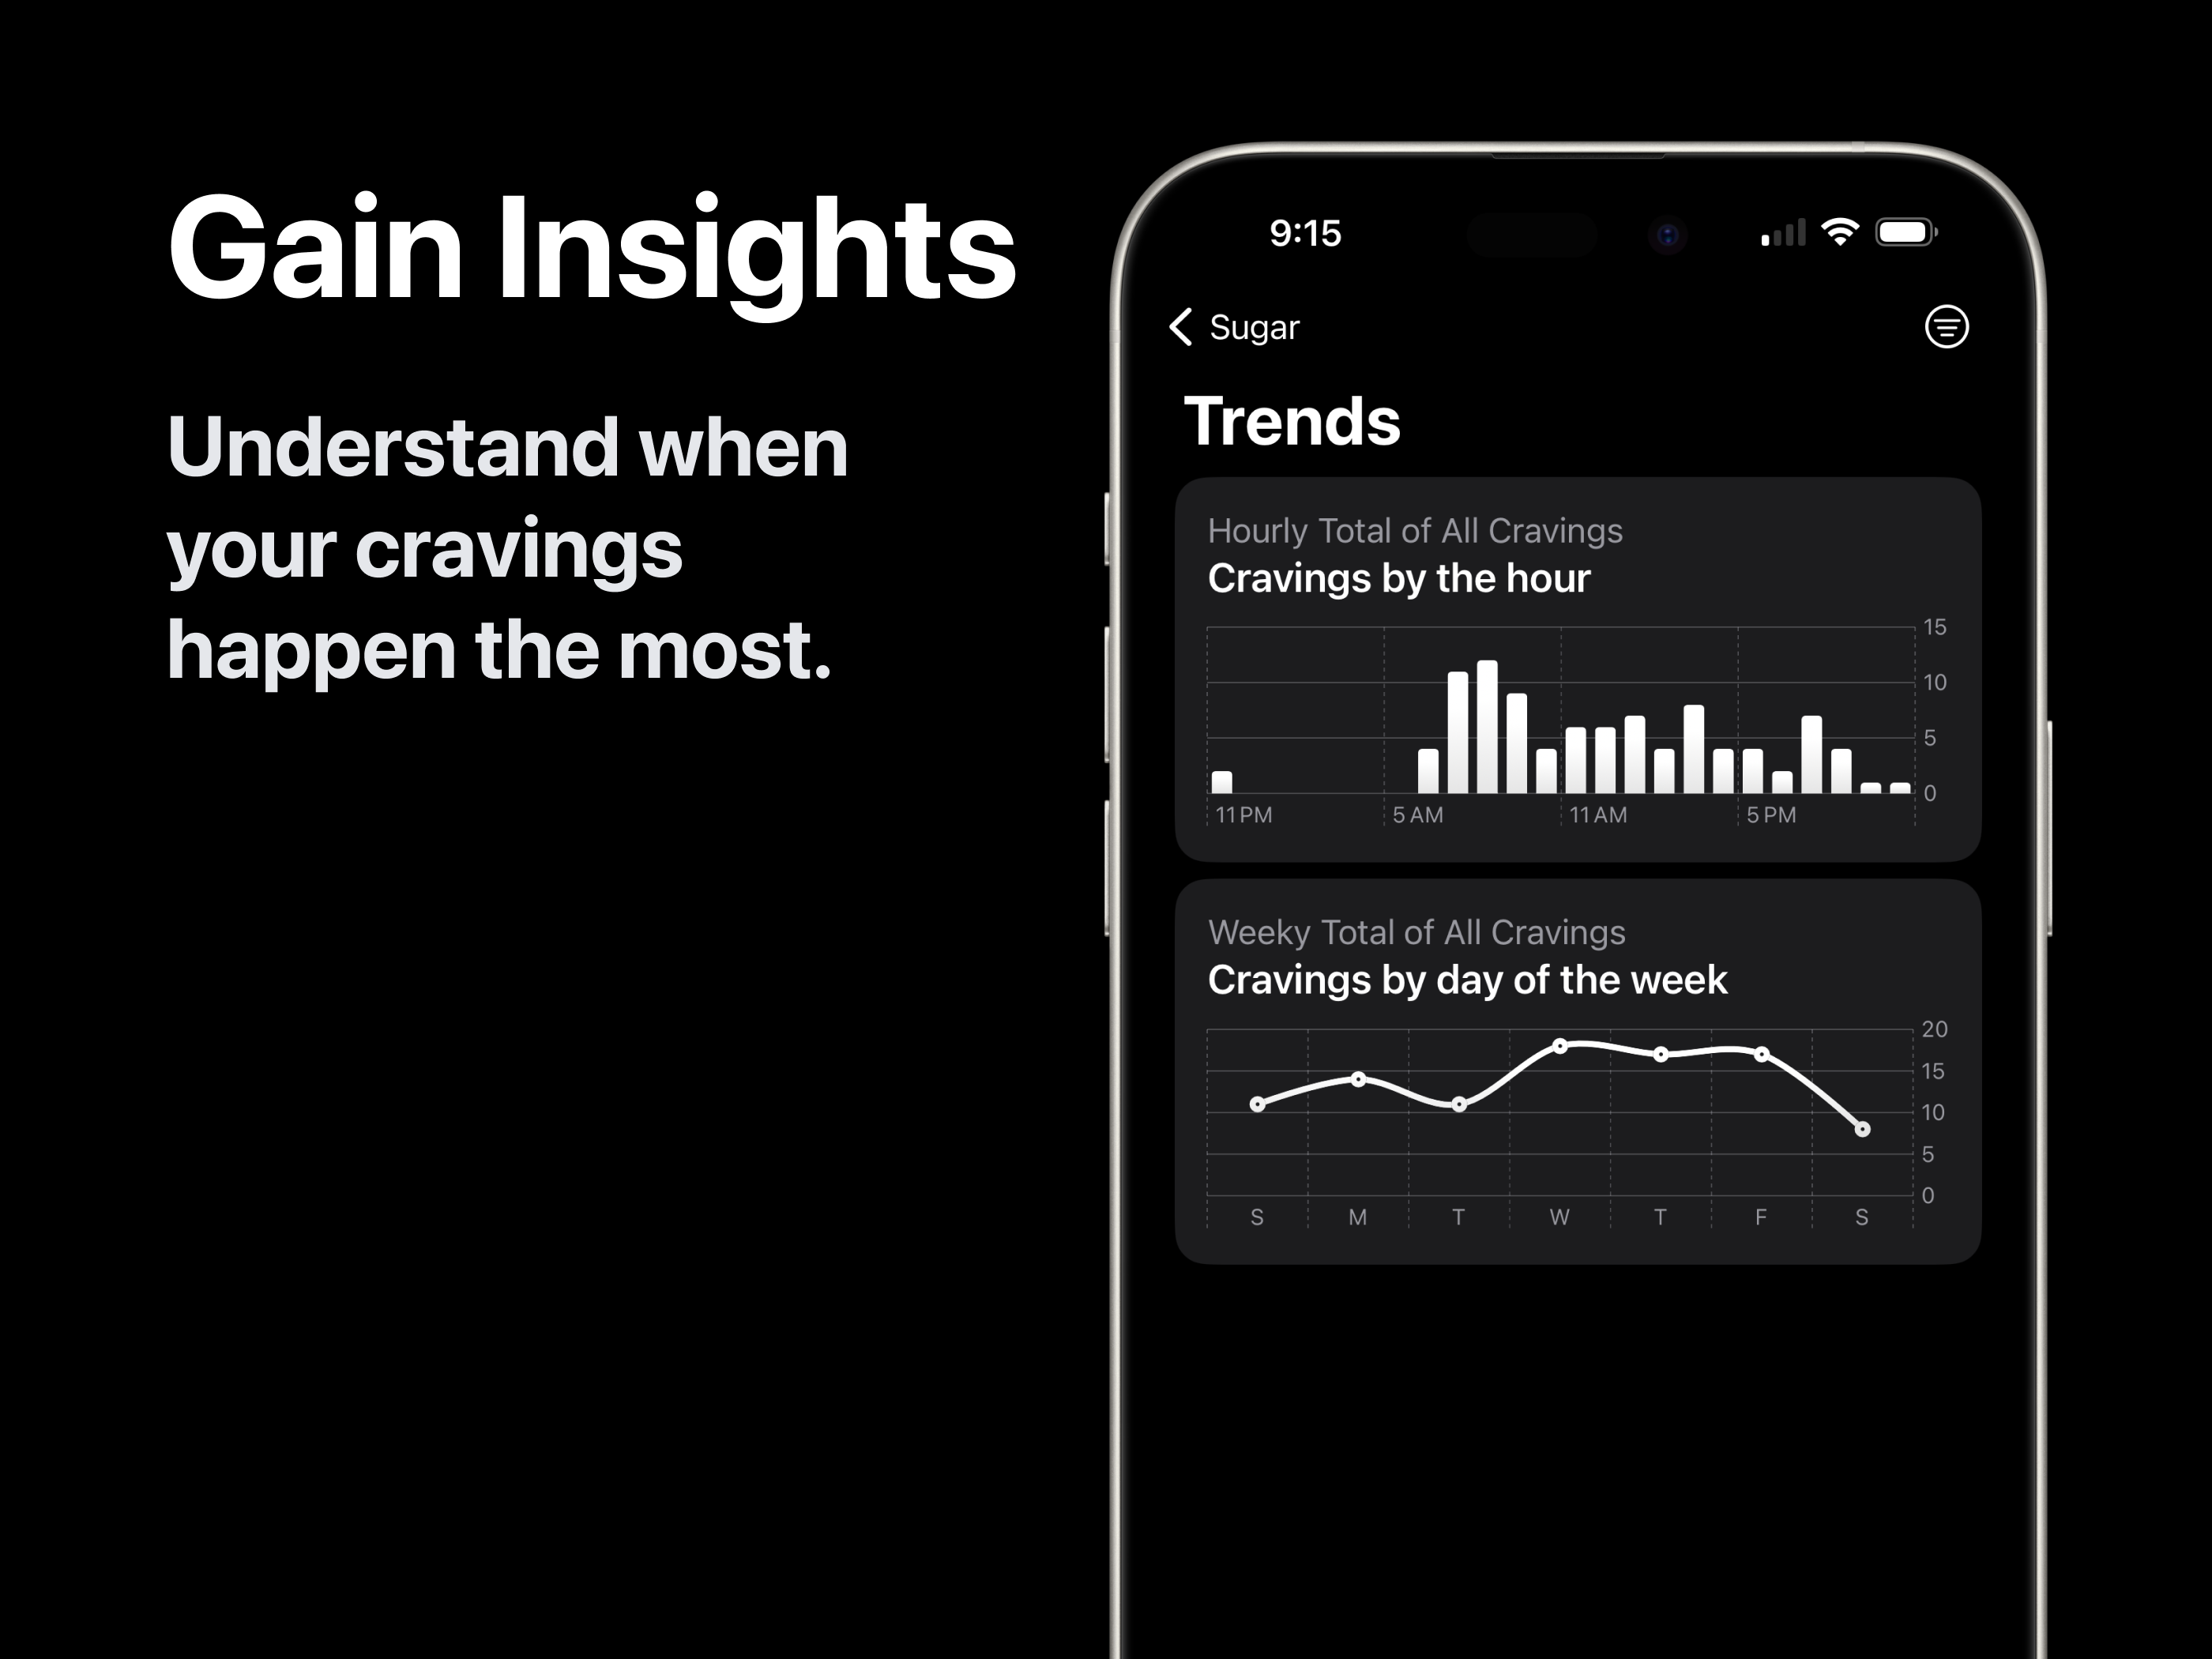
Insights Screen
-
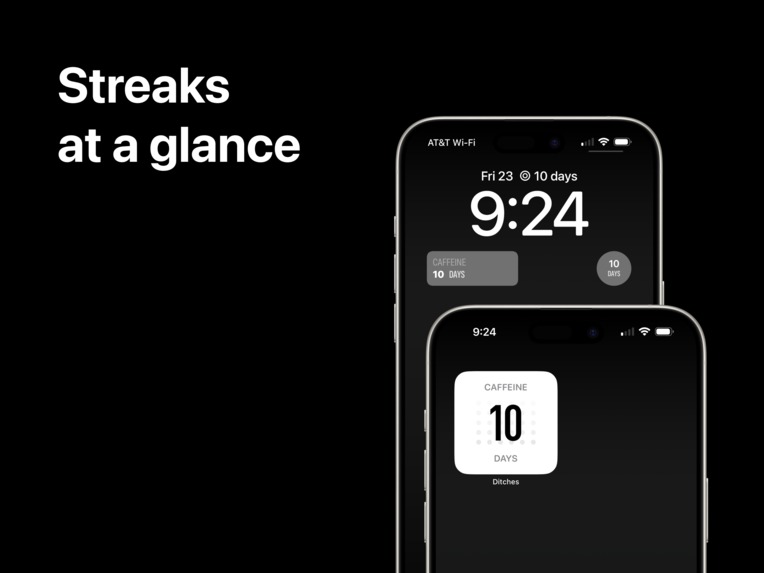
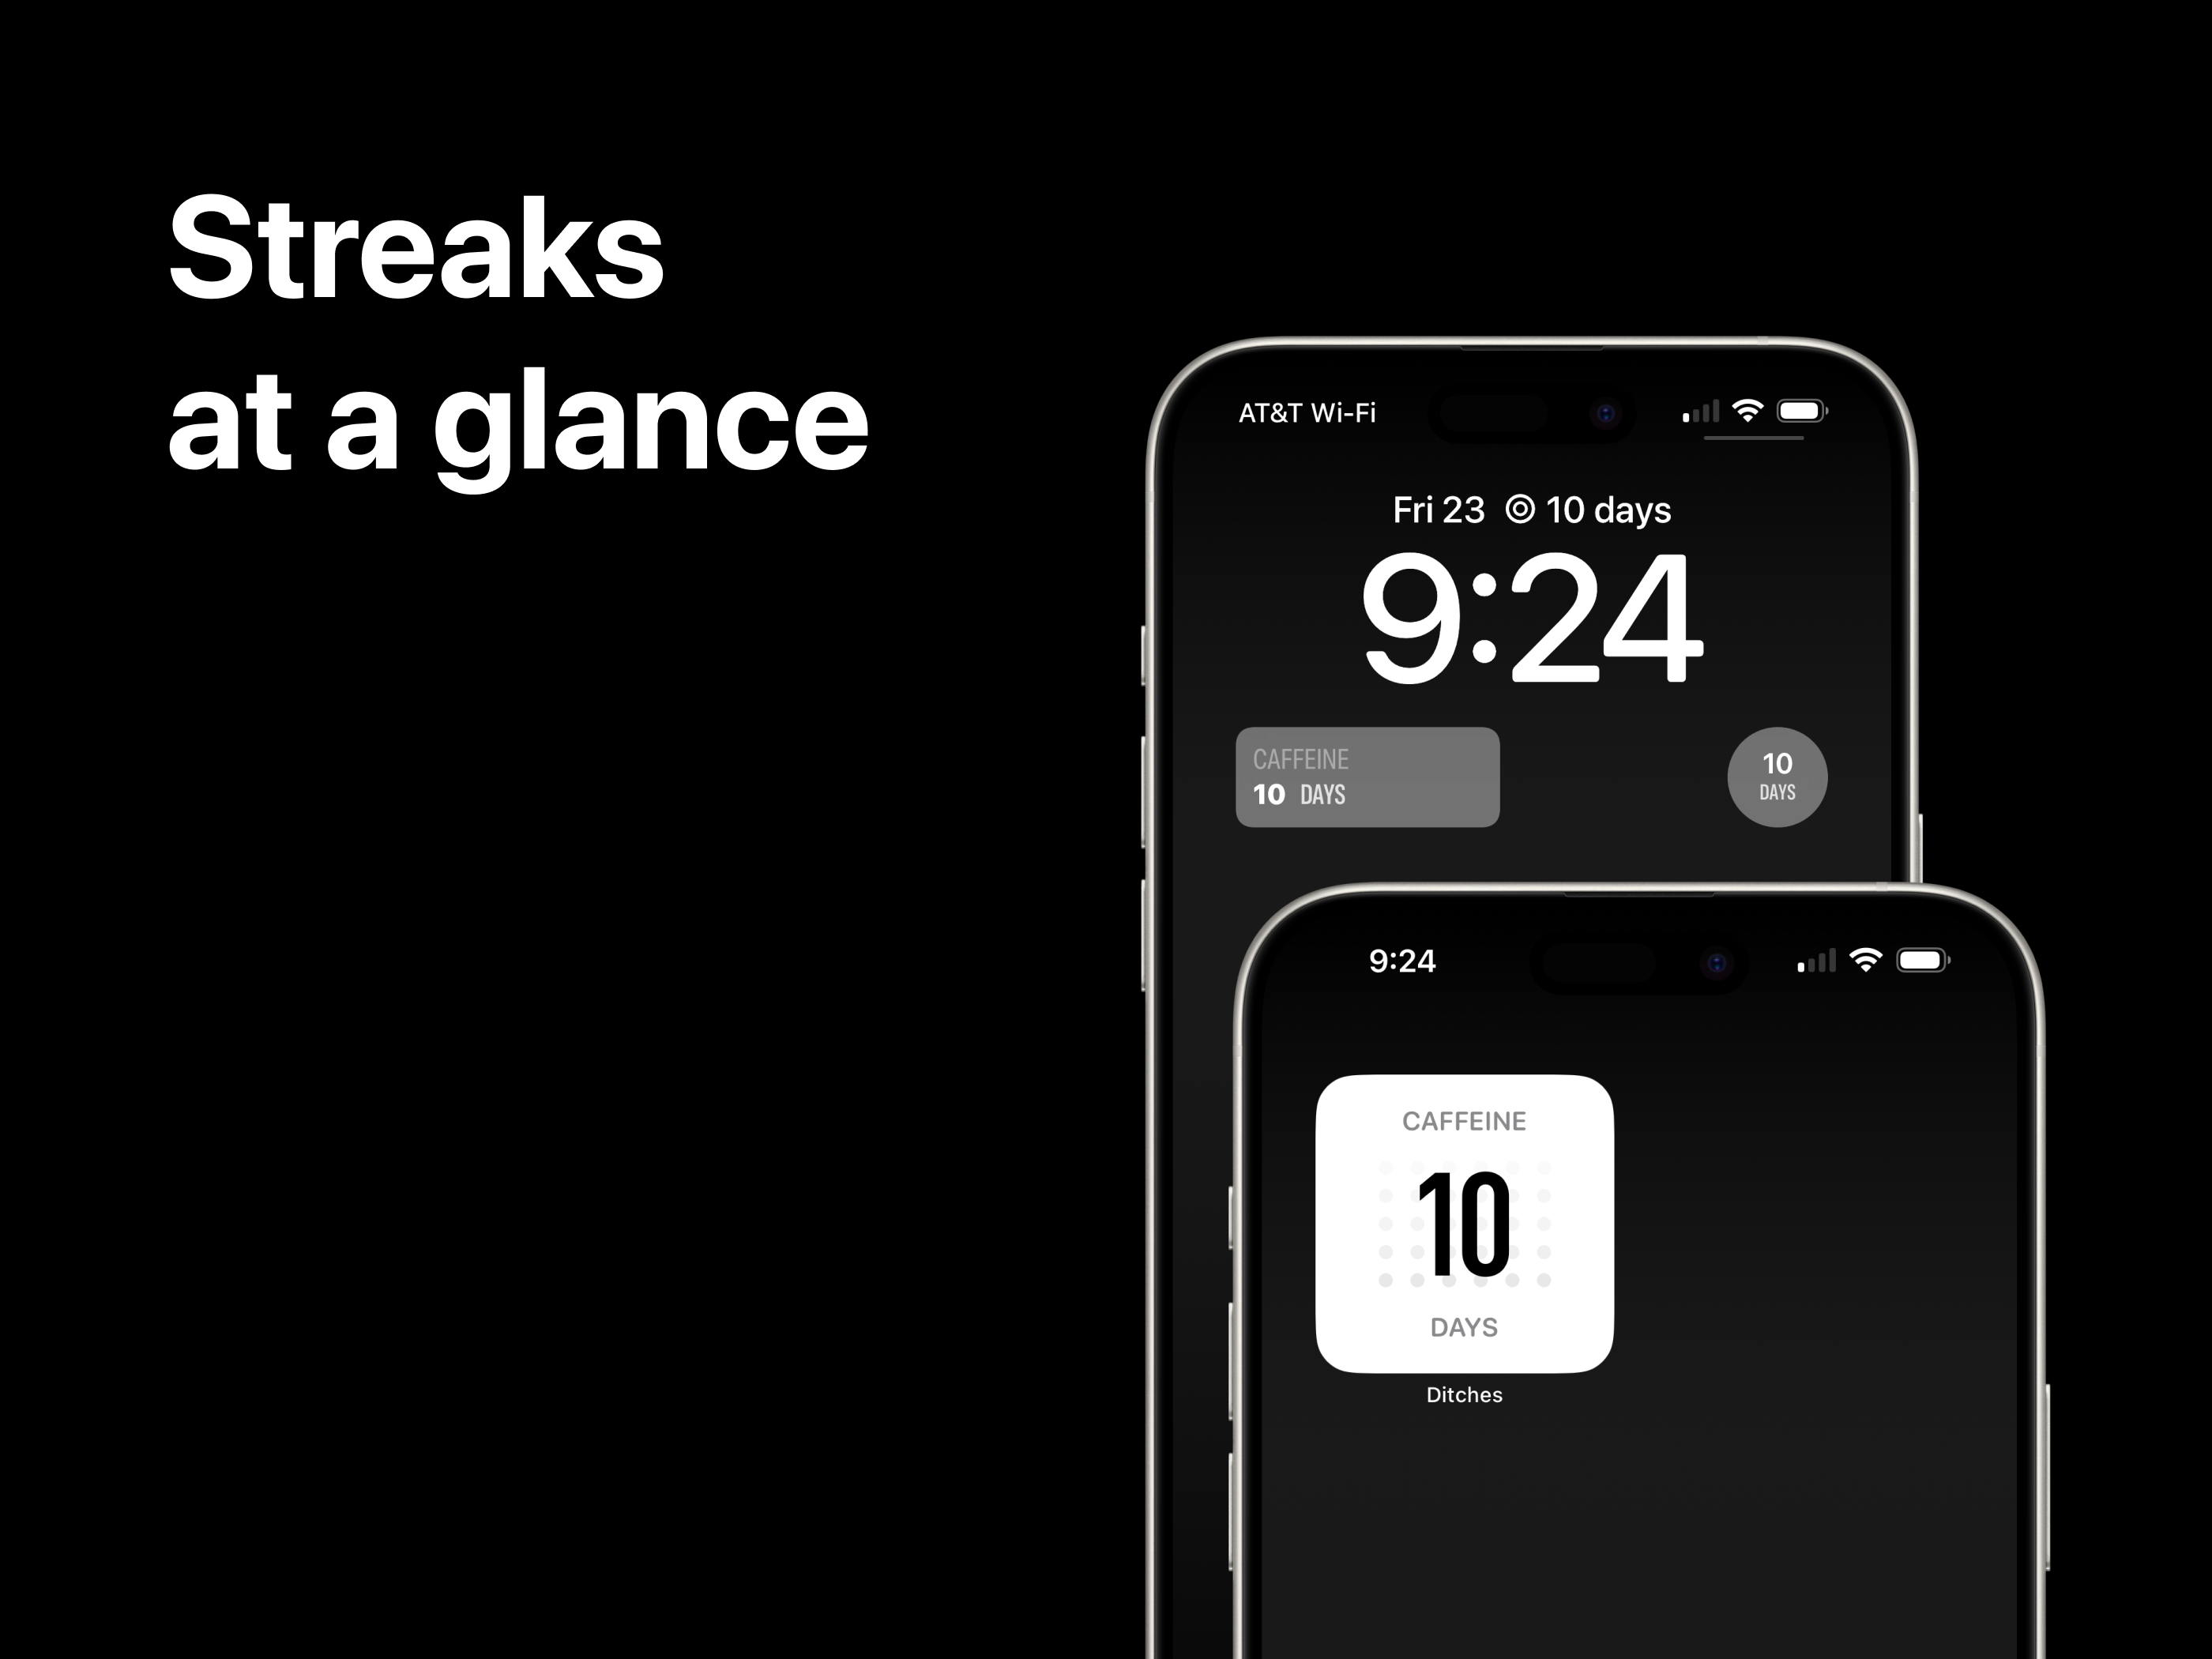
Widgets
-

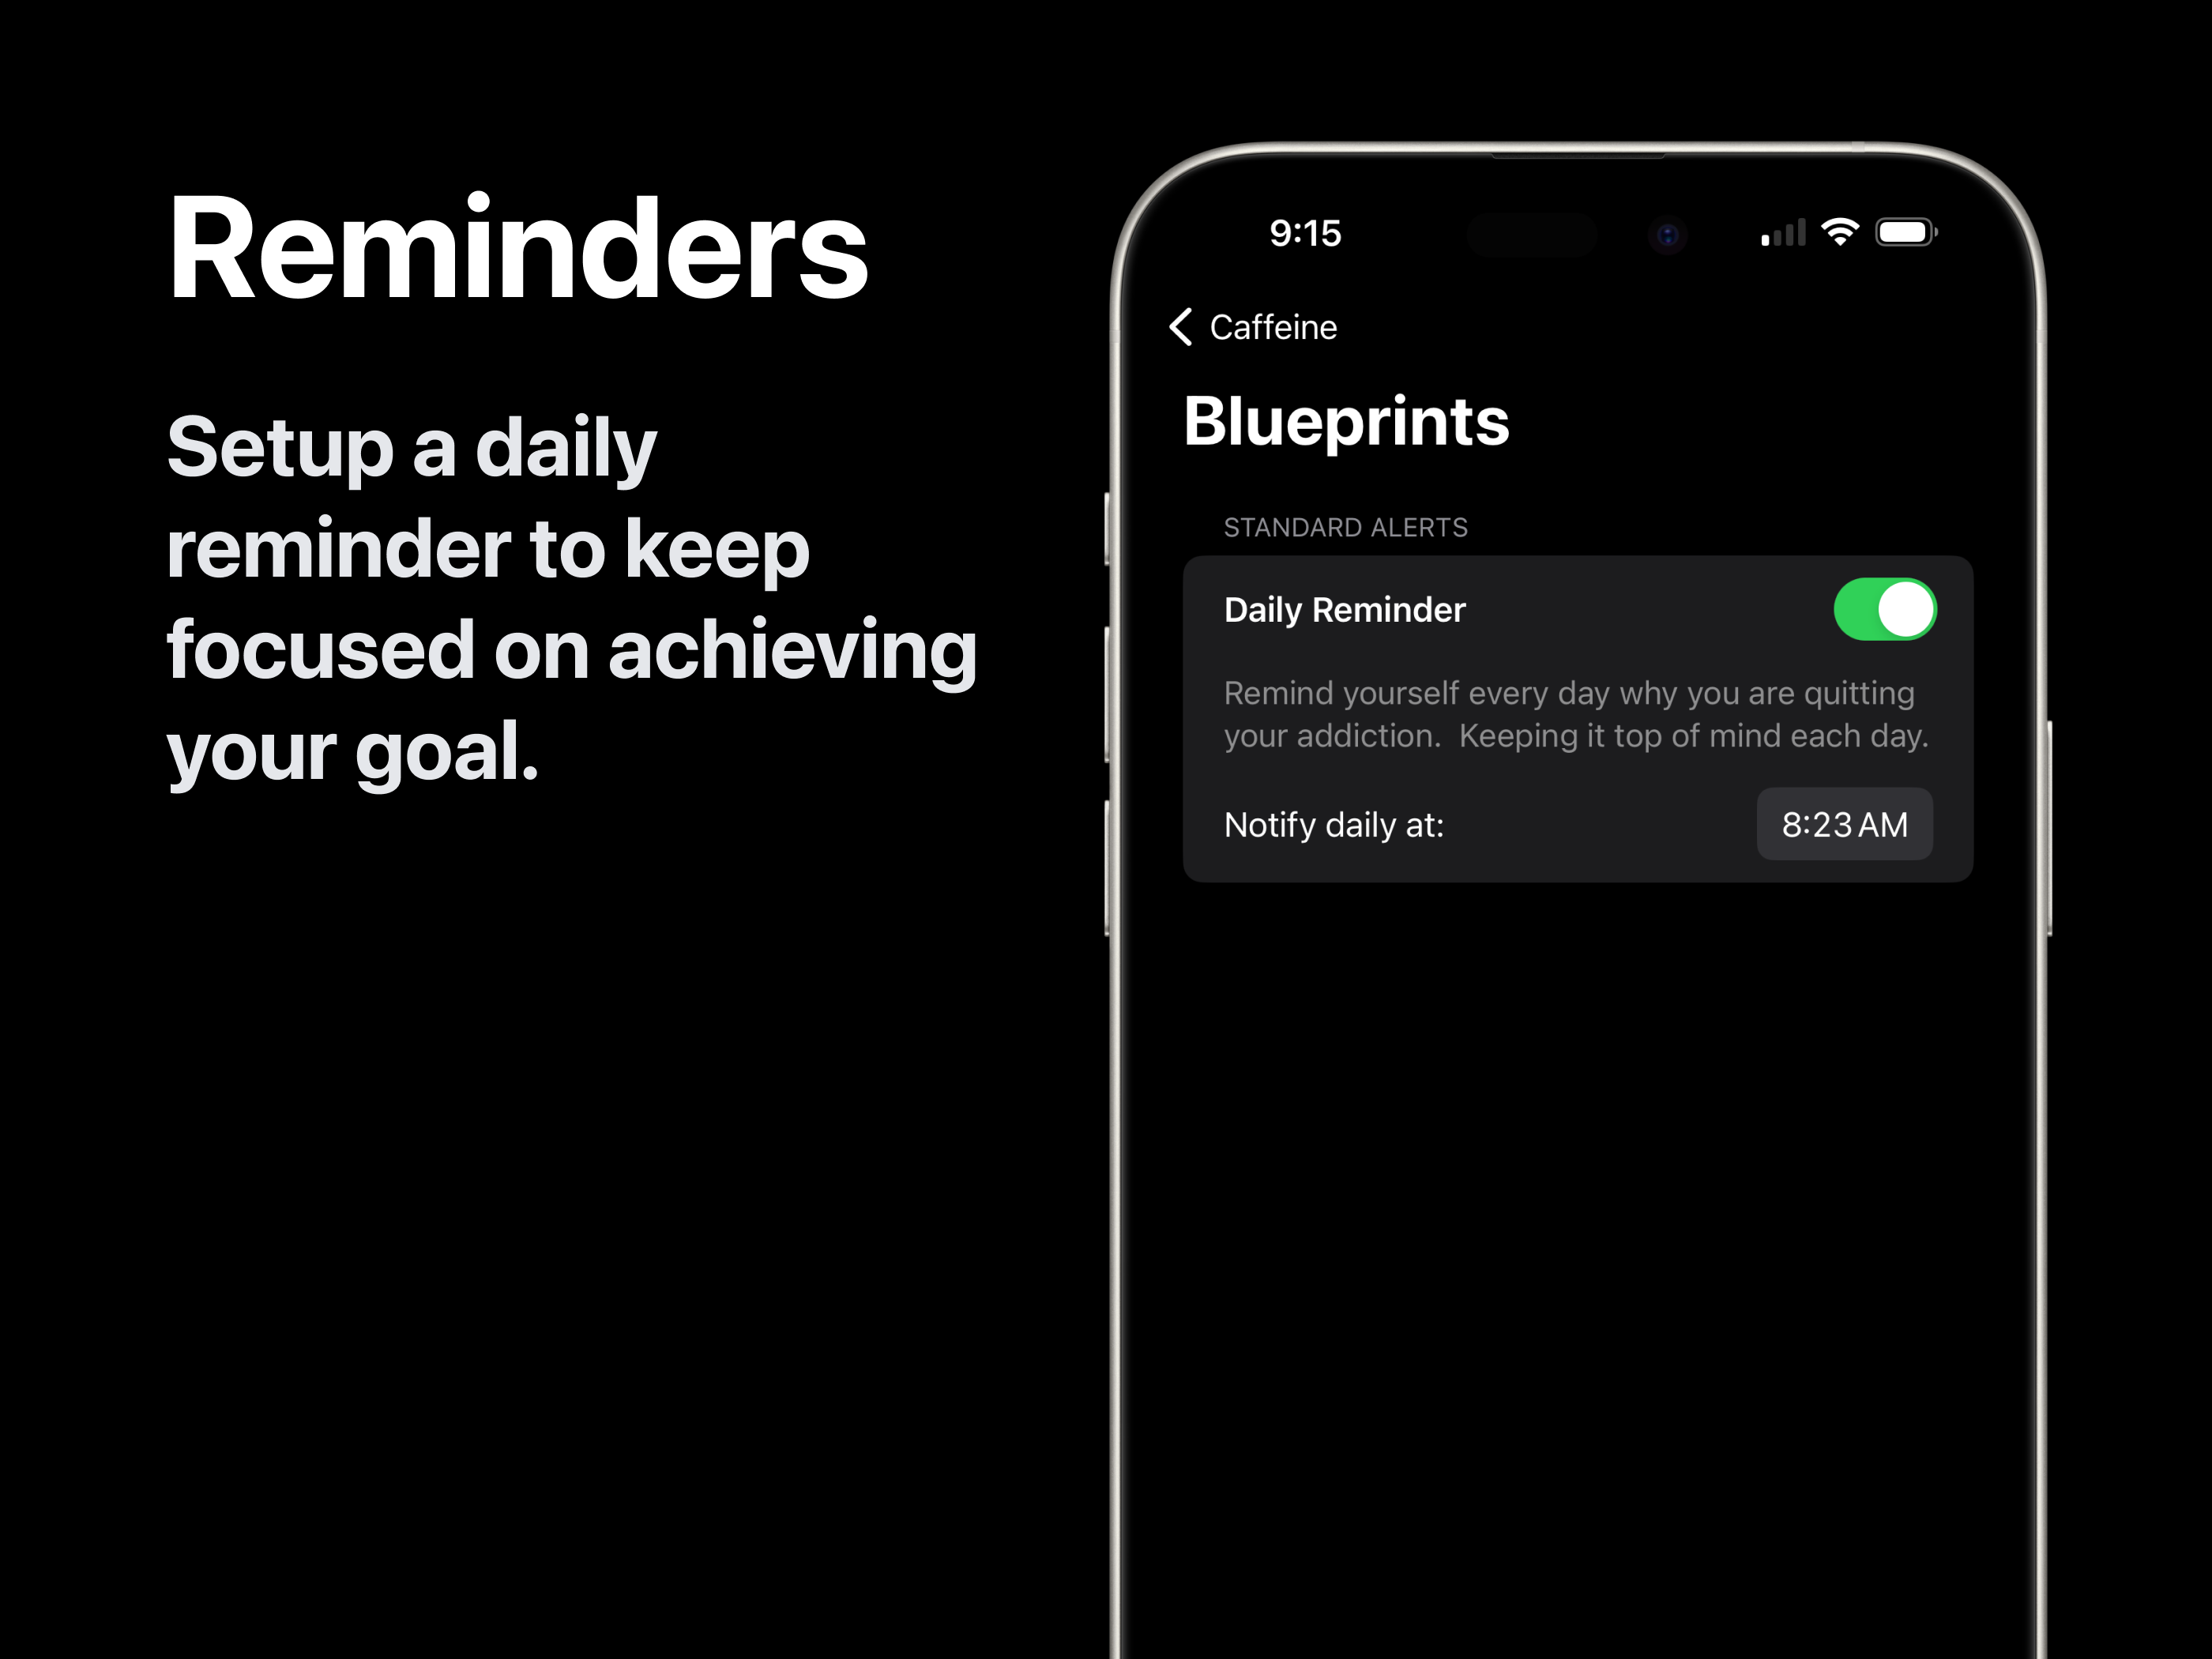
Blueprints Reminders Screen

Inspiration
I have struggled with addiction throughout most of my life. Alcohol was the worst offender. After a year sober I reflected on what made this attempt a success and why I failed so many other times.
I found that most apps that help track habits/addictions were missing a few key things that helped me better understand my addictions. They heavily focus on your streak alone as a driving force to motivate you to keep going.
What I found was when I started tracking when I was having cravings for alcohol and weather or not I caved to those cravings dramatically increased my streaks and chances for success.
Being able to understand the trends of my cravings allowed me to better prepare myself before the cravings happened.
Therefore, after 3 years sober I decided to build an app that I wish had existed when I was fighting my addiction. My hope is that it can help at least other other person in their battle as well.
What it does
Ditches tracks bad habits and addictions with cravings (we'll. use sugar for this example). Each time a user has a craving sugar they can log the craving. They can mark weather or not you caved to that craving which will reset any streak that may have had as well as some notes on how they are feeling at the moment in time to reflect on later.
The app then takes the historical data of the give the user easy to understand charts about when they are most susceptible to a craving.
It also allows the user to look over all cravings and streaks filtering them with different views as well as a daily notification and widgets to keep their fight top of mind.
How we built it
Ditches was built by a solo developer using Xcode. Some iterations were made with private betas as well as a public test flight on X.com
Challenges we ran into
SwiftData still has a few rough edges. Getting the data to present nicely in the historical views while still being performant was a challenge as the SwiftData Predicate support could still be improved upon, in my opinion.
Swift Charts was a challenge to get the data formatted correctly in a logical way. I created a custom "DataShaper" that will input any array of data and convert it to formatted data used in a chart.
Accomplishments that we're proud of
The UI is completely monochrome. When designing the app I wanted to be mindful of users who might have a phone addiction. I also wanted to remove any stimulation from the app causing unwanted side effects to the users.
It was a fun challenge designing an app that was intuitive to use while not being able to rely on color for what are actions and what is plain text.
What we learned
RevenueCat is insanely easy. This is the first app that I have used RC for that did not have a business model in place beforehand which had to be accounted for. The Purchase delegate makes tracking changes to a users subscription so easy.
Assumptions are be dangerous: I had several assumptions about how much data to collect from the user and how many charts to create. Most of them ended up being overbearing and caused anxiety for some users. You can always simplify more towards the root goal of the app.
What's next for Ditches
I have many more ideas for Ditches, such as adding cues to the cravings. This would allow more insights into why a craving happens as well. I'd also like to add dynamic alerts to the app which can change over time as the users craving trends change. I am more excited to see how other people use it and what challenges they face and how I can make the app better based off their feedback
Built With
- revenuecat
- swift
- swiftcharts
- swiftdata
- swiftui

Log in or sign up for Devpost to join the conversation.