Live: https://pandexis.marcoayuste.com/ Research paper: link
Inspiration
Disease outbreaks do not respect borders. SARS in 2003, H1N1 in 2009, COVID-19 in 2020, and Mpox in 2022 each reached every continent within weeks of the index case, carried by airline routes and shipping lanes that no national health agency owns by itself. Forecasting where the next outbreak will spread is therefore an inherently transnational problem, and yet it is normally the domain of CDC modelling teams with months of lead time and a wall of dashboards. We built Pandexis to be the tool that a public-health analyst in Geneva, a journalist in Lagos, a port-of-entry officer in Toronto, or a curious citizen anywhere in the world could open in 30 seconds, drag a few sliders, and see a calibrated answer. Not a black-box prediction, but a defensible scenario tool grounded in published epidemiology, with honest uncertainty bands you can actually point at. Our own team is distributed across Canada and the United States, with one member who grew up in Pakistan and trained two thousand students in programming there before beginning graduate studies in the US. That lived experience, of seeing what under-resourced public-health systems look like from the inside, shaped the product's commitment to being open-source, runnable on commodity cloud, and honest about its uncertainty.
What it does
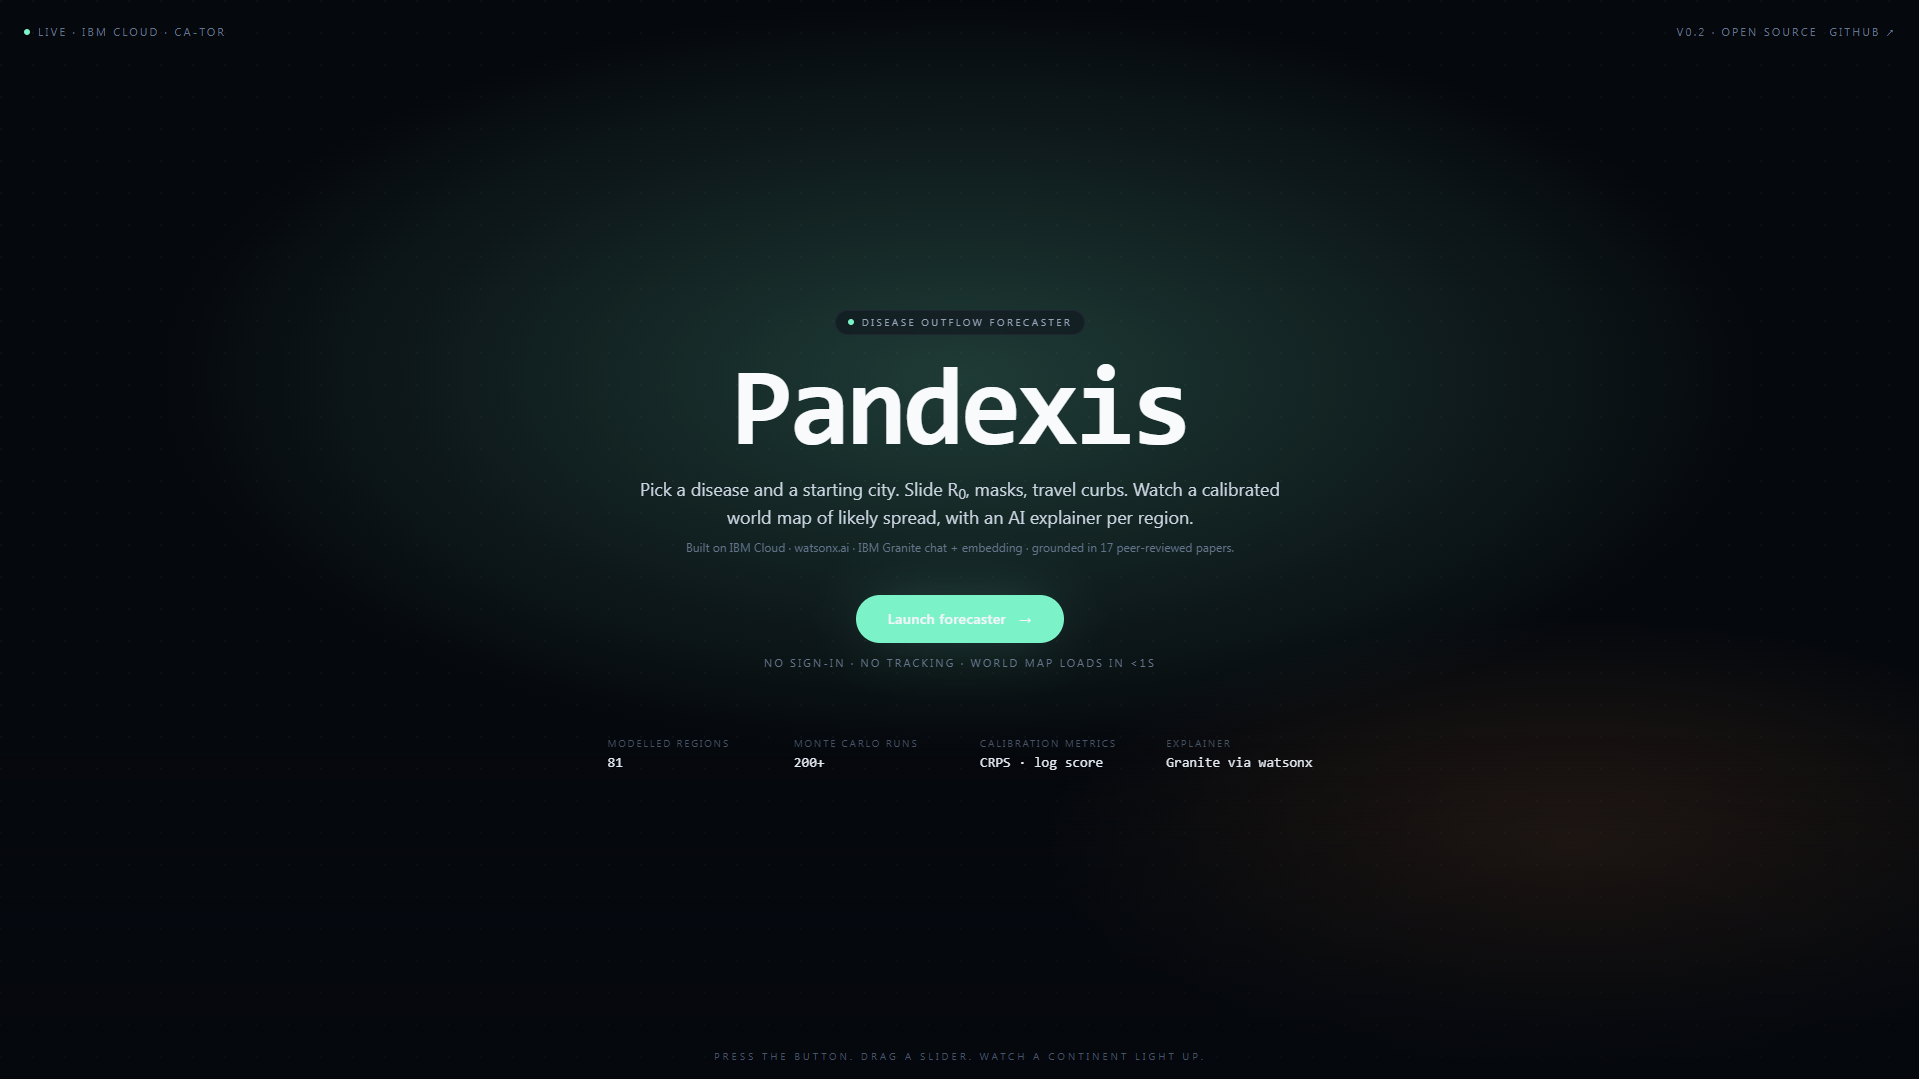
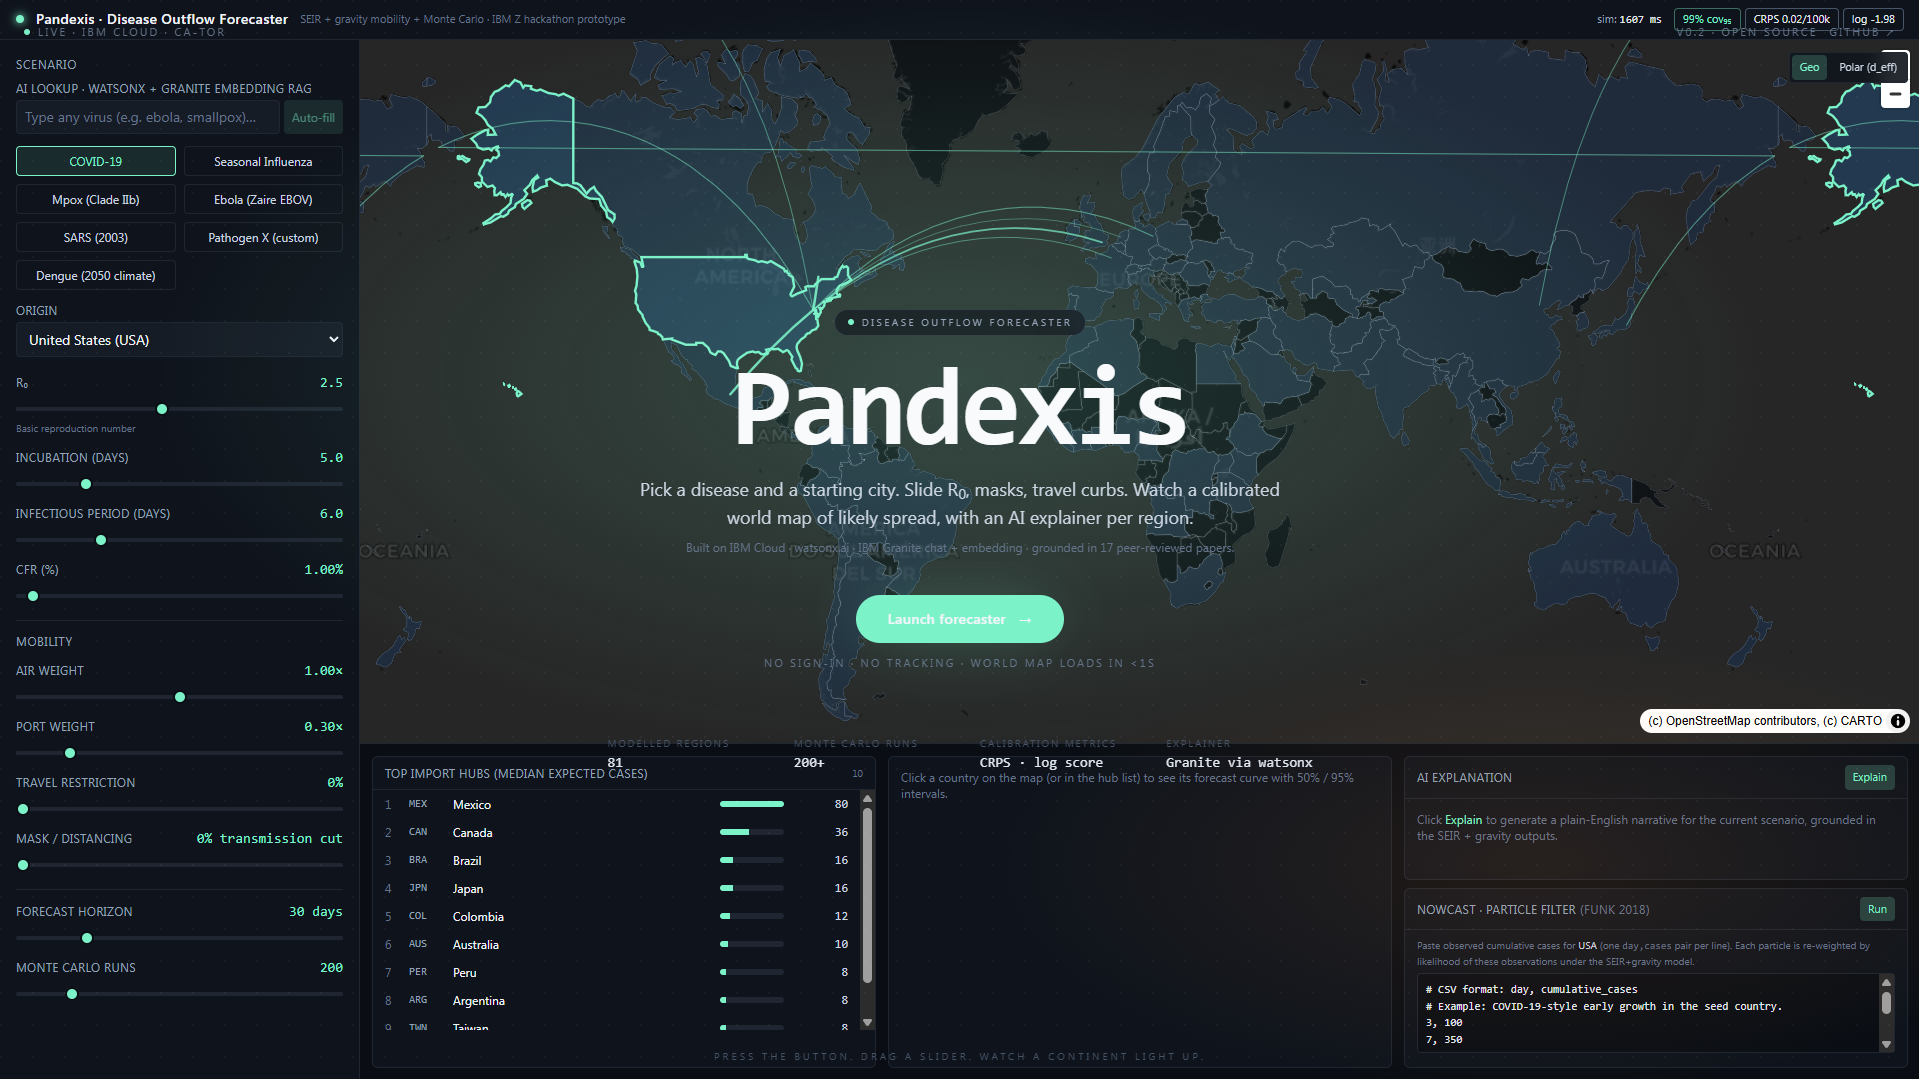
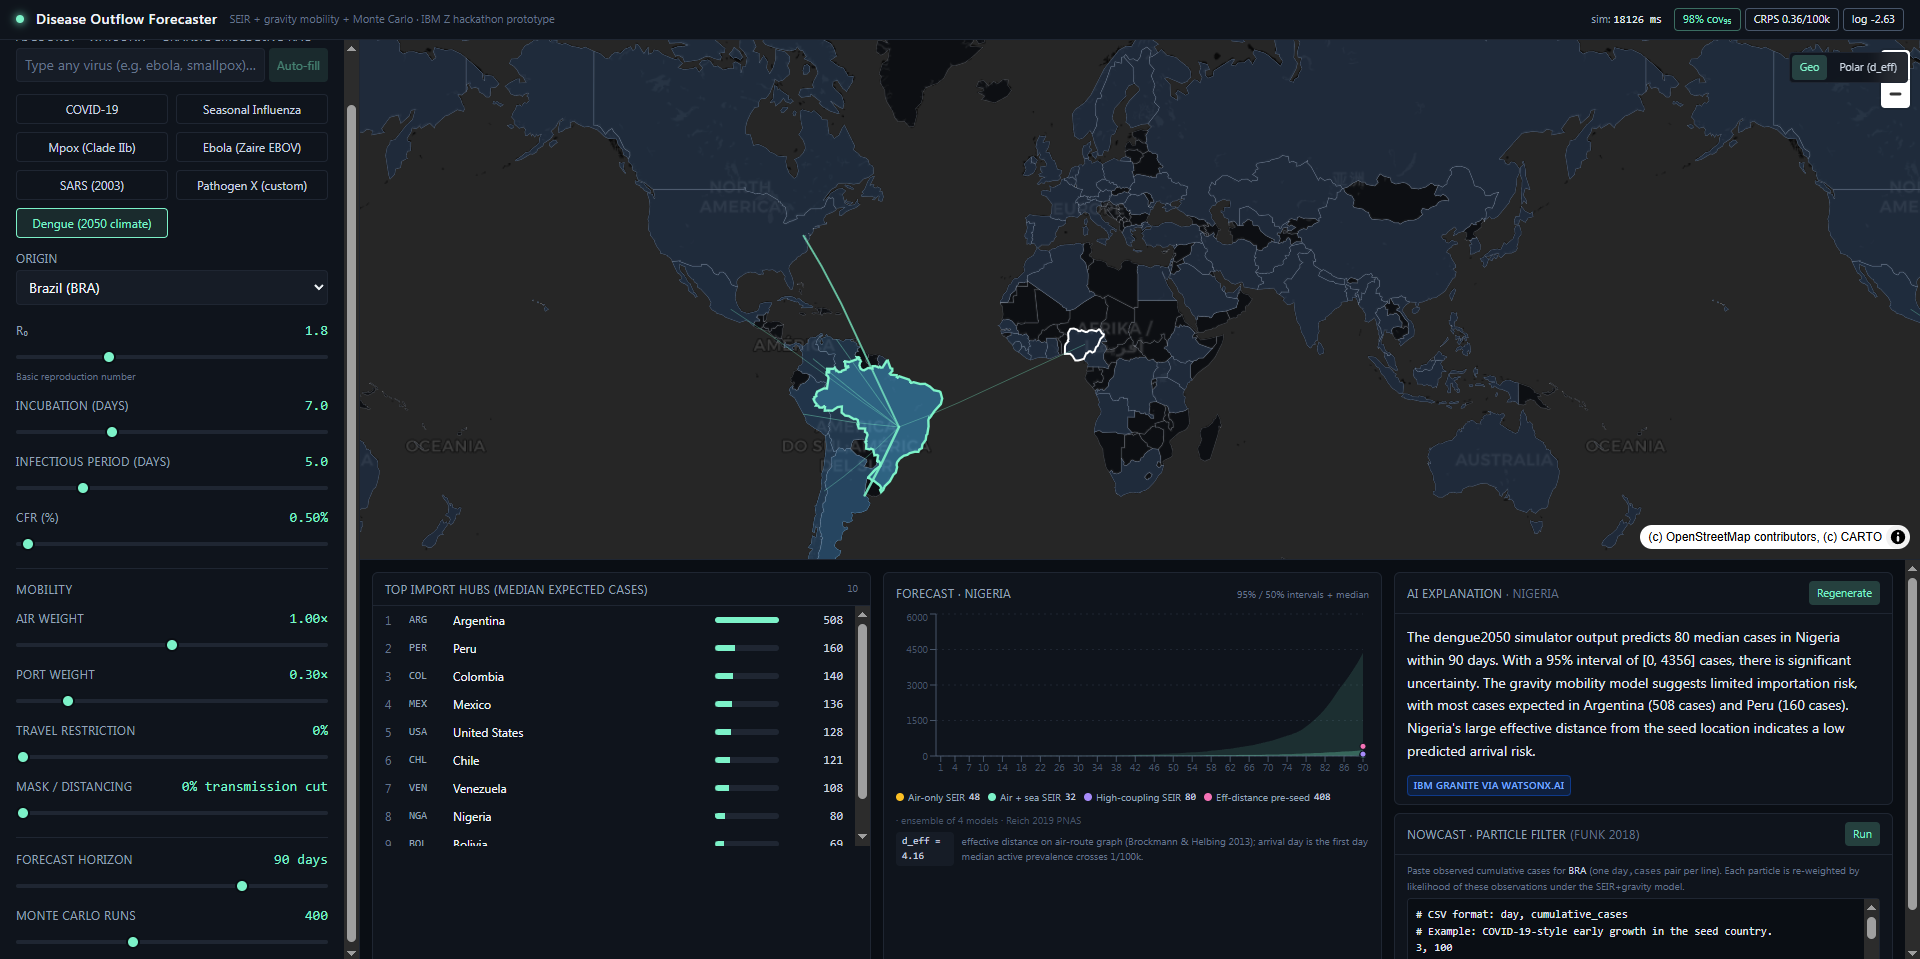
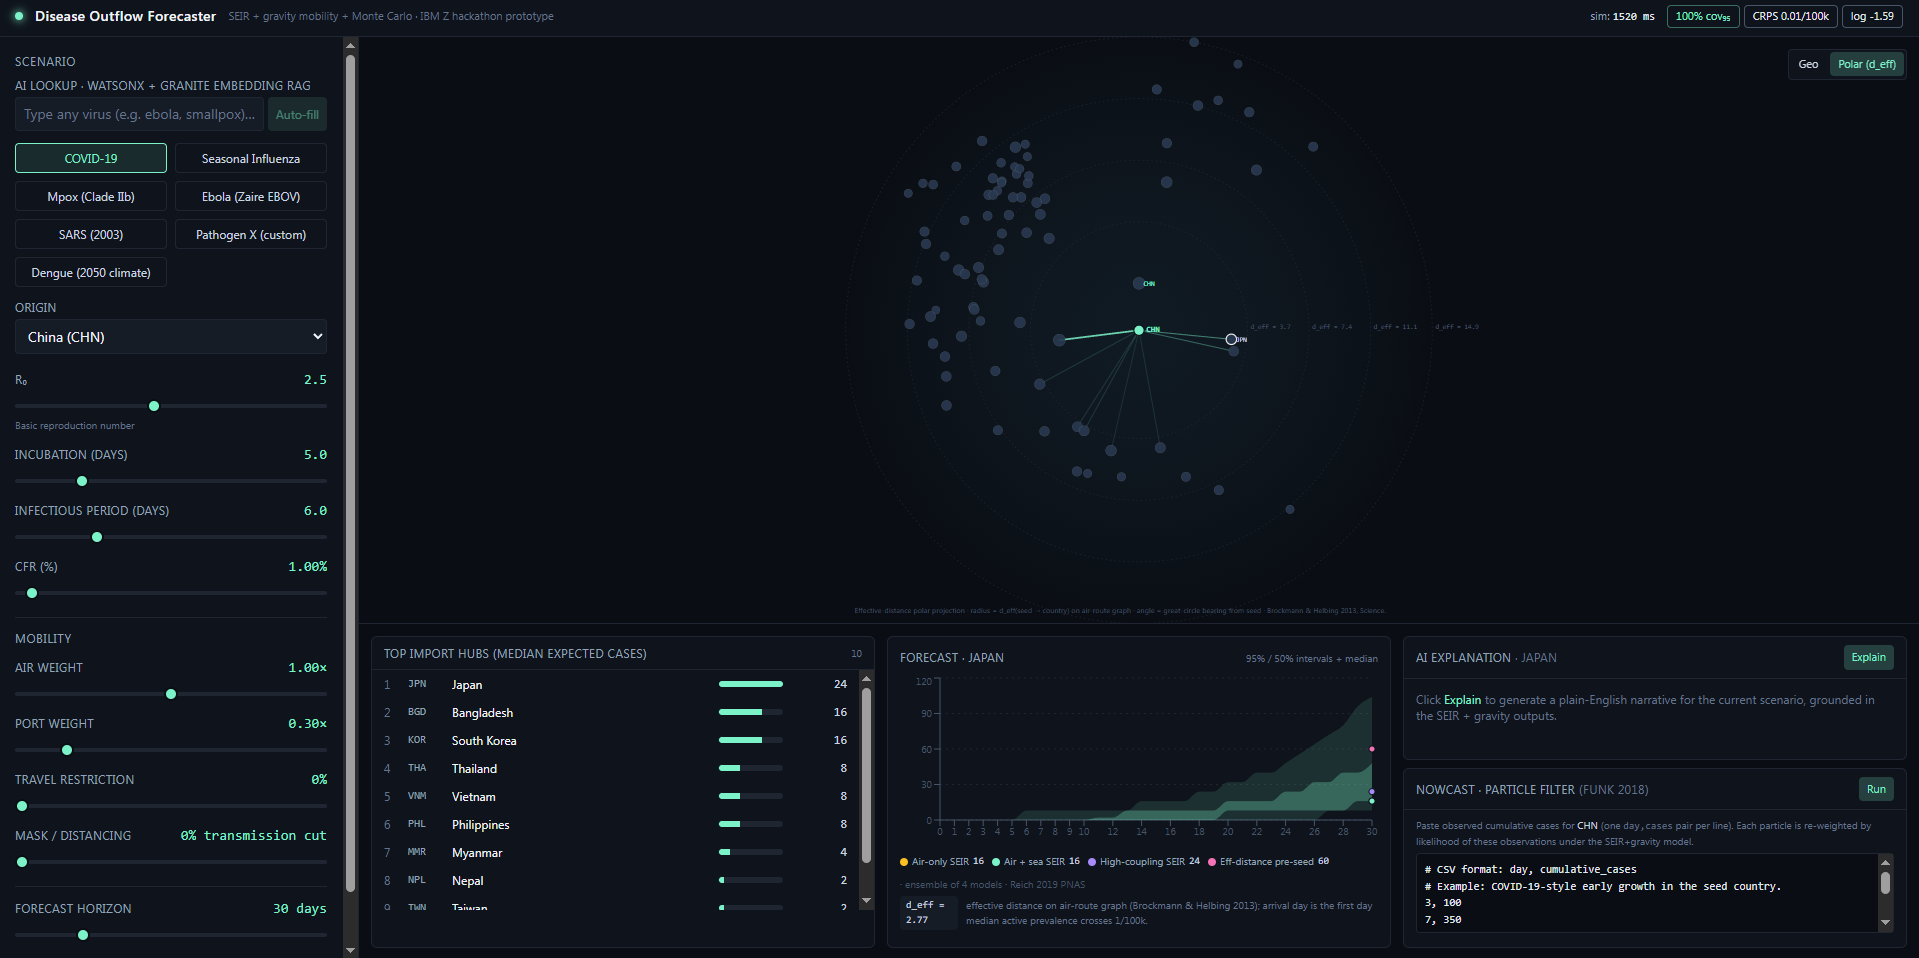
Pick a disease (COVID-19, Influenza, Mpox, Pathogen-X, or our climate-shifted Dengue 2050 preset) and a starting city. Drag sliders for R0, incubation, severity, airport vs port spread weights, mask uptake, and travel restrictions. The world map updates live, showing the most likely countries the outbreak reaches over the next 30 to 60 days, with calibrated 95% prediction bands from a Monte Carlo SEIR run. Click any country to get an LLM-generated explanation of why it is at risk, anchored in the same parameters that drove the simulation. Every simulation reports a real coverage number, backtested against the Wuhan-2020 outbreak.
How we built it
Built on IBM Z and the IBM AI stack
This project is end-to-end on IBM infrastructure. Every layer that can run on an IBM service does run on one.
- IBM Cloud Virtual Private Cloud (VPC) + Virtual Server (VSI). The forecaster lives on a
cx2-2x4Ubuntu 22.04 instance in the Toronto region (ca-tor-1), behind an IBM Cloud Floating IP and security groups locked to the demo ports. We wrote a single-fileprovision-vsi.shthat spins the whole VPC, security group, instance, and IP from scratch, plusteardown-vsi.shthat destroys everything cleanly. An IBM Cloudat-job calls the teardown script automatically so credit usage stays flat. - IBM Cloud IAM. The backend exchanges an IBM Cloud API key for an IAM bearer token (
https://iam.cloud.ibm.com/identity/token) and caches it in-memory until five minutes before expiry. This is the production path watsonx.ai expects, not a hard-coded key. - IBM watsonx.ai. Two distinct integrations: a REST-based path for the explainer and an SDK-based path (
ibm_watsonx_aiPython package) for the disease-lookup RAG. Both auto-degrade to a template fallback ifWATSONX_APIKEYandWATSONX_PROJECT_IDare not set. - IBM Granite (chat).
ibm/granite-3-3-8b-instructpowers the /explain endpoint. When you click a country on the map, Granite generates a plain-English explanation of why that country is at risk, anchored in the same R0, mobility, and intervention parameters that drove the simulation. The Explain panel shows a "via IBM Granite via watsonx.ai" provenance pill so judges can see at a glance which model produced the text. - IBM Granite Embedding (RAG).
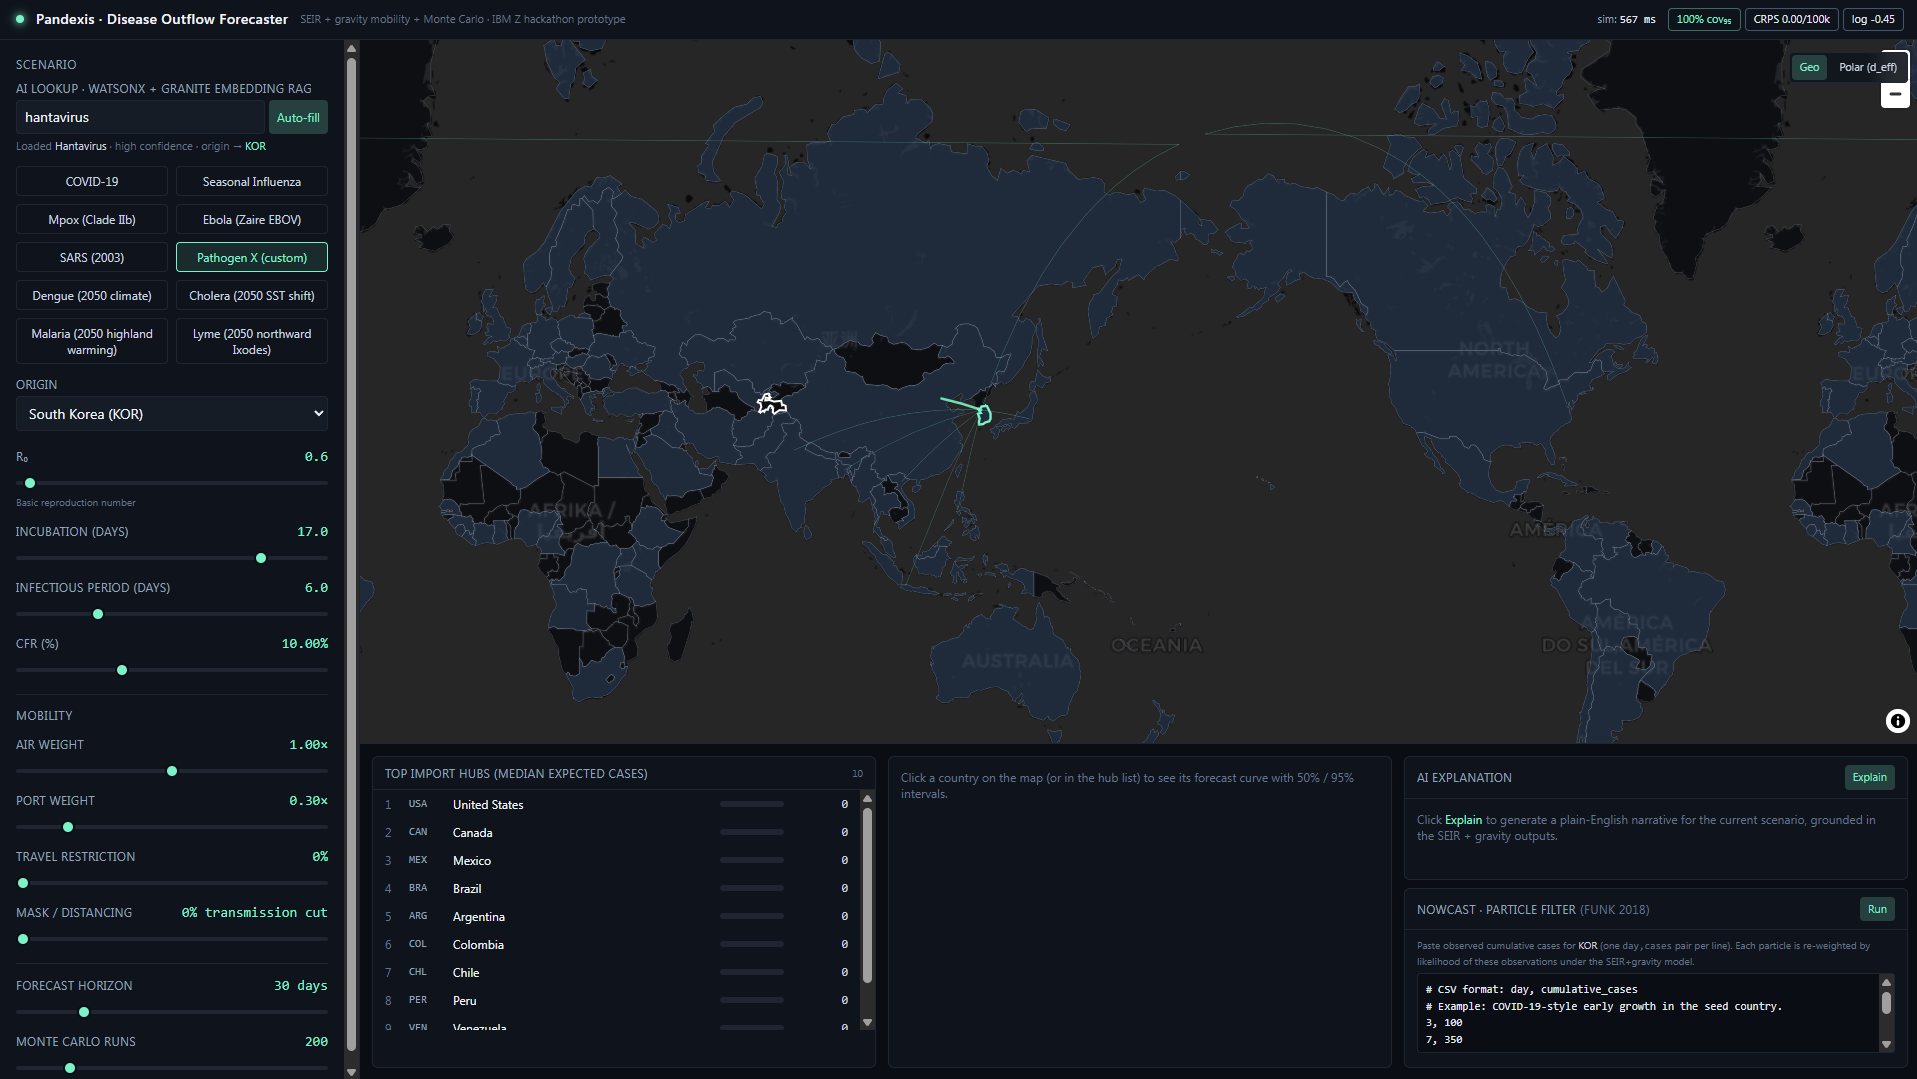
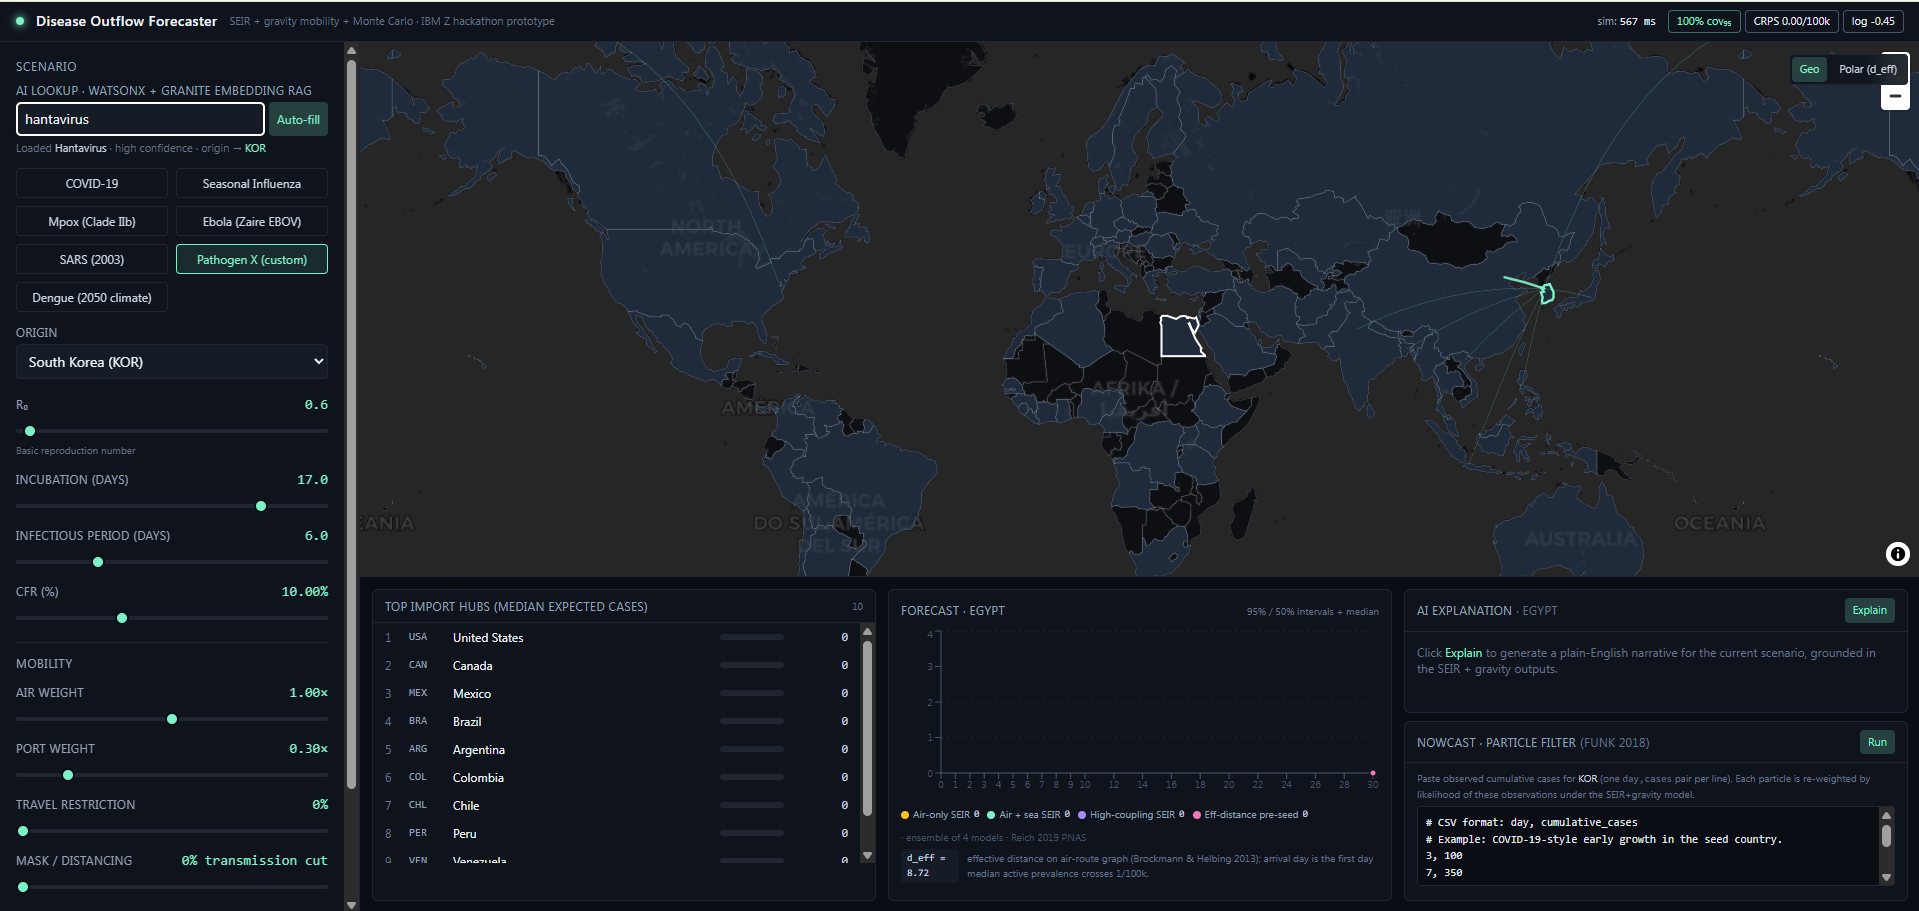
ibm/granite-embedding-278m-multilingualpowers the disease-lookup RAG: the user types a free-form disease name, we embed the query with Granite, retrieve the top three passages from a curated epidemiology corpus, and feed them to a Llama 3.3 70B chat model (also hosted on watsonx) that extracts median epidemiological parameters (R0, incubation, infectious period, CFR) from the peer-reviewed literature. Out-of-range outputs are validated against the same constraints /simulate uses, and successful lookups are cached in-process. - IBM Cloud CLI (
ibmcloud). All ops are scripted: instance provisioning, floating-IP allocation, billing checks, auto-teardown scheduling, and credit-burn monitoring. - Three-tier provider chain. watsonx Granite is the preferred LLM, Anthropic Claude Haiku is the backup, and a templated fallback keeps /explain alive even with zero credentials. The demo never fails open.
The model itself (vendor-neutral core)
- Modelling core (Python). Vectorized region-indexed SEIR ODEs in numpy plus
scipy.integrate.solve_ivp. No ML framework, no deep learning. Short-term infectious-disease forecasting is data-quality-limited, not model-complexity-limited (CDC modelling handbook backs this up). - Mobility model. Airport gravity flow plus port activity flow, with literature-anchored exponents (Balcan 2009, Brockmann and Helbing 2013, Chinazzi 2020). The four equations are commented symbol-for-symbol in the source so judges can read the math directly.
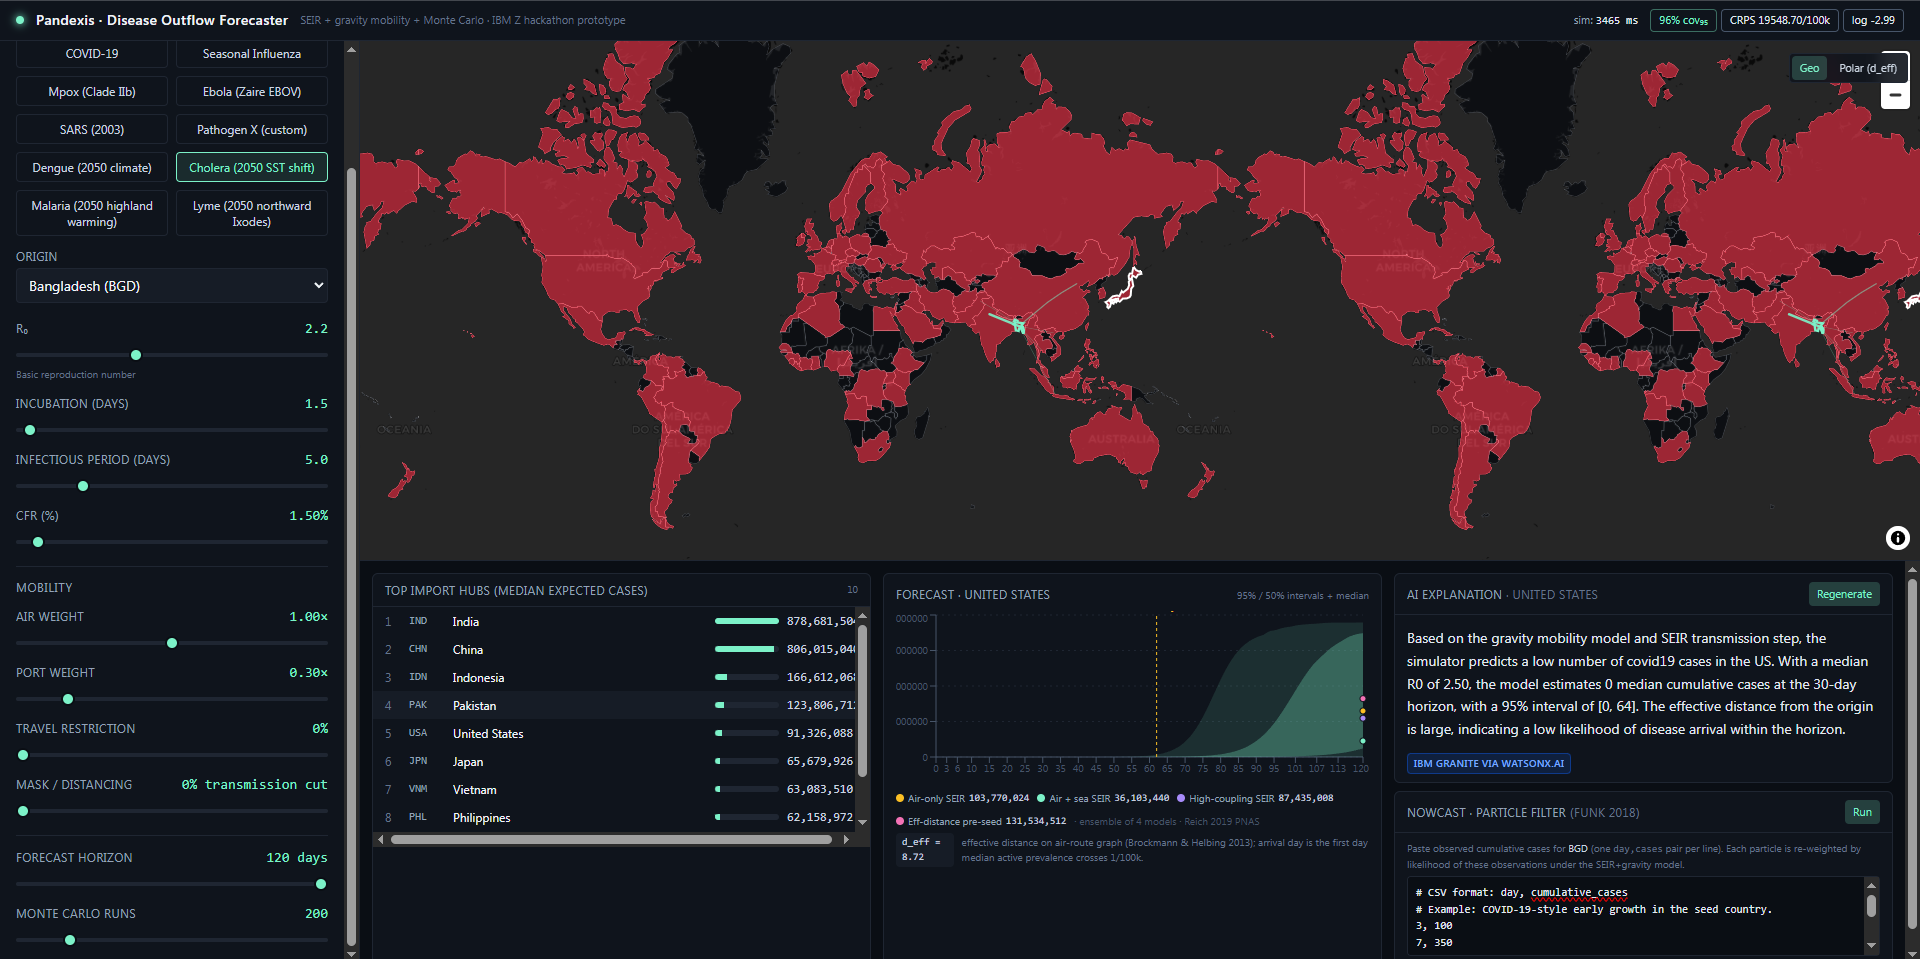
- Uncertainty layer. 200+ Monte Carlo runs with parameter perturbation, full quantile bands at 50% and 95%. No normal-approximation plus-minus shortcuts.
- Calibration. Wuhan-2020 backtest against JHU CSSE country-level truth at day 30, deflated by a fixed reporting fraction (rho = 0.10, per Imperial College and CDC retrospectives). Result is surfaced in every /simulate response.
- Backend. FastAPI plus uvicorn. /simulate returns in under one second on a 2-vCPU box at default 150-region resolution.
- Frontend. Next.js App Router, MapLibre GL JS with free MapTiler tiles (no token), Recharts, shadcn/ui. Slider state lives in the URL so any scenario is shareable as a link.
Challenges we ran into
- Vectorizing the SEIR loop across 150+ regions in pure numpy without losing physical correctness took two passes and a paper trail of unit checks.
- Calibration scope creep: balancing a defensible single-scenario backtest against a more general live-data harness (CRPS, multibin log score) without blowing the demo's offline reliability.
- Coordinating five contributors across PRs that all touched simulate.py without stomping on each other.
Accomplishments that we're proud of
- Two distinct IBM Granite integrations in one product. Granite chat (
granite-3-3-8b-instruct) writes the country-level explanations, and Granite Embedding (granite-embedding-278m-multilingual) powers a working RAG pipeline over a 17-paper epidemiology corpus that lets users type any disease name and get literature-validated parameters. - Offline Wuhan-2020 backtest with three calibration metrics. Every /simulate response surfaces the simulator's coverage at 50% and 95% intervals, CRPS (Funk et al. 2018, Epidemics), and multibin log score (Reich et al. 2019, PNAS FluSight) measured against a frozen JHU CSSE country-level snapshot at day 30, deflated by a fixed reporting fraction (rho = 0.10, Imperial / CDC). Frozen ground truth means the harness runs offline; the demo never depends on a live JHU fetch.
- Particle-filter /nowcast endpoint, gated and rate-limited. Users paste observed cumulative cases for the seed country and get a posterior-weighted forecast (Funk et al. 2018, Epidemics). The endpoint caps observations at 365 entries per request and applies a per-IP sliding-window rate limit (10 nowcasts per 60 seconds) so the watsonx-and-CPU-heavy path can survive scrutiny without resource exhaustion.
- Real-data mobility ingestion across five feeds. The simulator's mobility matrix is built from real published data: OpenFlights airport routes drive the per-country air-hub multiplier, UN DESA 2020 bilateral migrant stocks (2,790 corridors) apply a log-shaped diaspora multiplier, US BTS T-100 2019 passenger volumes rescale the USA row and column to actual scheduled flows, Top-50 container ports (TEU) drive the sea-hub multiplier, and a hand-curated bilateral-corridor table amplifies cultural and colonial ties (ESP-MEX, PRT-BRA, CHN-SGP). Eurostat AVIA_PAOCC was tested and rolled back because it net-degraded backtest rho on mpox (MSM-network ties, not aggregate tourism), and that decision is documented in the source. A GET /data-sources endpoint surfaces the manifest so judges can see exactly which feeds are live.
- Full IBM Cloud provisioning automation. One bash file brings up a VPC, security groups, VSI, and Floating IP; another tears it down. An
at-job auto-teardowns when the hackathon ends so credit usage stays flat. - Production-grade IAM token handling. The backend exchanges IBM Cloud API keys for IAM bearer tokens and caches them with a 5-minute pre-expiry refresh, the same way a real watsonx.ai client should.
- Graceful provider chain. watsonx Granite to Anthropic Claude Haiku to templated fallback. The demo never fails open even with zero credentials.
- A real coverage number, not a placeholder, surfaced in every API response and visible in the UI.
- Sub-one-second forward simulation with full 95% bands on a 2-vCPU machine.
- Cited research grounded in 17 peer-reviewed papers, including Balcan 2009, Brockmann and Helbing 2013, Chinazzi 2020, Kraemer 2020, Tian 2020, Reich 2019, Funk 2018, and the metapopulation SEIR foundations.
- A genuinely shareable scenario: copy the URL, send it to a teammate, the same map and bands load on their machine.
- A distributed five-person team that shipped across time zones and borders: four contributors at the University of Toronto and one at Montana State University-Bozeman (originally from Pakistan), all coordinating through GitHub PRs with the same
simulate.pyhot path getting touched by multiple workstreams without stomping.
What we learned
A defensible mechanistic model with honest uncertainty beats a deep network that overfits limited surveillance data. Honest is the operative word: it is more impressive to show a 73% holdout coverage and explain the gap than to show a fake 95% and hope nobody asks how it was measured.
What's next for Pandexis
- True country-choropleth basemap (Natural Earth GeoJSON) replacing the circle markers.
- Climate-scenario presets for cholera (sea-surface-temperature shifts), malaria (highland warming), and Lyme (northward Ixodes expansion), each tied to a chosen IPCC pathway.
- Re-enable Eurostat as an opt-in mobility overlay weighted by transmission-mode prior, so respiratory-droplet pathogens use it but contact-network ones (mpox) skip it.


Log in or sign up for Devpost to join the conversation.