-
-
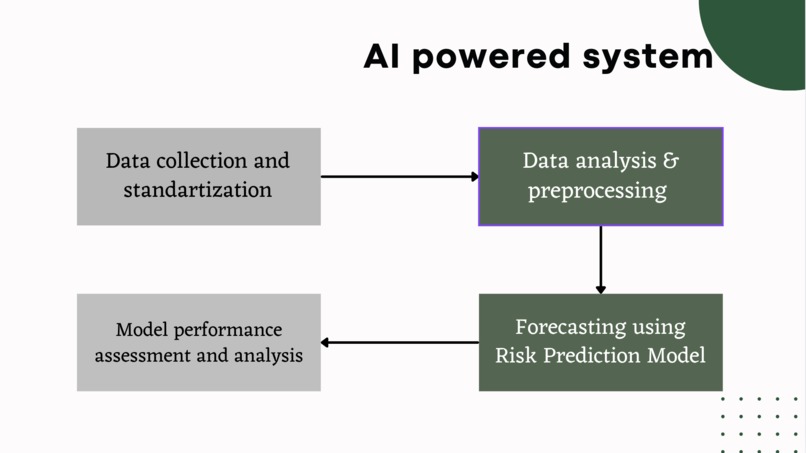
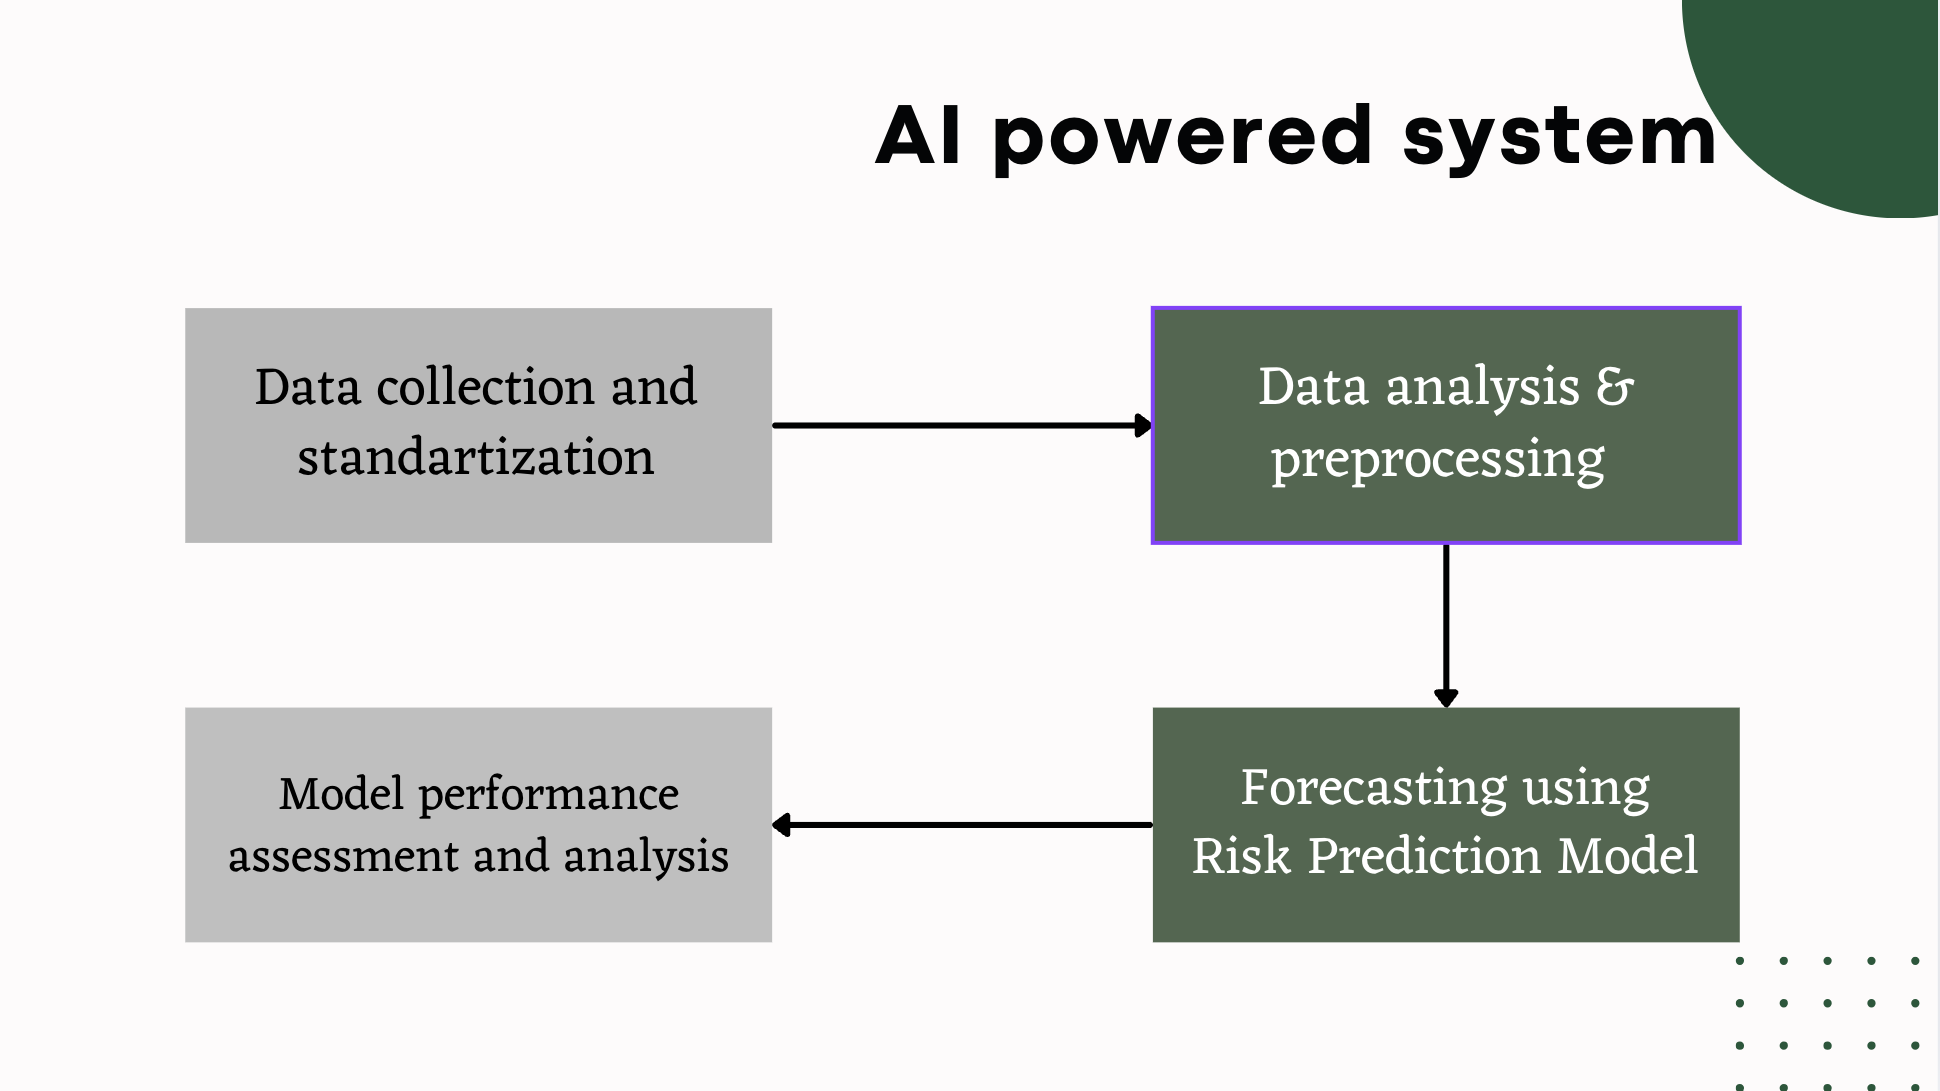
Block scheme of the project's system flow
-

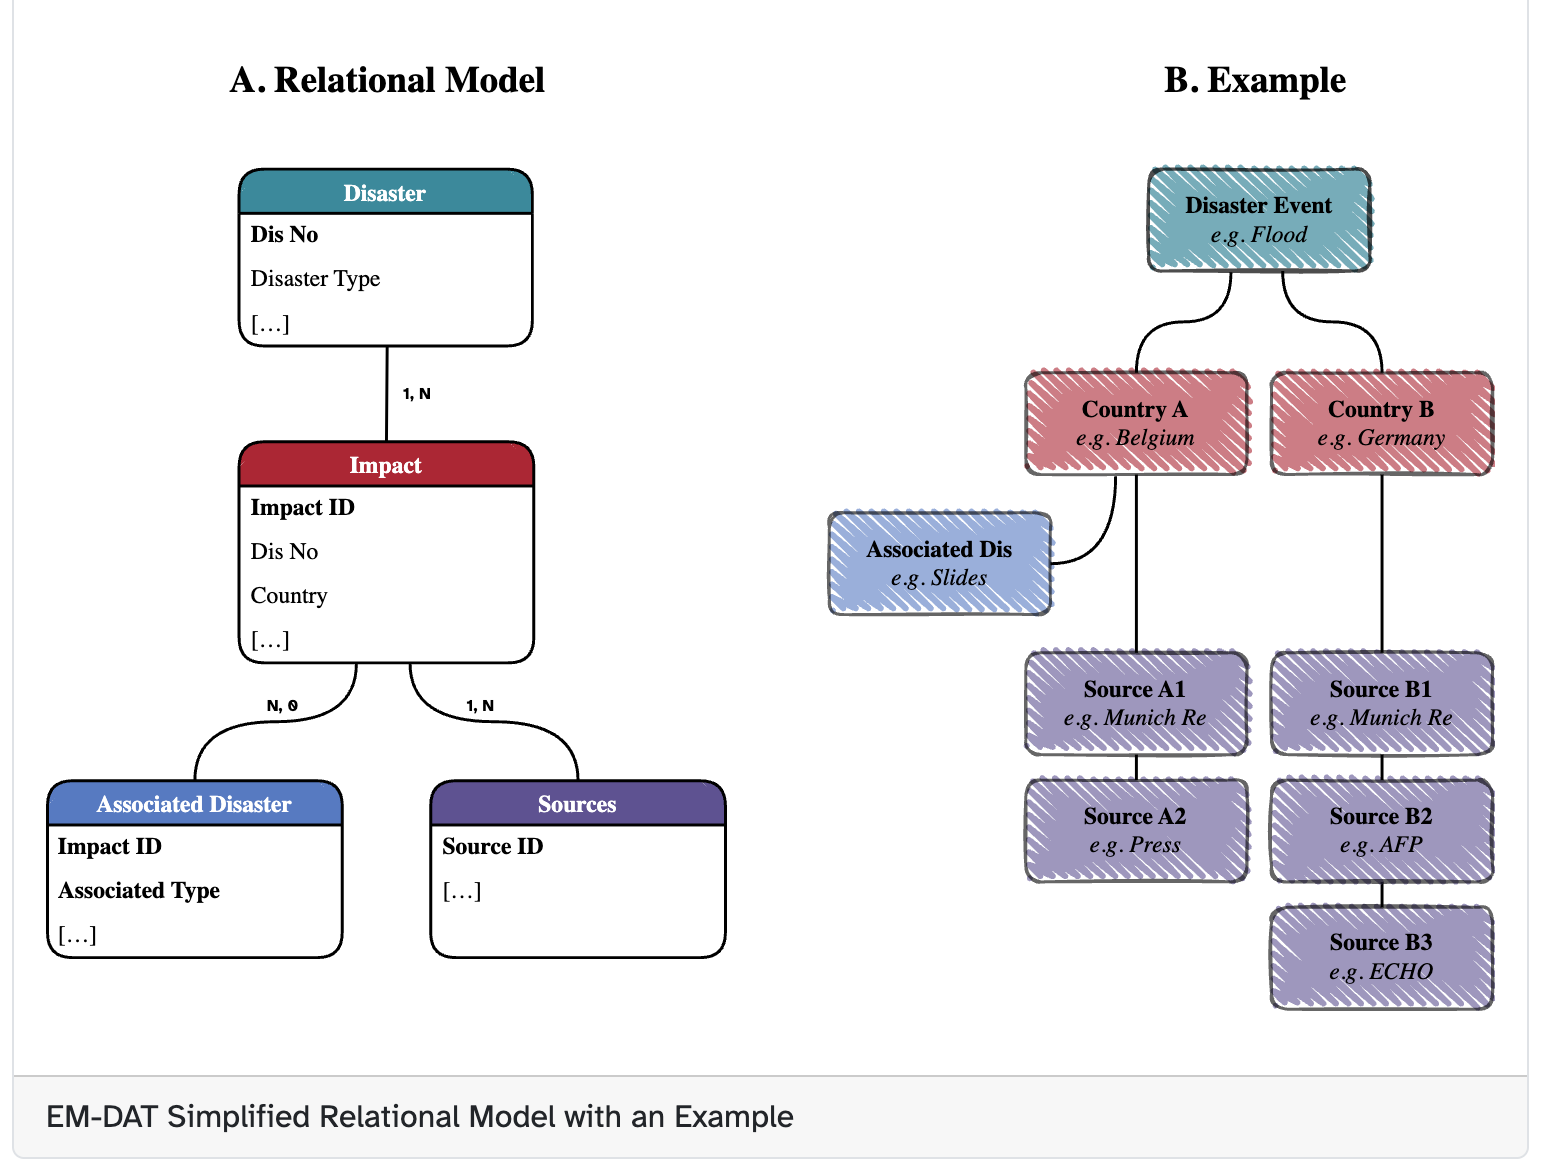
DataSet organization structure
-
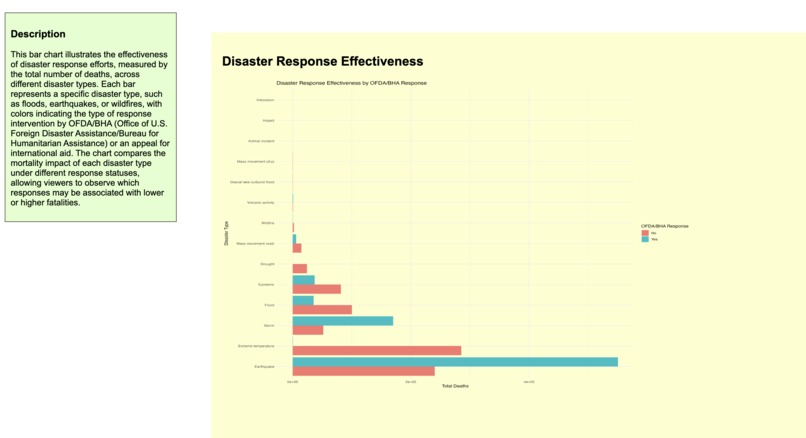
Bar chart illustrates the effectiveness of disaster response efforts, measured by the total deaths number, across different disaster types
-
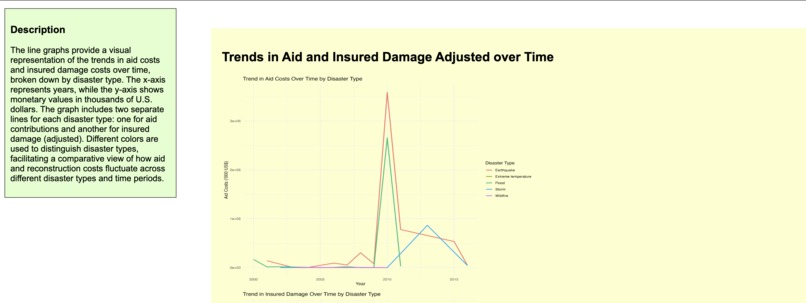
Line graphs that provide a visual representation of the trends in aid costs and insured damage costs over time, broken down by disaster type
-
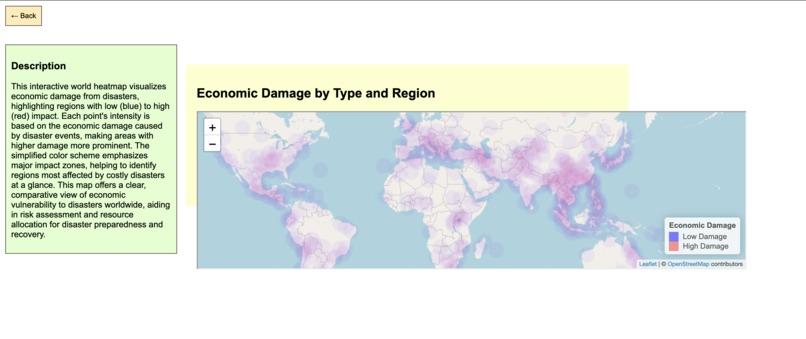
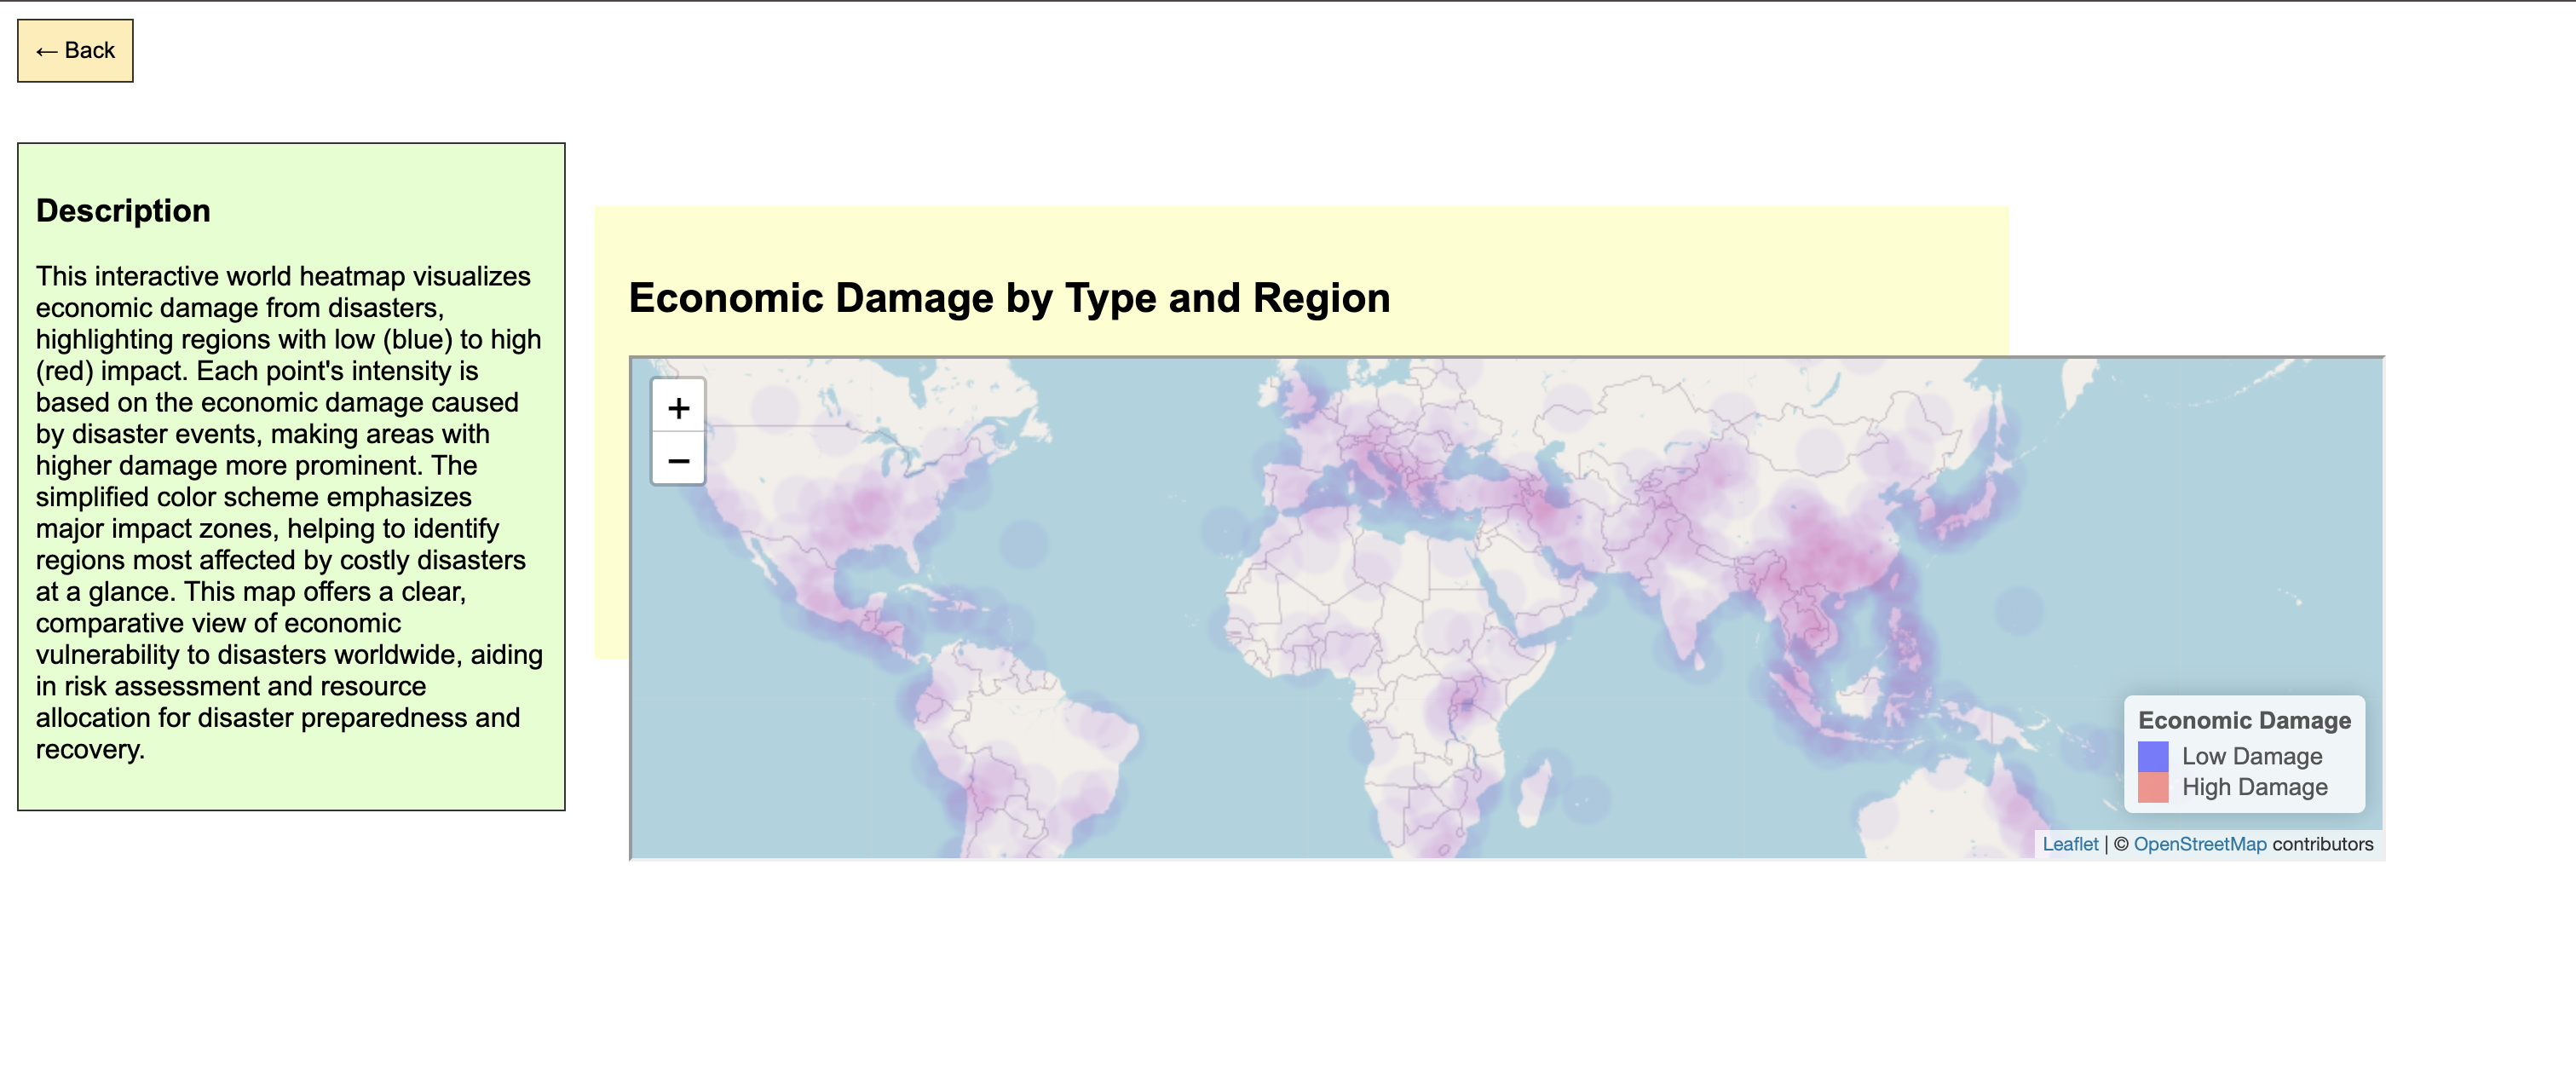
Interactive world heatmap that visualizes economic damage from disasters, highlighting regions with low (blue) to high (red) impact.
-
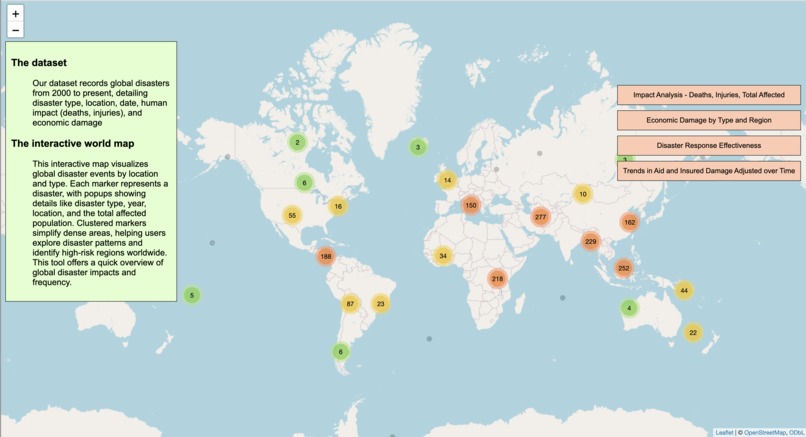
Main map - Interactive map visualizes global disaster events by location and type.
-
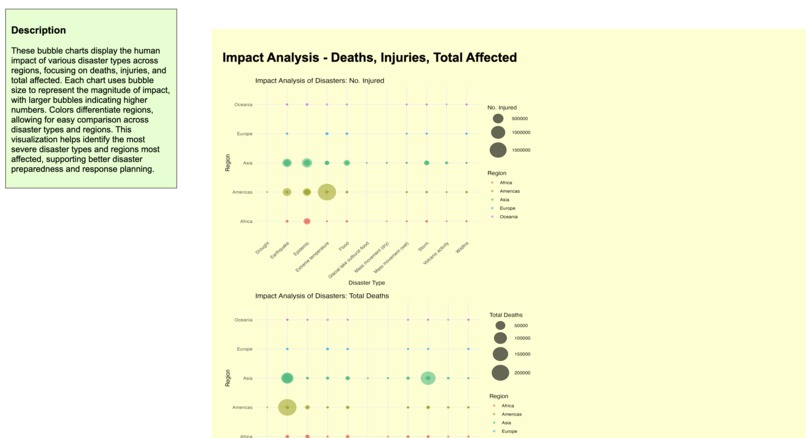
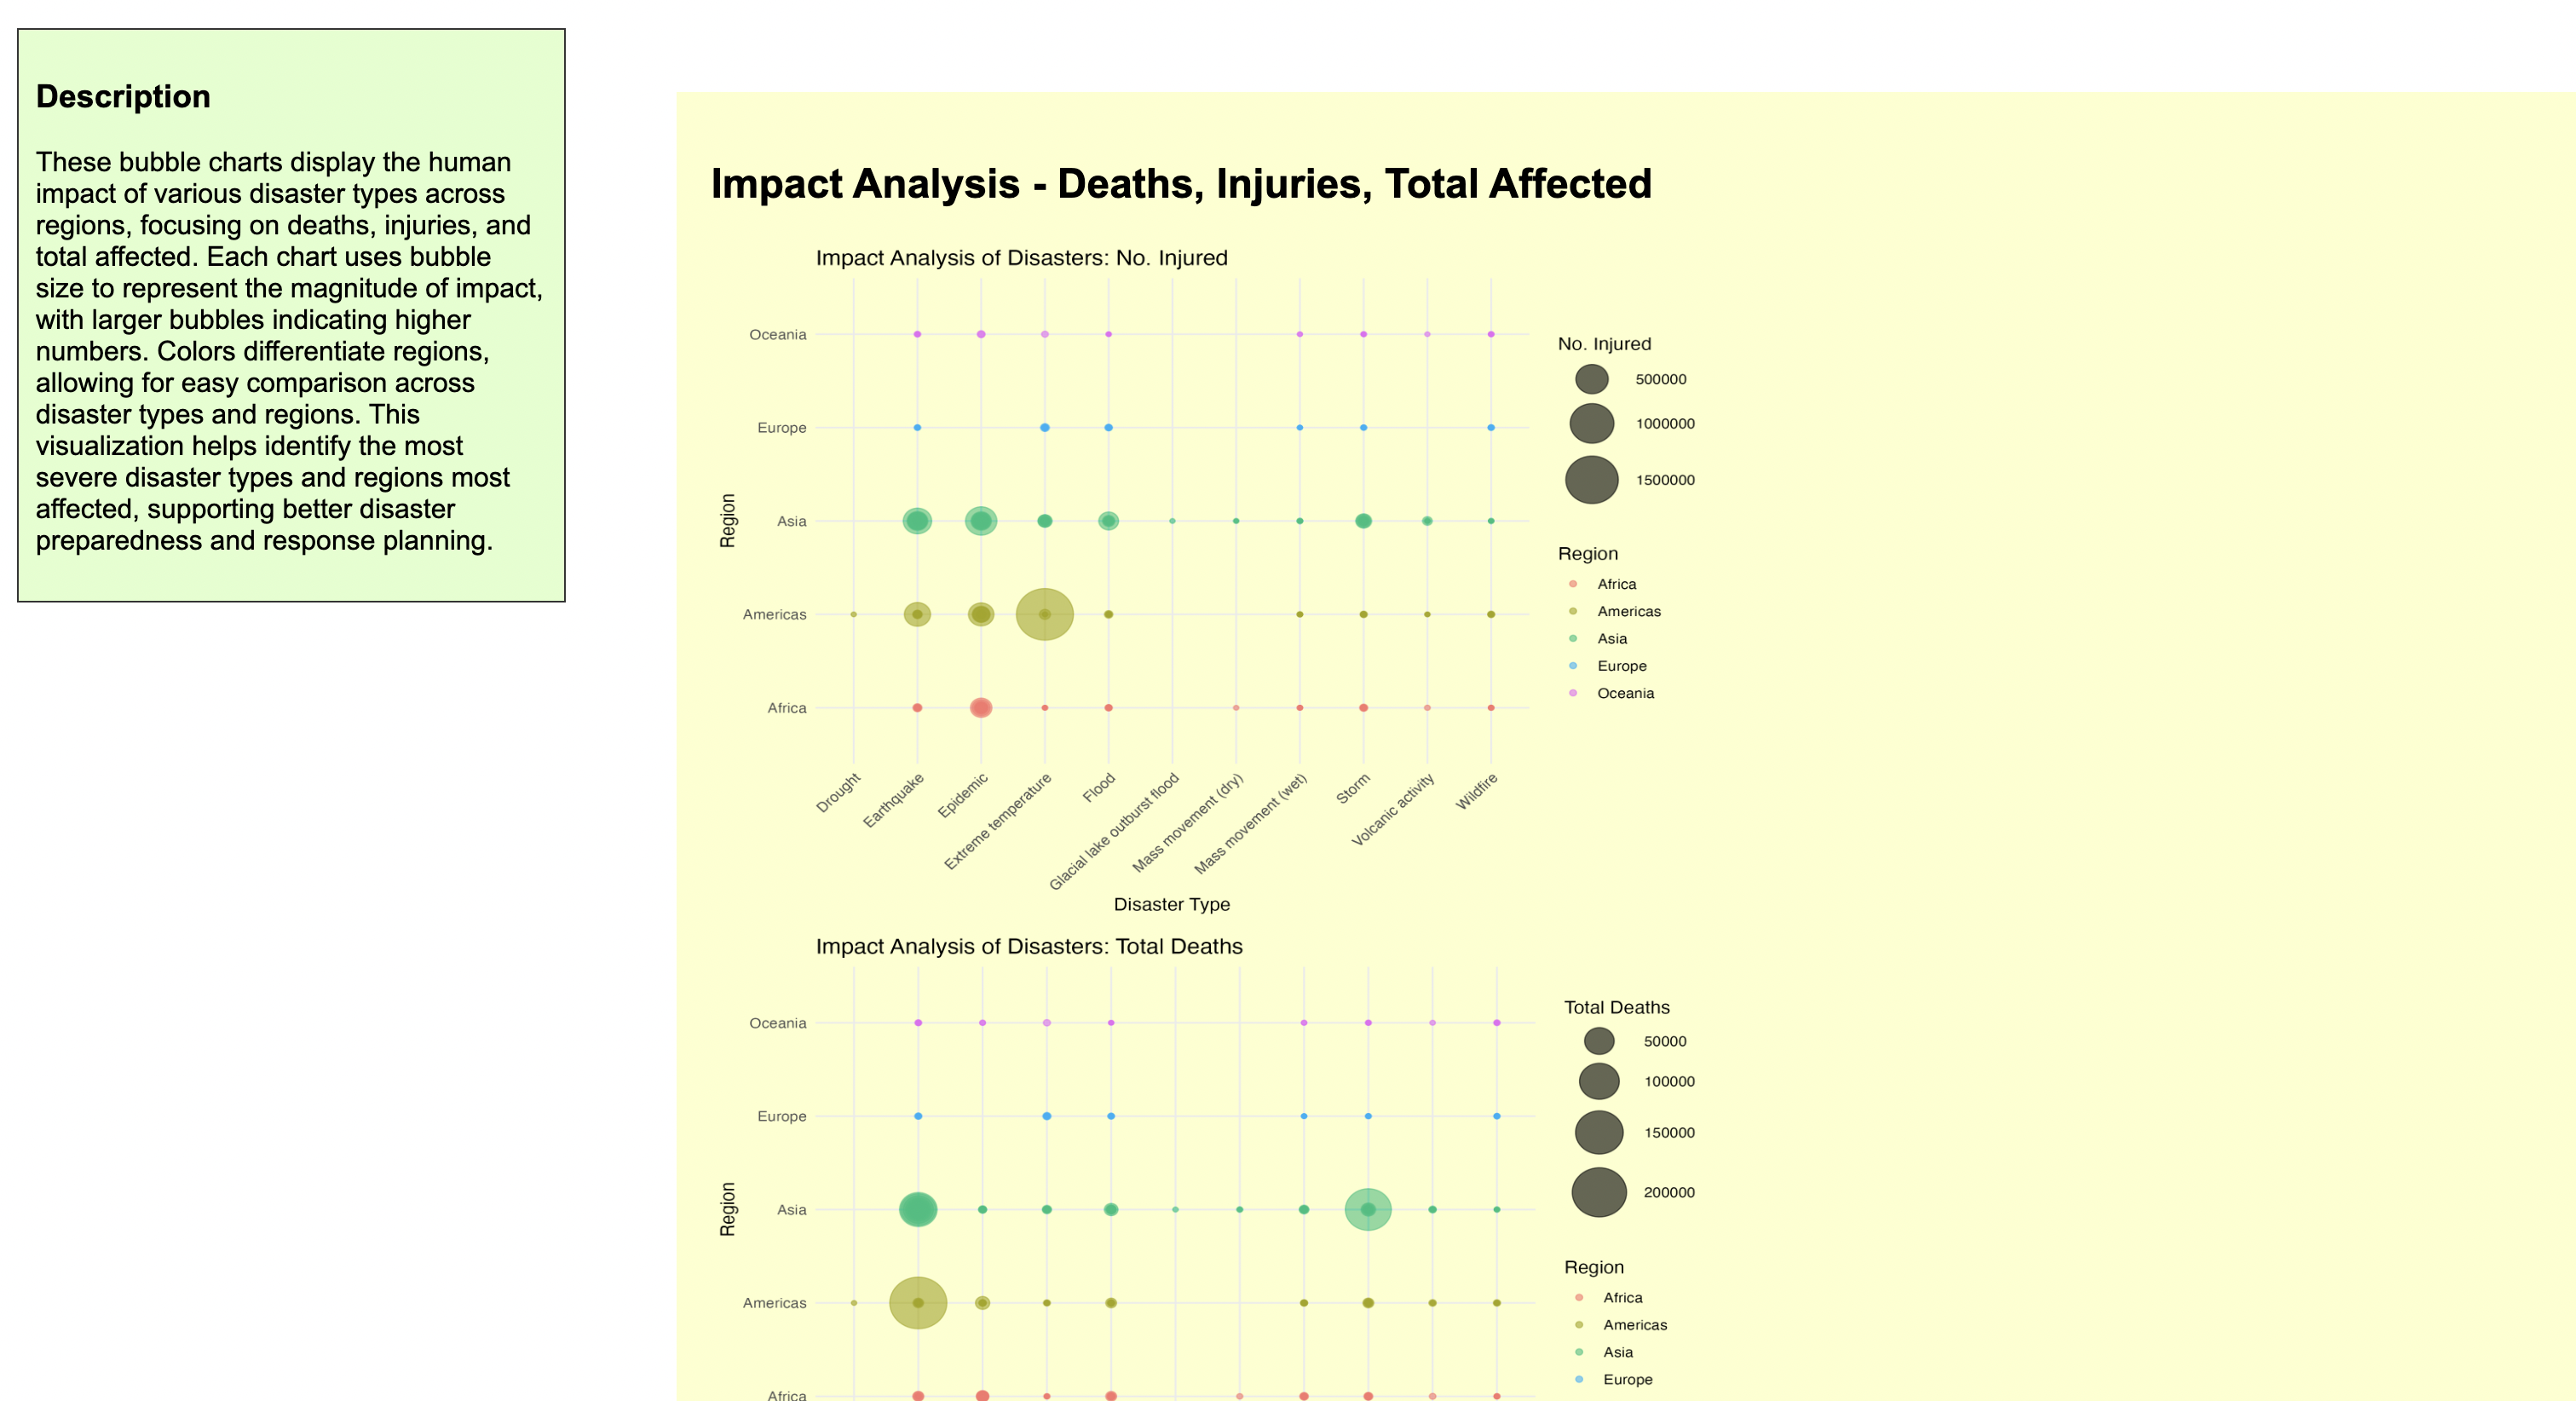
Bubble charts that display the human impact of various disaster types across regions, focusing on deaths, injuries, and total affected.


Inspiration
We decided to stick with the topic of natural disaster because one of the team members' hometown is frequently hit by earthquakes, and the government lacks high quality predictive systems, which make it hard for people to respond efficiently. These experiences sparked our shared mission - develop a tool that could help communities worldwide prepare for future risks by predicting them before they occur. We designed a platform that combines historical data with advanced AI systems to offer vision that empower people to take proactive measures, reduce impact, and ultimately save lives.
What it does
DisasterWise is an interactive platform that provides users with a data-driven understanding of disaster risks for any selected region. Users can access historical disaster data, including economic damages, fatalities, injuries, and affected populations. DisasterWise also offers an AI-powered Disaster Risk Index (WRI) that predicts future risk levels, enabling communities and policymakers to make informed decisions about resource allocation and preparedness. By visualizing trends in response effectiveness, financial aid, and insured losses, DisasterWise helps users understand both past and future vulnerabilities in a comprehensive and actionable way.
How we built it
We started by gathering and merging datasets from the EM-DAT Global Disaster Database and the WorldRiskReport. Next step was to standardize and clean the data in RStudio before moving on to Python for further data processing. Using the Keras and TensorFlow libraries, we developed a neural network model capable of predicting the WRI based on features like exposure, vulnerability, and adaptive capacity. For the frontend, we built an intuitive interface with HTML, CSS, and JavaScript, with an interactive map powered by Leaflet that lets users explore disaster risk by region.
Challenges we ran into
We faced few challenges along the way: First of all, handling incomplete data and inconsistencies to make our neural network model generalize well across diverse datasets. Second, creating a cohesive user experience especially in finding ways to visualize complex data without overwhelming users. We spent significant time iterating on our map interface to ensure it felt intuitive and informative. Lastly, combining everything in one platform that will effectively address all the goals and give the desired result
Accomplishments that we're proud of
The biggest achievement for us is that we were able to build a platform that makes disaster risk data accessible and meaningful to a wide audience. From the small steps in accomplishing this is that we’re proud of achieving a high level of accuracy in our disaster risk predictions, allowing us to provide reliable insights. We’re also proud of the intuitive user interface, which presents detailed data in a digestible format.
What we learned
Through this project, we learned the complexities of working with complex datasets and navigating the data in-between a couple of datasets: from cleaning and preprocessing large datasets to balancing our model’s predictive power with generalizability. We also gained additional experience in frontend development, learning how to present complex data visually for maximum user impact. Perhaps most importantly, we learned the value of combining different skill sets and perspectives; each team member was responsible for the separate part of the project; however, we still interchanged our comments to improve each other’s work.
What’s next for DisasterWise
Looking forward, we envision integrating real-time data feeds to keep the WRI predictions as current as possible, allowing for immediate updates in disaster risk information. We also aim to expand DisasterWise into a mobile app to improve accessibility and provide real-time alerts to users. Additionally, we plan to partner with NGOs and government agencies to help them leverage DisasterWise for disaster preparedness initiatives. Our ultimate goal is to equip communities worldwide with the insights they need to protect lives and minimize disaster impact, making DisasterWise an essential tool for resilience and recovery.

 Liu")

Log in or sign up for Devpost to join the conversation.