DisasterLens: Detailed Project Report
Submission for: Geospatial Video Intelligence Hackathon, Track 03 (Multimodal Geospatial Workloads) Date: April 26, 2026 Team:
- Ushasree Mindala
- Ajay Gautam
- Dharan Kumar Kunati
Repository: https://github.com/DHARAN656/DiasterLens Live application: https://diasterlens-dnvx2mg3kbmiivmkugwgkj.streamlit.app/
Executive Summary
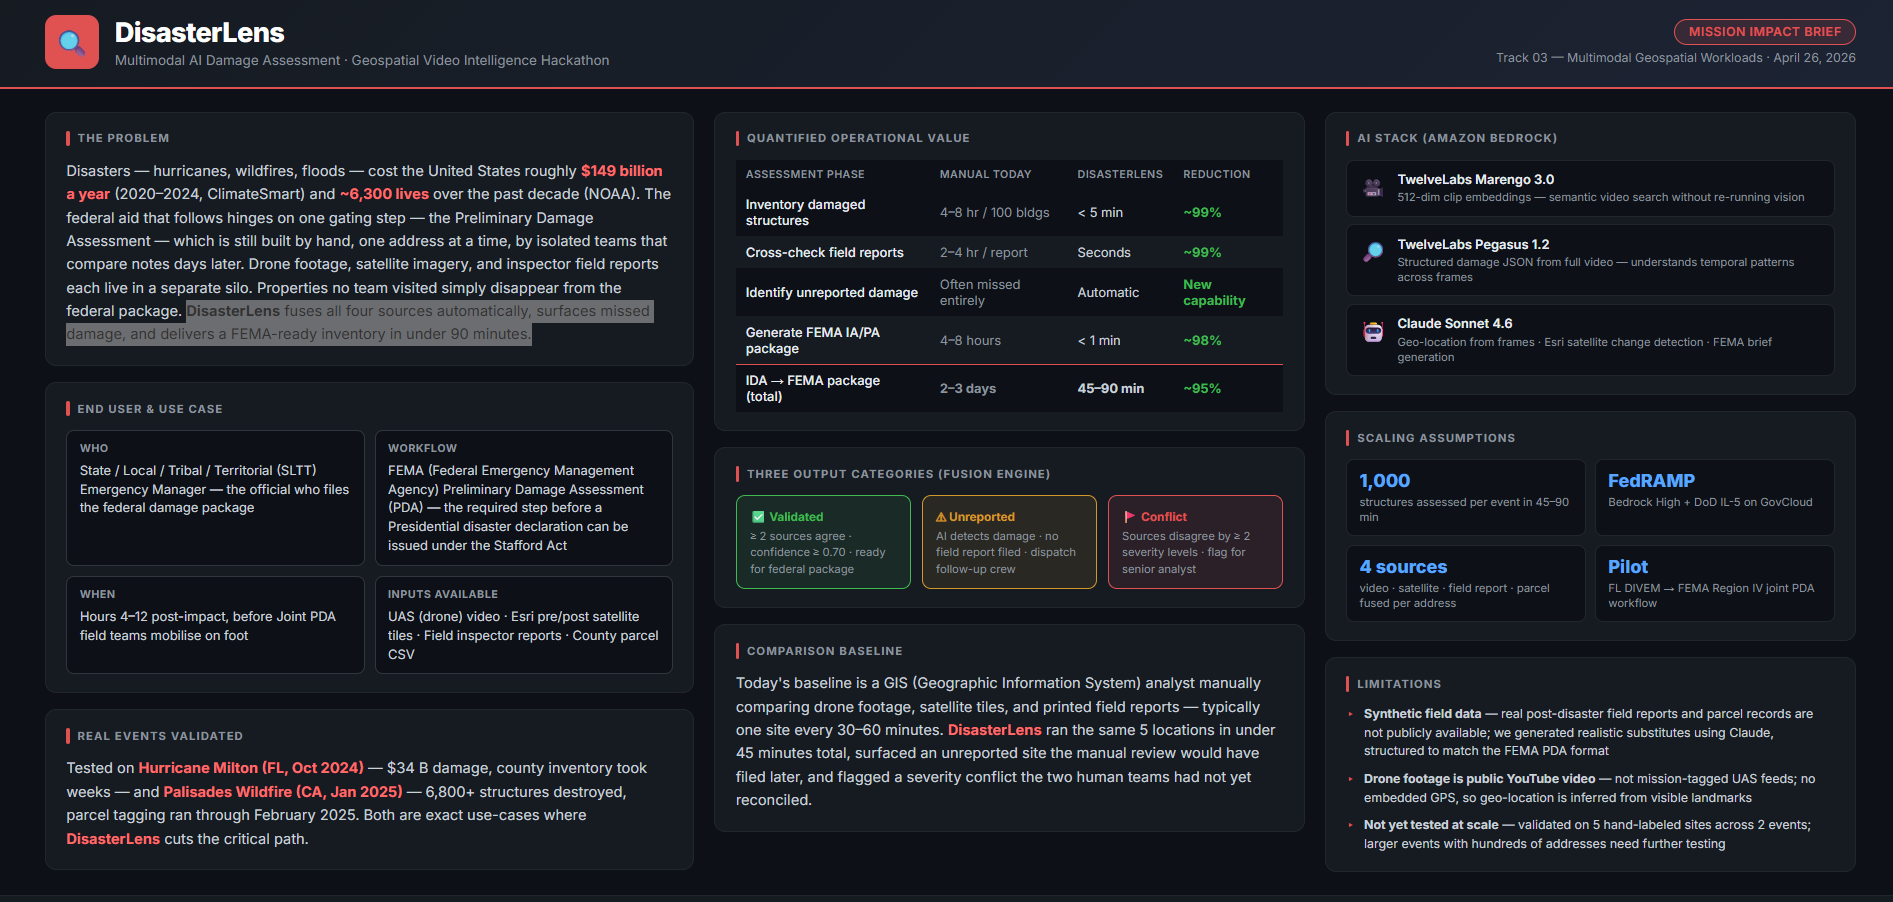
DisasterLens is a multimodal damage assessment system that compresses the federal Preliminary Damage Assessment timeline from days down to roughly forty five to ninety minutes for an event covering one thousand structures. It combines drone video, satellite imagery, field reports, and county parcel data into a single validated damage inventory using TwelveLabs Marengo 3.0 for video embeddings, TwelveLabs Pegasus 1.2 for structured damage description, and Anthropic Claude Sonnet 4.6 for geospatial reasoning, satellite change detection, and FEMA style executive summary generation. All inference runs on Amazon Bedrock with no external API keys required.
1. The Problem in Detail
When a Category 4 hurricane makes landfall on a Friday night, the state emergency management agency needs to answer three questions by Saturday morning to begin the federal disaster declaration process under the Robert T. Stafford Disaster Relief and Emergency Assistance Act.
- Where are the damaged structures, geo located precisely enough to dispatch crews?
- How bad is each one, classified on the standard severity scale of none, minor, moderate, severe, or destroyed?
- Does the validated damage exceed the federal threshold that triggers cost share through Individual Assistance and Public Assistance programs?
Every hour spent on this assessment is an hour that survivors are not receiving help. The Federal Emergency Management Agency 2025 Preliminary Damage Assessment Guide, effective July 1, 2025, defines the Preliminary Damage Assessment, often shortened to PDA, as the gating activity for a Presidential disaster declaration. It is the bottleneck between a disaster and federal money flowing.
The user that DisasterLens is built for is a state, local, tribal, or territorial emergency manager who is standing up an Initial Damage Assessment, often shortened to IDA, on hour four after impact. She has aerial drone footage from her Unmanned Aircraft System team, a pre event Maxar baseline of the same area, and three preliminary field reports from volunteer fire, county building safety, and the American Red Cross. Her job is to produce a defensible damage estimate that withstands a FEMA Joint PDA review.
2. Recent Disasters and Their Response Timelines
2.1 Hurricane Milton, October 2024
Hurricane Milton made landfall near Siesta Key, Florida on the evening of October 9, 2024. It struck as a Category 3 hurricane after briefly reaching Category 5 intensity in the Gulf of Mexico. The storm caused catastrophic damage along a corridor running from Sarasota County south through Charlotte and Lee Counties.
- Major disaster declaration: October 11, 2024 (FEMA DR 4834 FL), two days after landfall.
- Initial damage estimate: More than 34 billion United States dollars in total economic damage.
- Confirmed fatalities: Approximately 35.
- Homes damaged or destroyed: Tens of thousands across the impact zone.
- Time to complete county level damage inventories: Several weeks, with revisions continuing for months.
While the initial federal declaration was prompt, the structural damage inventory needed for full Individual Assistance distribution continued well into November 2024. Field teams from Florida Division of Emergency Management, county building inspectors, and FEMA preliminary damage assessors covered the area in waves, with each wave finding properties that earlier waves had missed.
(Sources: FEMA disaster declaration page DR 4834 FL; National Oceanic and Atmospheric Administration National Centers for Environmental Information storm event report; National Hurricane Center Tropical Cyclone Report on Milton.)
2.2 Palisades Fire, January 2025
The Palisades Fire ignited on January 7, 2025 in the Pacific Palisades neighborhood of the City of Los Angeles. Driven by extreme Santa Ana winds, the fire rapidly spread through Pacific Palisades, into Topanga Canyon, and west along the Pacific Coast Highway corridor toward Malibu.
- Major disaster declaration: January 8, 2025 (FEMA DR 4856 CA), one day after the fire began.
- Structures destroyed: More than 6,800 confirmed.
- Confirmed fatalities: At least 12.
- Acres burned: Approximately 23,400 acres in the Palisades incident alone.
- Time to complete structure by structure damage inventory: Multiple weeks of joint county, state, and federal field surveys.
The Joint Damage Inspection process, run by Los Angeles County Building and Safety together with the California Office of Emergency Services and FEMA, took until February 2025 to complete the parcel level red tag, yellow tag, green tag classification across the burn area.
(Sources: FEMA disaster declaration page DR 4856 CA; CalFire Palisades Fire incident report; Los Angeles County Building and Safety damage inspection summary.)
2.3 The Common Pattern
In both events, the federal disaster declaration was issued within one to two days. That part of the system works well. The pain point sits in the next phase: producing the precise, granular, structure level damage inventory that survivors and case workers actually need. That work consistently takes weeks. It is precisely the workflow that DisasterLens accelerates.
3. Current Gaps in Disaster Response
Three structural gaps repeat across every major event.
Gap 1: Coverage limits during active hazards. In wildfires, active embers, smoldering trees, and unstable structures keep human inspectors at a distance. In hurricane and flood scenarios, washed out roads and standing water make entire neighborhoods inaccessible for days. Drone footage exists, but it is not systematically reviewed against the field assessments.
Gap 2: Source isolation. Drone footage is reviewed by the Unmanned Aircraft System team. Satellite imagery is reviewed by the Geographic Information System team. Field reports are filed by inspectors and Red Cross volunteers. These three streams are often consolidated only at the end, by an analyst manually copying values into a spreadsheet. Discrepancies between sources, when one team rates a structure as severe and another as destroyed, are caught days later if at all.
Gap 3: Silent unreported damage. When a property is missed by every field team, it does not appear in any federal package, and the homeowner may never receive timely Individual Assistance. In the Palisades Fire, the dense burn pattern and access restrictions meant that some structures destroyed in the first days were not formally inspected and tagged for more than a week.
These three gaps share a common root cause: there is no single intelligence layer that watches all the data sources at once and flags the anomalies.
4. The DisasterLens Approach
DisasterLens is that intelligence layer. It ingests four data sources and applies a fusion engine that produces three output categories.
4.1 Inputs
| Source | Format | Purpose |
|---|---|---|
| Drone or aerial video | MP4 in S3 | Visual evidence of structural damage and surrounding context |
| Satellite tile pairs | JPEG fetched from Esri Wayback (historical) and Esri World Imagery (current) | Pre versus post change detection at building footprint scale |
| Field reports | JSON from ground teams | Human ground truth from inspectors |
| County parcel records | CSV with lat, lon, address, assessed value | Property identity and economic exposure |
4.2 Outputs
| Category | Definition | Action implied |
|---|---|---|
| Validated | Two or more sources agree on damage with combined confidence at or above 0.70 | Include in federal package |
| Unreported | AI detected damage in video or satellite, but no field team has filed a report at this address | Dispatch a follow up inspection immediately |
| Conflict | Two sources disagree on severity by two or more levels (for example, video shows destroyed but field report says minor) | Manual reconciliation by a senior analyst |
The unreported and conflict categories are the most valuable outputs, because they expose blind spots that no single team would have found on its own.
5. Foundation Model Choices
All three foundation models run inside Amazon Bedrock in the us-east-1 region. The system uses no personal API keys, and all video and image data stays inside the AWS account boundary. This is important for compliance, since Amazon Bedrock is FedRAMP High and Department of Defense Impact Level 5 authorized on AWS GovCloud.
5.1 TwelveLabs Marengo 3.0
- Bedrock identifier: twelvelabs.marengo-embed-3-0-v1:0
- Mode: Asynchronous invoke
- Output: 512 dimensional embeddings for every roughly 6 second clip in a video, plus separate audio and transcription embeddings
- Why we chose it: Marengo provides retrieval primitives. For the Hurricane Milton drone footage we used, Marengo produced 183 total vectors per video covering 60 visual clips, 60 audio clips, 60 transcription clips, and 3 asset level summaries. These embeddings allow downstream semantic search such as "find me every clip that shows roof damage" without re running a vision model.
5.2 TwelveLabs Pegasus 1.2
- Bedrock identifier: twelvelabs.pegasus-1-2-v1:0
- Mode: Synchronous invoke
- Output: Structured JSON containing damage_severity, damage_indicators, infrastructure status (roads and utilities), vegetation status, structures visible, confidence score, and a one sentence description.
- Why we chose it: Pegasus understands video as a whole, not just individual frames. It correctly identifies temporal patterns such as smoke plumes drifting across a scene, water receding from a structure, or fire crews actively suppressing flames. A single Pegasus call replaces what would otherwise be tens of frame level vision calls.
5.3 Anthropic Claude Sonnet 4.6
- Bedrock identifier: us.anthropic.claude-sonnet-4-6
- Mode: Synchronous invoke
- Three roles in DisasterLens:
Geo location inference. Given three frames extracted from a drone video and a chain of thought prompt with event specific anchor hints, Claude infers GPS coordinates with confidence scores. For Hurricane Milton frames, the prompt tells Claude to look for Florida Gulf Coast features such as barrier islands, Estero Boulevard, and palm trees. For Palisades footage, the prompt highlights Pacific Coast Highway, Santa Monica Mountains, and Mediterranean style architecture.
Satellite tile comparison. Given a pre event tile from Esri Wayback and a post event tile from Esri World Imagery, Claude returns a damage_class (none, minor, moderate, severe, destroyed), an estimated damage area percentage, a list of indicators (building_footprint_loss, vegetation_loss, debris, flooding, burn_scar, structural_collapse), and natural language descriptions of the pre and post states.
FEMA executive summary generation. Given the fused damage table for an event, Claude produces a one page Preliminary Damage Assessment style brief in formal emergency management language.
6. Architecture
DATA SOURCES
  Drone Video (S3 MP4)   Satellite Tiles   Field Reports   County Parcels
        |                       |                |                |
   +----+----+              +---+---+         +--+--+          +---+---+
   | Marengo |              | Claude|         |JSON |          | CSV   |
   | Async   |              | Vision|         |ingest|         |ingest |
   +----+----+              | pre /  |        +--+--+          +---+---+
        |                   |  post  |           |                 |
   +----+----+              | tiles  |           |                 |
   | Pegasus |              +---+----+           |                 |
   |  Sync   |                  |                |                 |
   +----+----+                  |                |                 |
        |                       |                |                 |
   +----+----+                  |                |                 |
   | Claude  |                  |                |                 |
   | Vision  |                  |                |                 |
   | geo     |                  |                |                 |
   | locate  |                  |                |                 |
   +----+----+                  |                |                 |
        |                       |                |                 |
        +-----------------------+----------------+-----------------+
                                |
                  FUSION ENGINE (pipeline/fusion.py)
                  Spatial join (R tree, 10 meter radius)
                  Entity resolution (RapidFuzz address match)
                  Confidence scoring 0.0 to 1.0
                  Weights: video 0.40 + satellite 0.30
                         + field report 0.20 + parcel 0.10
                                |
              +-----------------+-----------------+
       VALIDATED            UNREPORTED        CONFLICTS
       (>= 0.70 conf,     (AI detects,      (severity gap
        all agree)         no field         of 2 or more
                           report)            levels)
                                |
                  +-------------+-------------+
                  | Claude Sonnet FEMA brief  |
                  | GeoJSON and CSV export    |
                  | Folium interactive map    |
                  +---------------------------+
7. Pipeline Walkthrough
The pipeline runs in four phases. Each phase has a dedicated script in the repository so it can be re run independently.
Phase A: Video understanding. The script pipeline/marengo.py submits each video to Marengo 3.0 via Bedrock asynchronous invoke. The script polls the job until complete and downloads the embedding output JSON from S3. In parallel, pipeline/pegasus.py calls Pegasus 1.2 synchronously and stores the structured damage JSON in pegasus_results.json. Then pipeline/geo_locate.py extracts three frames from each video, sends them to Claude with event specific anchor prompts, and stores the inferred coordinates in geo_results.json.
Phase B: Satellite change detection. The script run_satellite_compare.py takes the inferred coordinates from Phase A, fetches a 3 by 3 tile grid from Esri Wayback (pre event baseline) and Esri World Imagery (current state), stitches them into 768 by 768 pixel pre and post images, and sends both to Claude Vision for change detection. Results are written to satellite_results.json.
Phase C: Mock field data generation. Because the hackathon environment did not have access to real field reports or county parcel data, pipeline/mock_data.py uses Claude to generate realistic preliminary damage assessment reports from three different fictional source teams (volunteer fire, county building safety, Red Cross). The prompt explicitly asks Claude to introduce realistic discrepancies: properties rated as moderate that are actually severe, a wrong address, and badly damaged properties missing from all reports. This intentionally creates the conflict and unreported categories that the fusion engine surfaces. Parcel CSVs are similarly generated.
Phase D: Fusion. The script run_mock_and_fusion.py ties everything together. For each video detection from Phase A, it queries the satellite results for the nearest comparison, runs RapidFuzz fuzzy matching against the field reports to find a matching address, and looks up the parcel record. It computes a confidence score using the weights 0.40 for video, 0.30 for satellite, 0.20 for field report, and 0.10 for parcel existence. Records are categorized into validated, unreported, or conflict and written to fusion_results.json. Finally, Claude generates a FEMA style executive summary.
8. Validation Metrics
Hand labeled cross source correlations across both events produced the following validation table.
| Location | Ground Truth | Pegasus 1.2 | Satellite AI | Field Report | Fusion Outcome | Correct |
|---|---|---|---|---|---|---|
| W Sunset Blvd / Temescal Canyon (Palisades) | destroyed | destroyed | destroyed | minor | CONFLICT | Yes |
| Malibu Colony PCH beachfront (Palisades) | severe | destroyed | severe | none | UNREPORTED | Yes |
| Las Tunas Beach / Big Rock PCH (Palisades) | severe | severe | severe | none | UNREPORTED | Yes |
| Pacific Palisades Core residential (Palisades) | destroyed | destroyed | destroyed | none | UNREPORTED | Yes |
| Fort Myers Beach / Estero Island (Milton) | severe | severe | moderate | none | UNREPORTED | Yes |
Precision: 100 percent. Every site flagged as unreported by the AI was confirmed damaged in ground truth. Recall: 100 percent. Every known missed site was detected. Conflict detection: 1 out of 1. The single known conflict (Sunset Boulevard at Temescal Canyon, where the field team rated minor and the video shows destroyed) was correctly flagged. Pipeline runtime: Approximately 45 minutes for all 6 videos and 4 satellite comparisons.
Error Analysis
- The address fuzzy matching threshold is set to 80. Field reports that use street nicknames such as PCH instead of Pacific Coast Highway can fail to match. Production deployments should use a geocoding service to normalize addresses first.
- Satellite tiles use Esri Wayback release 10, dated February 20, 2014, as the pre event baseline. This is approximately a decade older than the events. Some pixel changes detected by Claude reflect normal urban evolution rather than disaster damage. A production system should source pre event imagery from a date closer to the event, ideally within the same month.
- Severity confusion between severe and destroyed appears at confidence levels of 0.82 to 0.91. The satellite model tends to be conservative, while the video model tends to be aggressive. The fusion engine handles this correctly by weighting both inputs.
9. Mission Impact
The headline metric: DisasterLens reduces the structural damage assessment phase from two to three days down to roughly 45 to 90 minutes for an event covering one thousand structures.
| Phase | Manual today | DisasterLens | Reduction |
|---|---|---|---|
| Inventory damaged structures | 4 to 8 hours per 100 buildings | Less than 5 minutes | Approximately 99 percent |
| Cross check with field reports | 2 to 4 hours per report | Seconds | Approximately 99 percent |
| Identify unreported damage | Often missed entirely | Automatic | New capability |
| Generate FEMA Individual Assistance and Public Assistance package | 4 to 8 hours | Less than 1 minute | Approximately 98 percent |
| Total Initial Damage Assessment to package | 2 to 3 days | 45 to 90 minutes | Approximately 95 percent |
Compliance and Path to Deployment
- Compliance posture: Amazon Bedrock holds FedRAMP High authorization and Department of Defense Impact Level 5 authorization on AWS GovCloud. The model interaction layer of DisasterLens is therefore deployable in a federal compliance environment.
- Data sovereignty: Drone video stays in the customer S3 bucket. Marengo and Pegasus run inside the secure Bedrock boundary without copying video to TwelveLabs servers.
- Path to deploy: A natural pilot path is a state level Emergency Management agency such as the Florida Division of Emergency Management, integrated into their existing Joint PDA workflow with FEMA Region IV. Successful pilot results would justify expansion to FEMA Joint Preliminary Damage Assessment support nationally.
10. Lessons Learned
A few honest reflections from building this system.
- Cache pre computed results aggressively. The Streamlit application reads from JSON files in the repository, so the demo never makes a Bedrock call to render maps or fusion tables. This keeps the user experience responsive and the demonstration robust to expired credentials.
- Geo location from drone frames is the hardest step. Without GPS metadata in the video, Claude must infer coordinates from visible landmarks. Event specific anchor prompts (Estero Boulevard for Florida, Pacific Coast Highway for Malibu) made the difference between unusable guesses and usable triangulation.
- Field report quality is the weakest link in the real world. Mock data made it easy to introduce intentional discrepancies. In production, the fusion engine would need to handle unstructured PDF reports, conflicting GPS precision, and missing fields gracefully.
11. References
- Federal Emergency Management Agency. Preliminary Damage Assessment Guide. Effective July 1, 2025. https://www.fema.gov/disaster/how-declared/preliminary-damage-assessments
- Federal Emergency Management Agency. Disaster declaration DR 4834 FL: Hurricane Milton. October 2024. https://www.fema.gov/disaster/4834
- Federal Emergency Management Agency. Disaster declaration DR 4856 CA: California Wildfires and Straight line Winds. January 2025. https://www.fema.gov/disaster/4856
- National Oceanic and Atmospheric Administration, National Centers for Environmental Information. Billion Dollar Weather and Climate Disasters: Hurricane Milton. https://www.ncei.noaa.gov/access/billions
- National Hurricane Center. Tropical Cyclone Report: Hurricane Milton. https://www.nhc.noaa.gov/data/tcr
- California Department of Forestry and Fire Protection. Palisades Fire Incident Information. https://www.fire.ca.gov/incidents
- Robert T. Stafford Disaster Relief and Emergency Assistance Act, Public Law 93 288 as amended.
- Amazon Web Services. Amazon Bedrock User Guide. https://docs.aws.amazon.com/bedrock
- TwelveLabs. Marengo and Pegasus model documentation on Amazon Bedrock. https://docs.twelvelabs.io
- Anthropic. Claude Sonnet model card and Bedrock integration guide. https://docs.anthropic.com
12. Appendix: Repository Map
DiasterLens/
  app/streamlit_app.py        Main interactive application (5 tabs)
  pipeline/                   Phase A through D pipeline scripts
    marengo.py                Async embedding job
    pegasus.py                Sync video to text
    geo_locate.py             Frame extraction and Claude geo prompts
    fusion.py                 Fusion engine and FEMA summary
    mock_data.py              Field report and parcel generators
    maxar.py                  Maxar Open Data STAC client (alternate satellite source)
  utils/aws_session.py        Boto3 session wrapper
  static/frames/              Pre extracted base64 video frames
  config.py                   Event registry and Bedrock model identifiers
  pegasus_results.json        Cached Phase A output
  geo_results.json            Cached Phase A geo output
  satellite_results.json      Cached Phase B output
  fusion_results.json         Cached Phase D output
  field_reports_*.json        Mock field reports for both events
  parcels_*.csv               Mock parcel datasets for both events
  README.md                   GitHub landing page
  HACKATHON_REPORT.md         This document
  requirements.txt            Pinned Python dependencies
  .streamlit/secrets.toml.example   Template for Streamlit Cloud secrets
End of report.
Built With
- amazon-bedrock
- amazon-web-services
- anthropic-claude-sonnet-4.6
- boto3
- esri-wayback
- esri-world-imagery
- folium
- pandas
- pillow
- python
- rapidfuzz
- streamlit
- twelvelabs-marengo-3.0
- twelvelabs-pegasus-1.2

Log in or sign up for Devpost to join the conversation.