-

generated heatmap.
-

another generated heatmap.
-

homescreen.
-
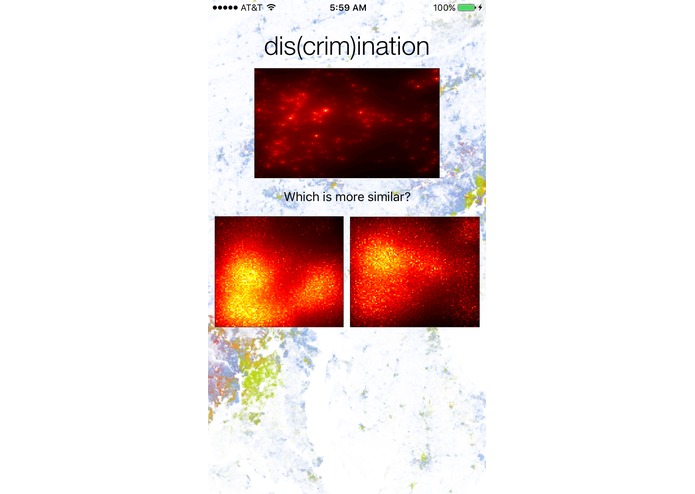
quizscreen.
-

results.


Inspiration
We were intrigued as to what the relationship between crime, poverty, and race was. Curious to find out more, we decided to do a project focused on answering these questions.
What it does
This application presents our findings in a quiz format: several of the heat-maps produced by our analyses of the open data sets are presented to the user, who then chooses the heat map they think most similar to crime.
Their performance and misconceptions are then analyzed.
How we built it
Matlab for data analysis; and Swift, HTML, and Javascript for the visualizations.
Challenges we ran into
Getting the data was hard. Making the app look somewhat nice was also pretty hard.
Accomplishments that we're proud of
The relationship (or lack of) between poverty, crime, and race is plain to see.
What we learned
More iOS. The difficulty of getting good data.
Built With
- baltimore-city-open-data
- html
- javascript
- matlab
- swift
- xcode


Log in or sign up for Devpost to join the conversation.