-
-
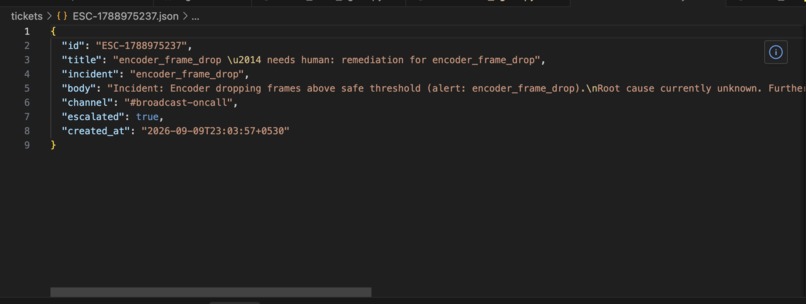
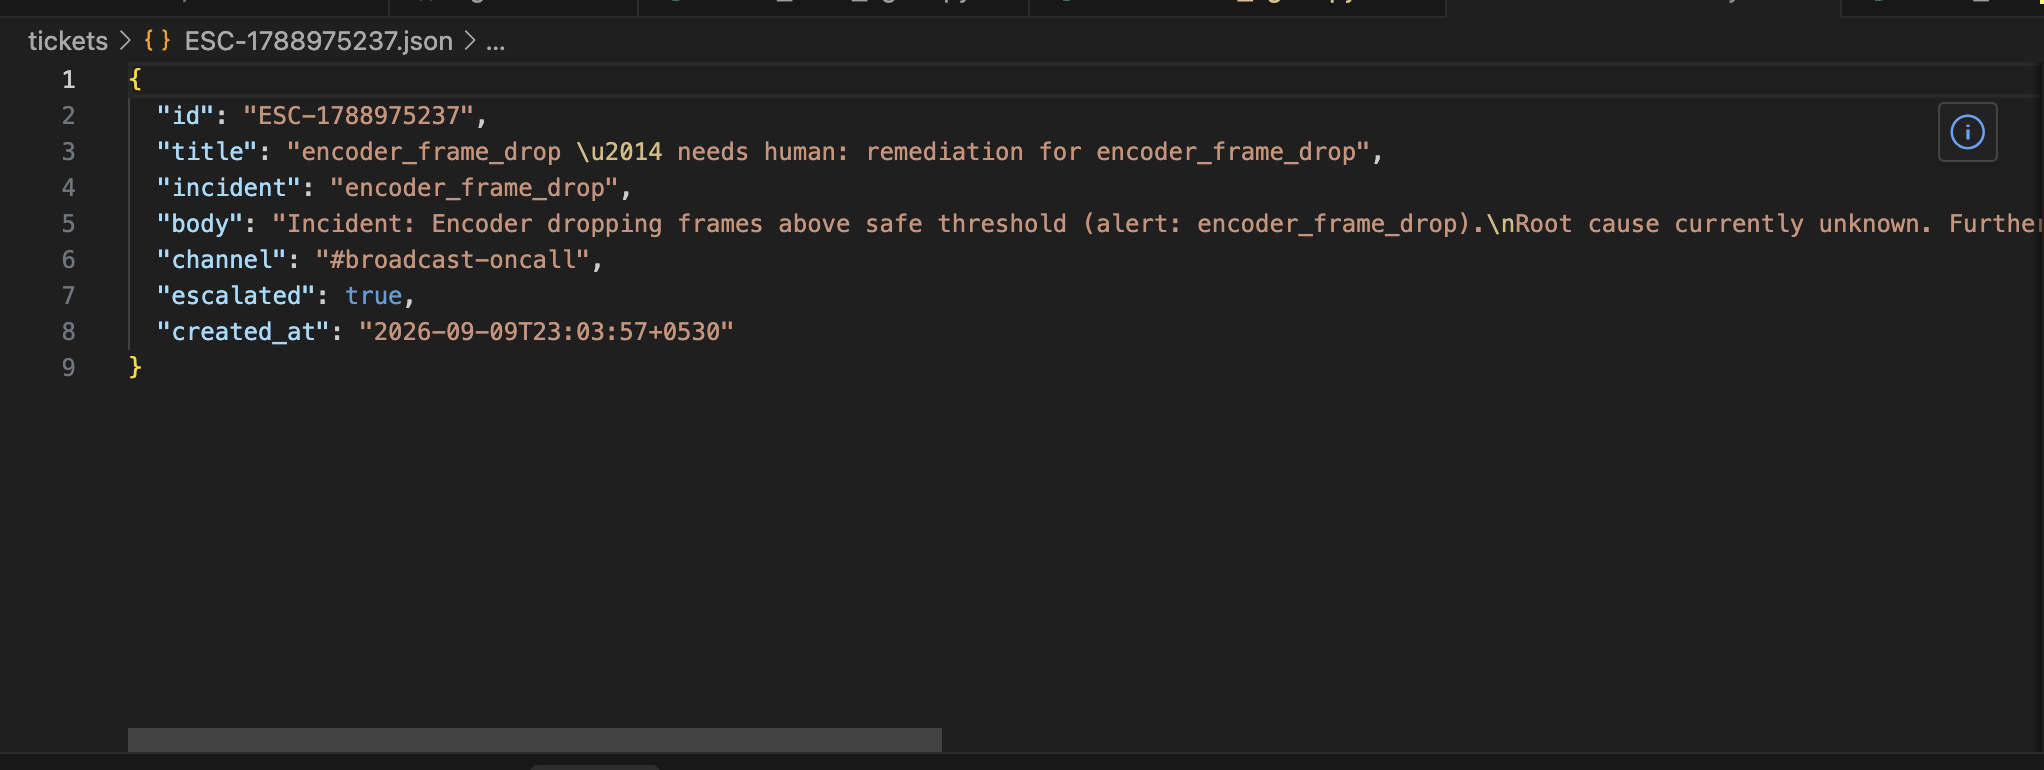
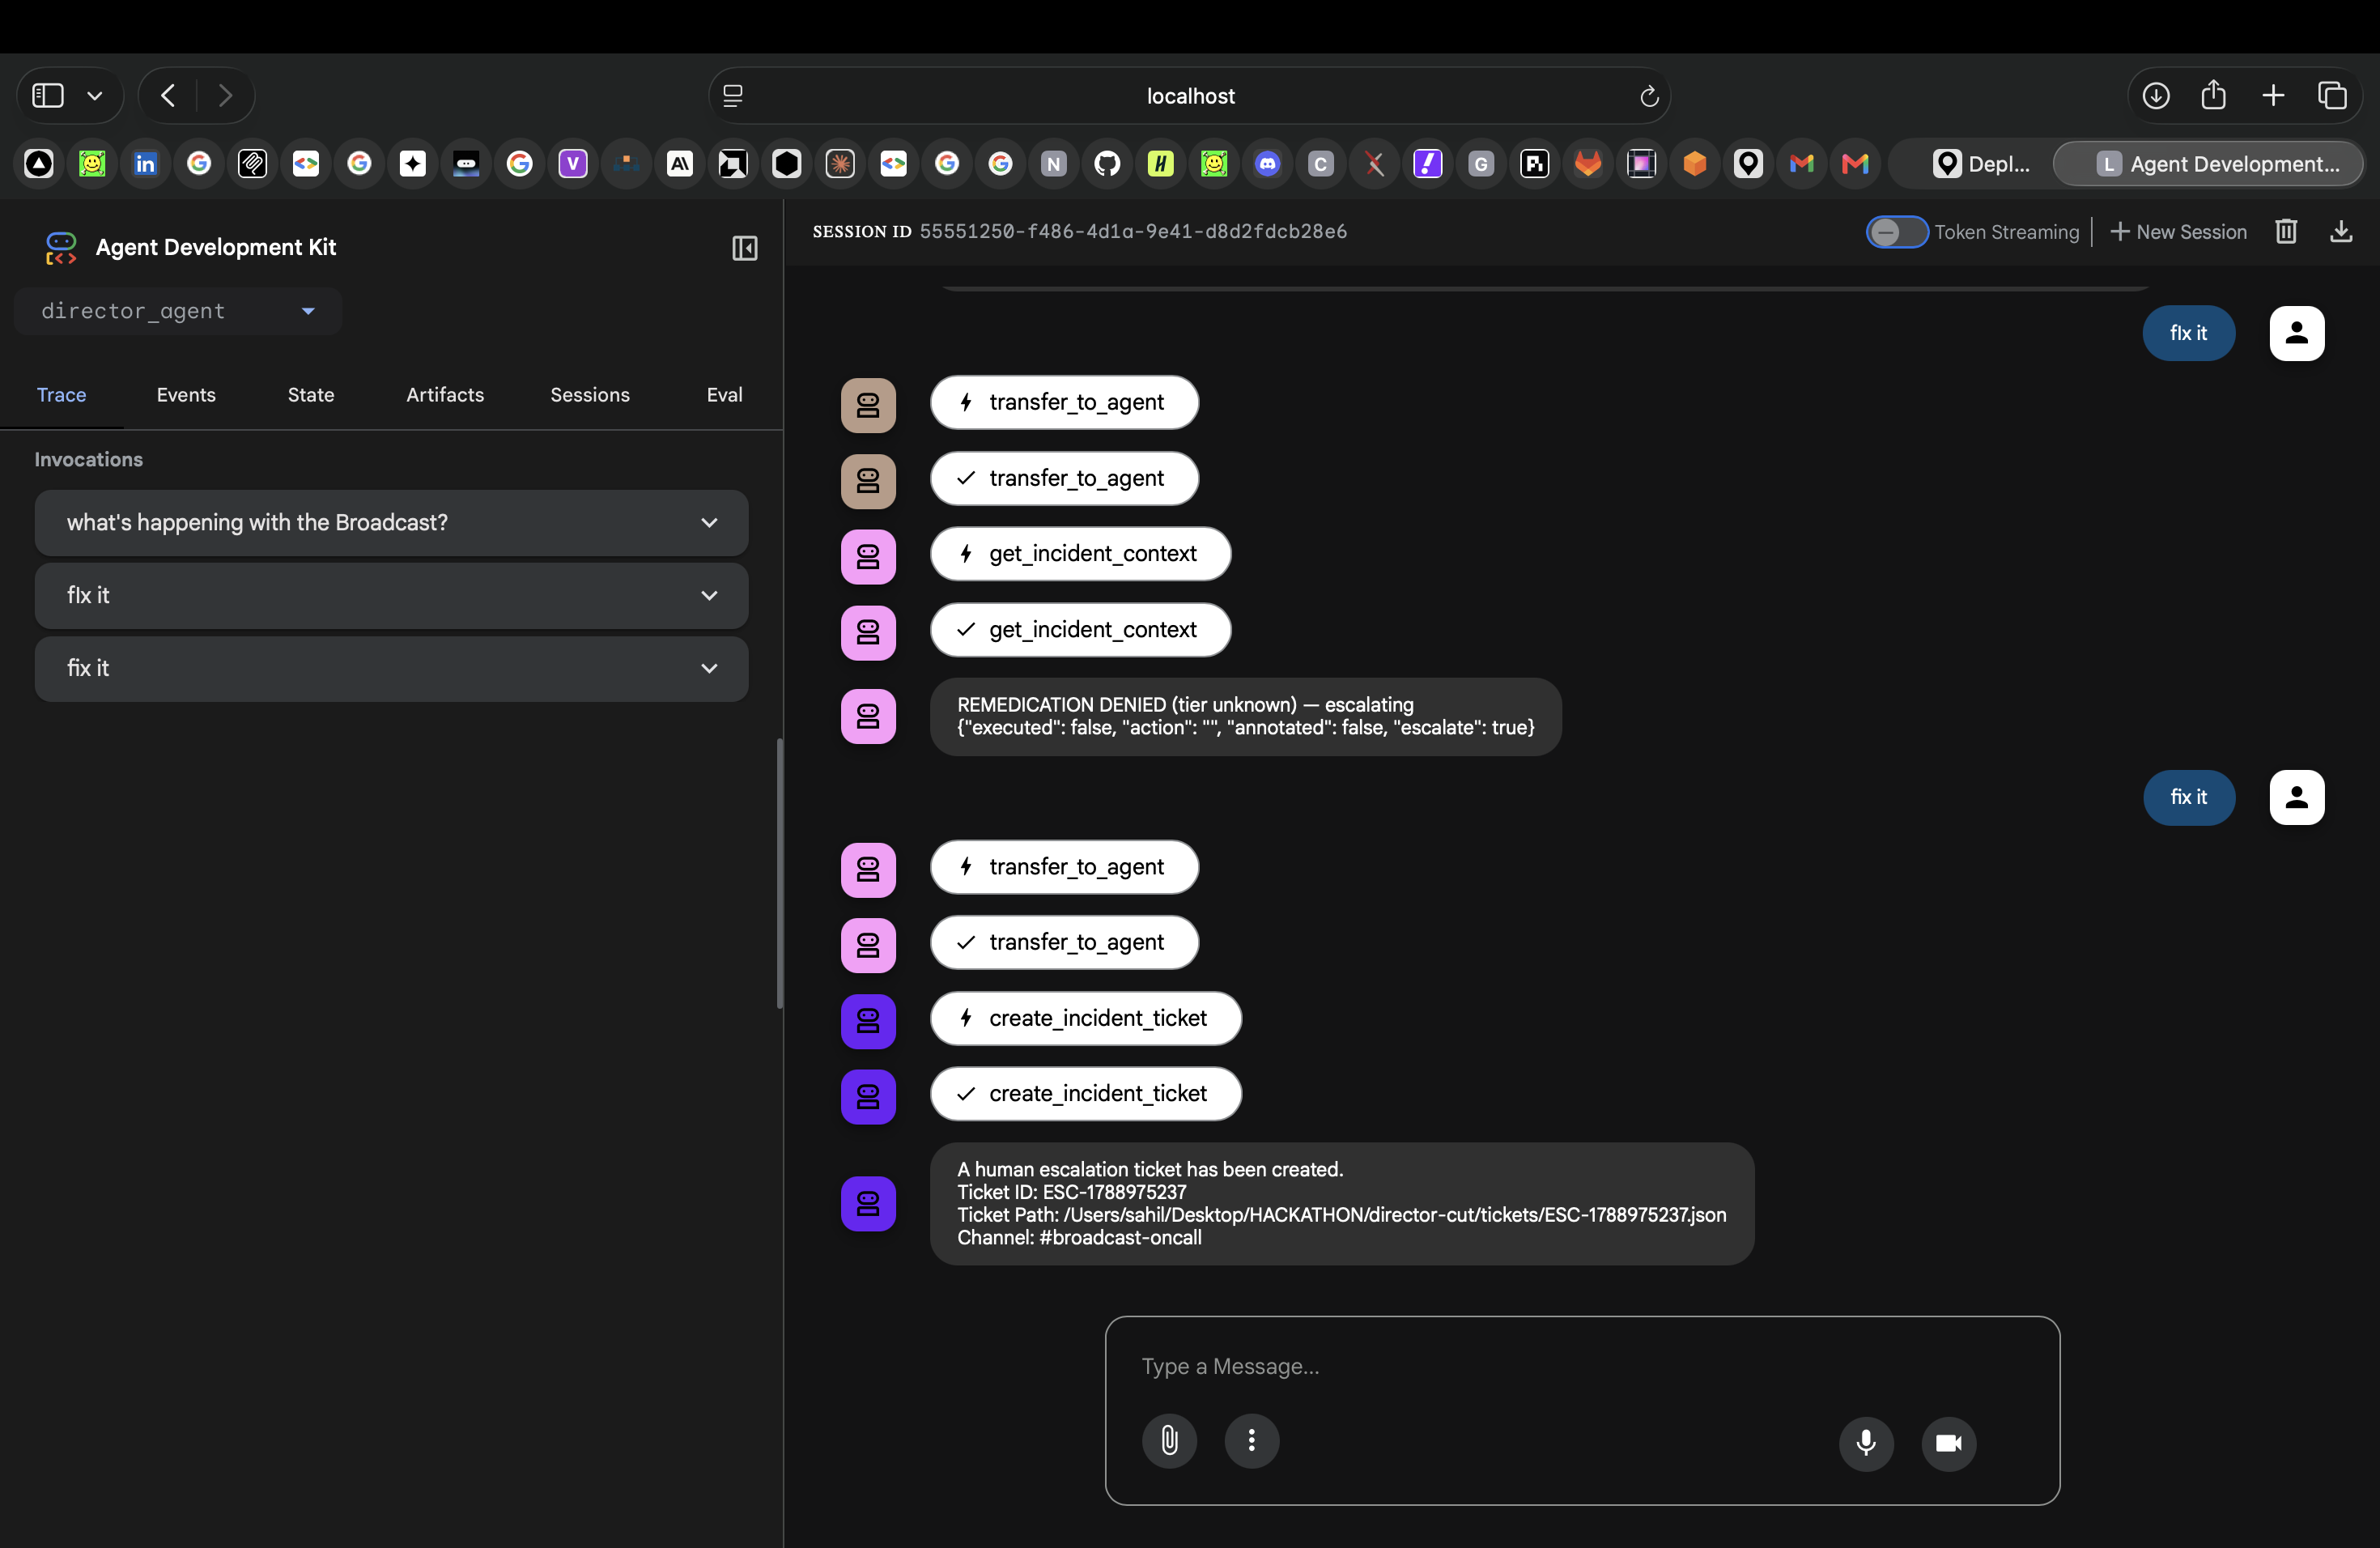
ticket Snapshot
-
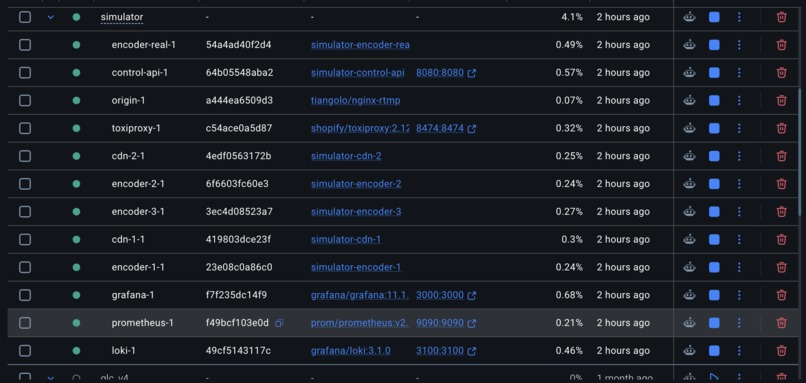
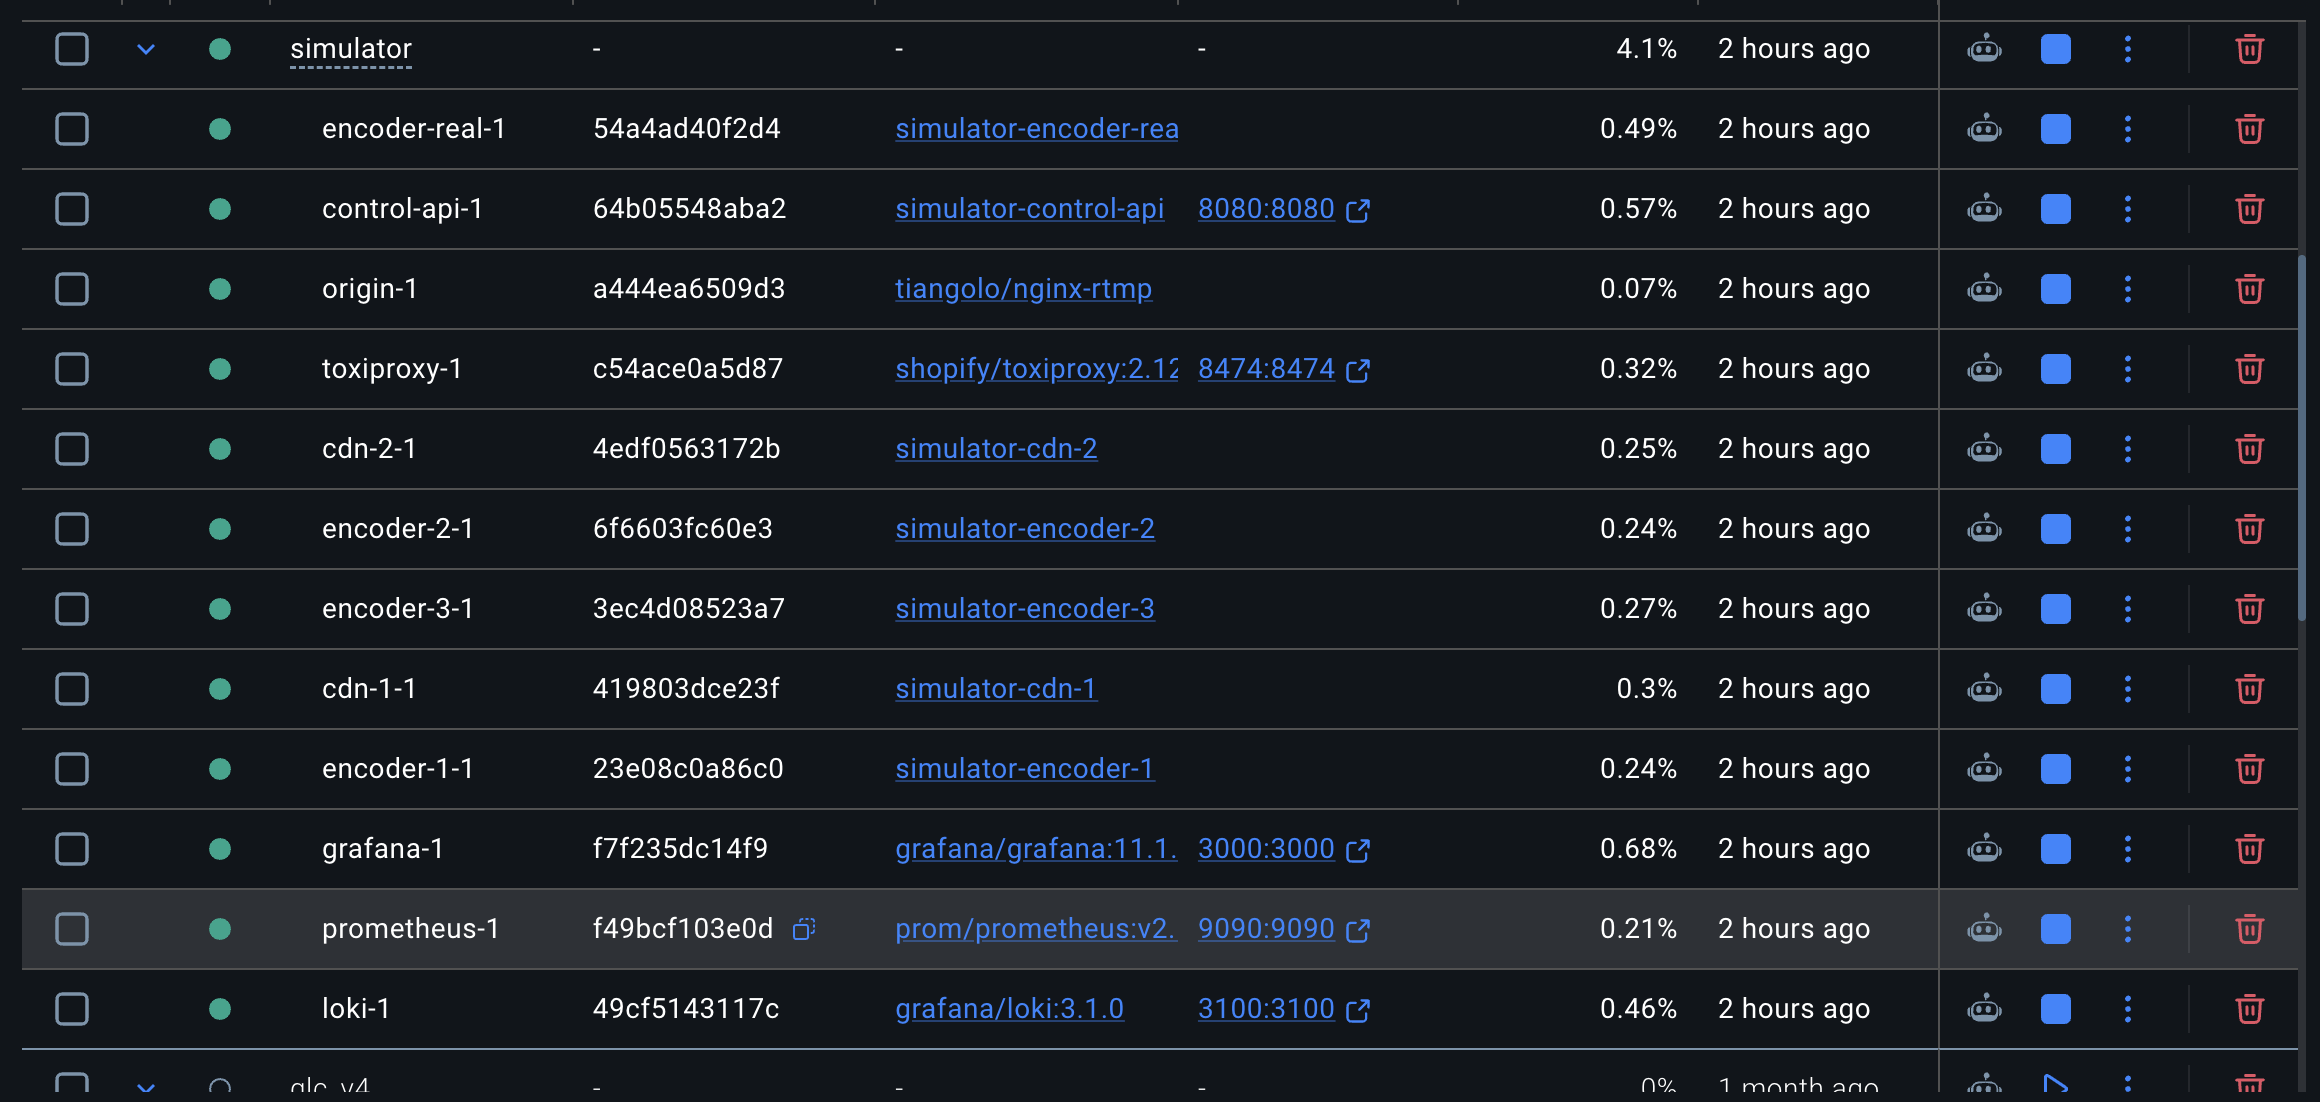
Simulator in DOCKER
-
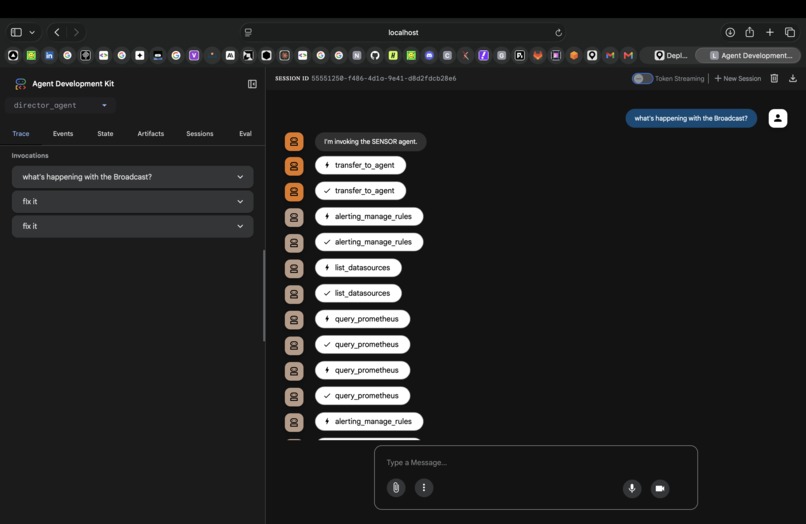
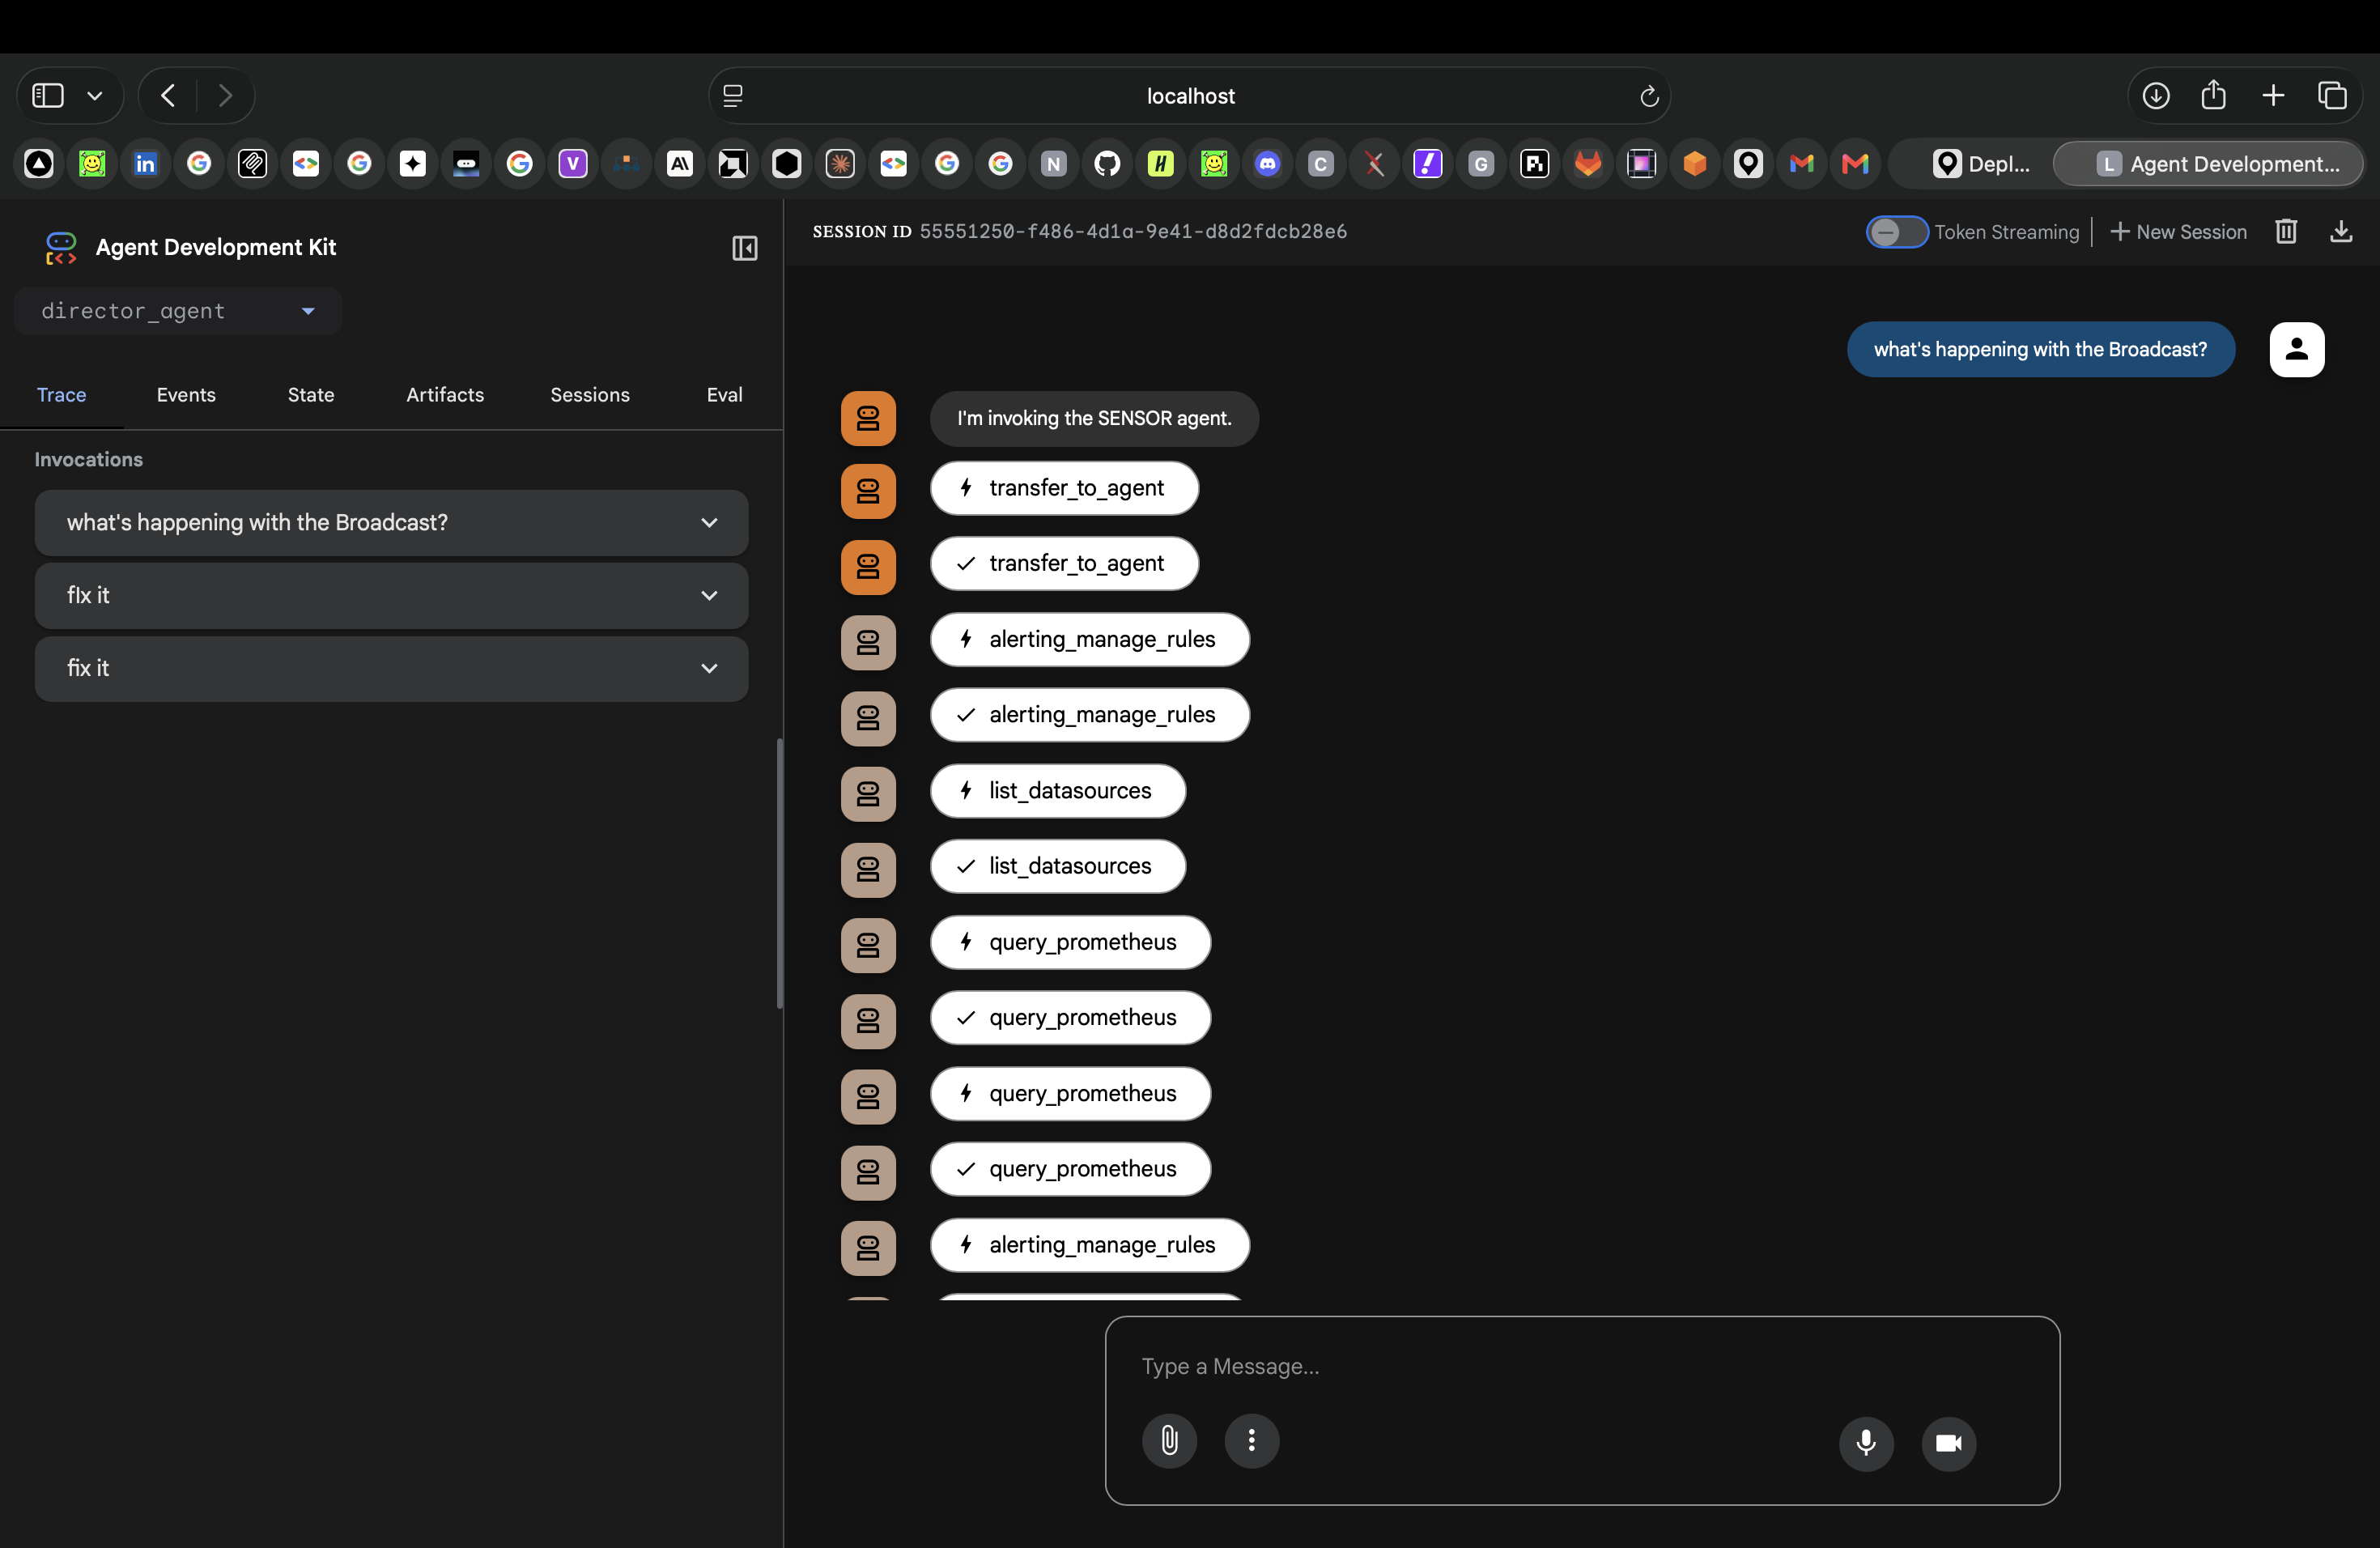
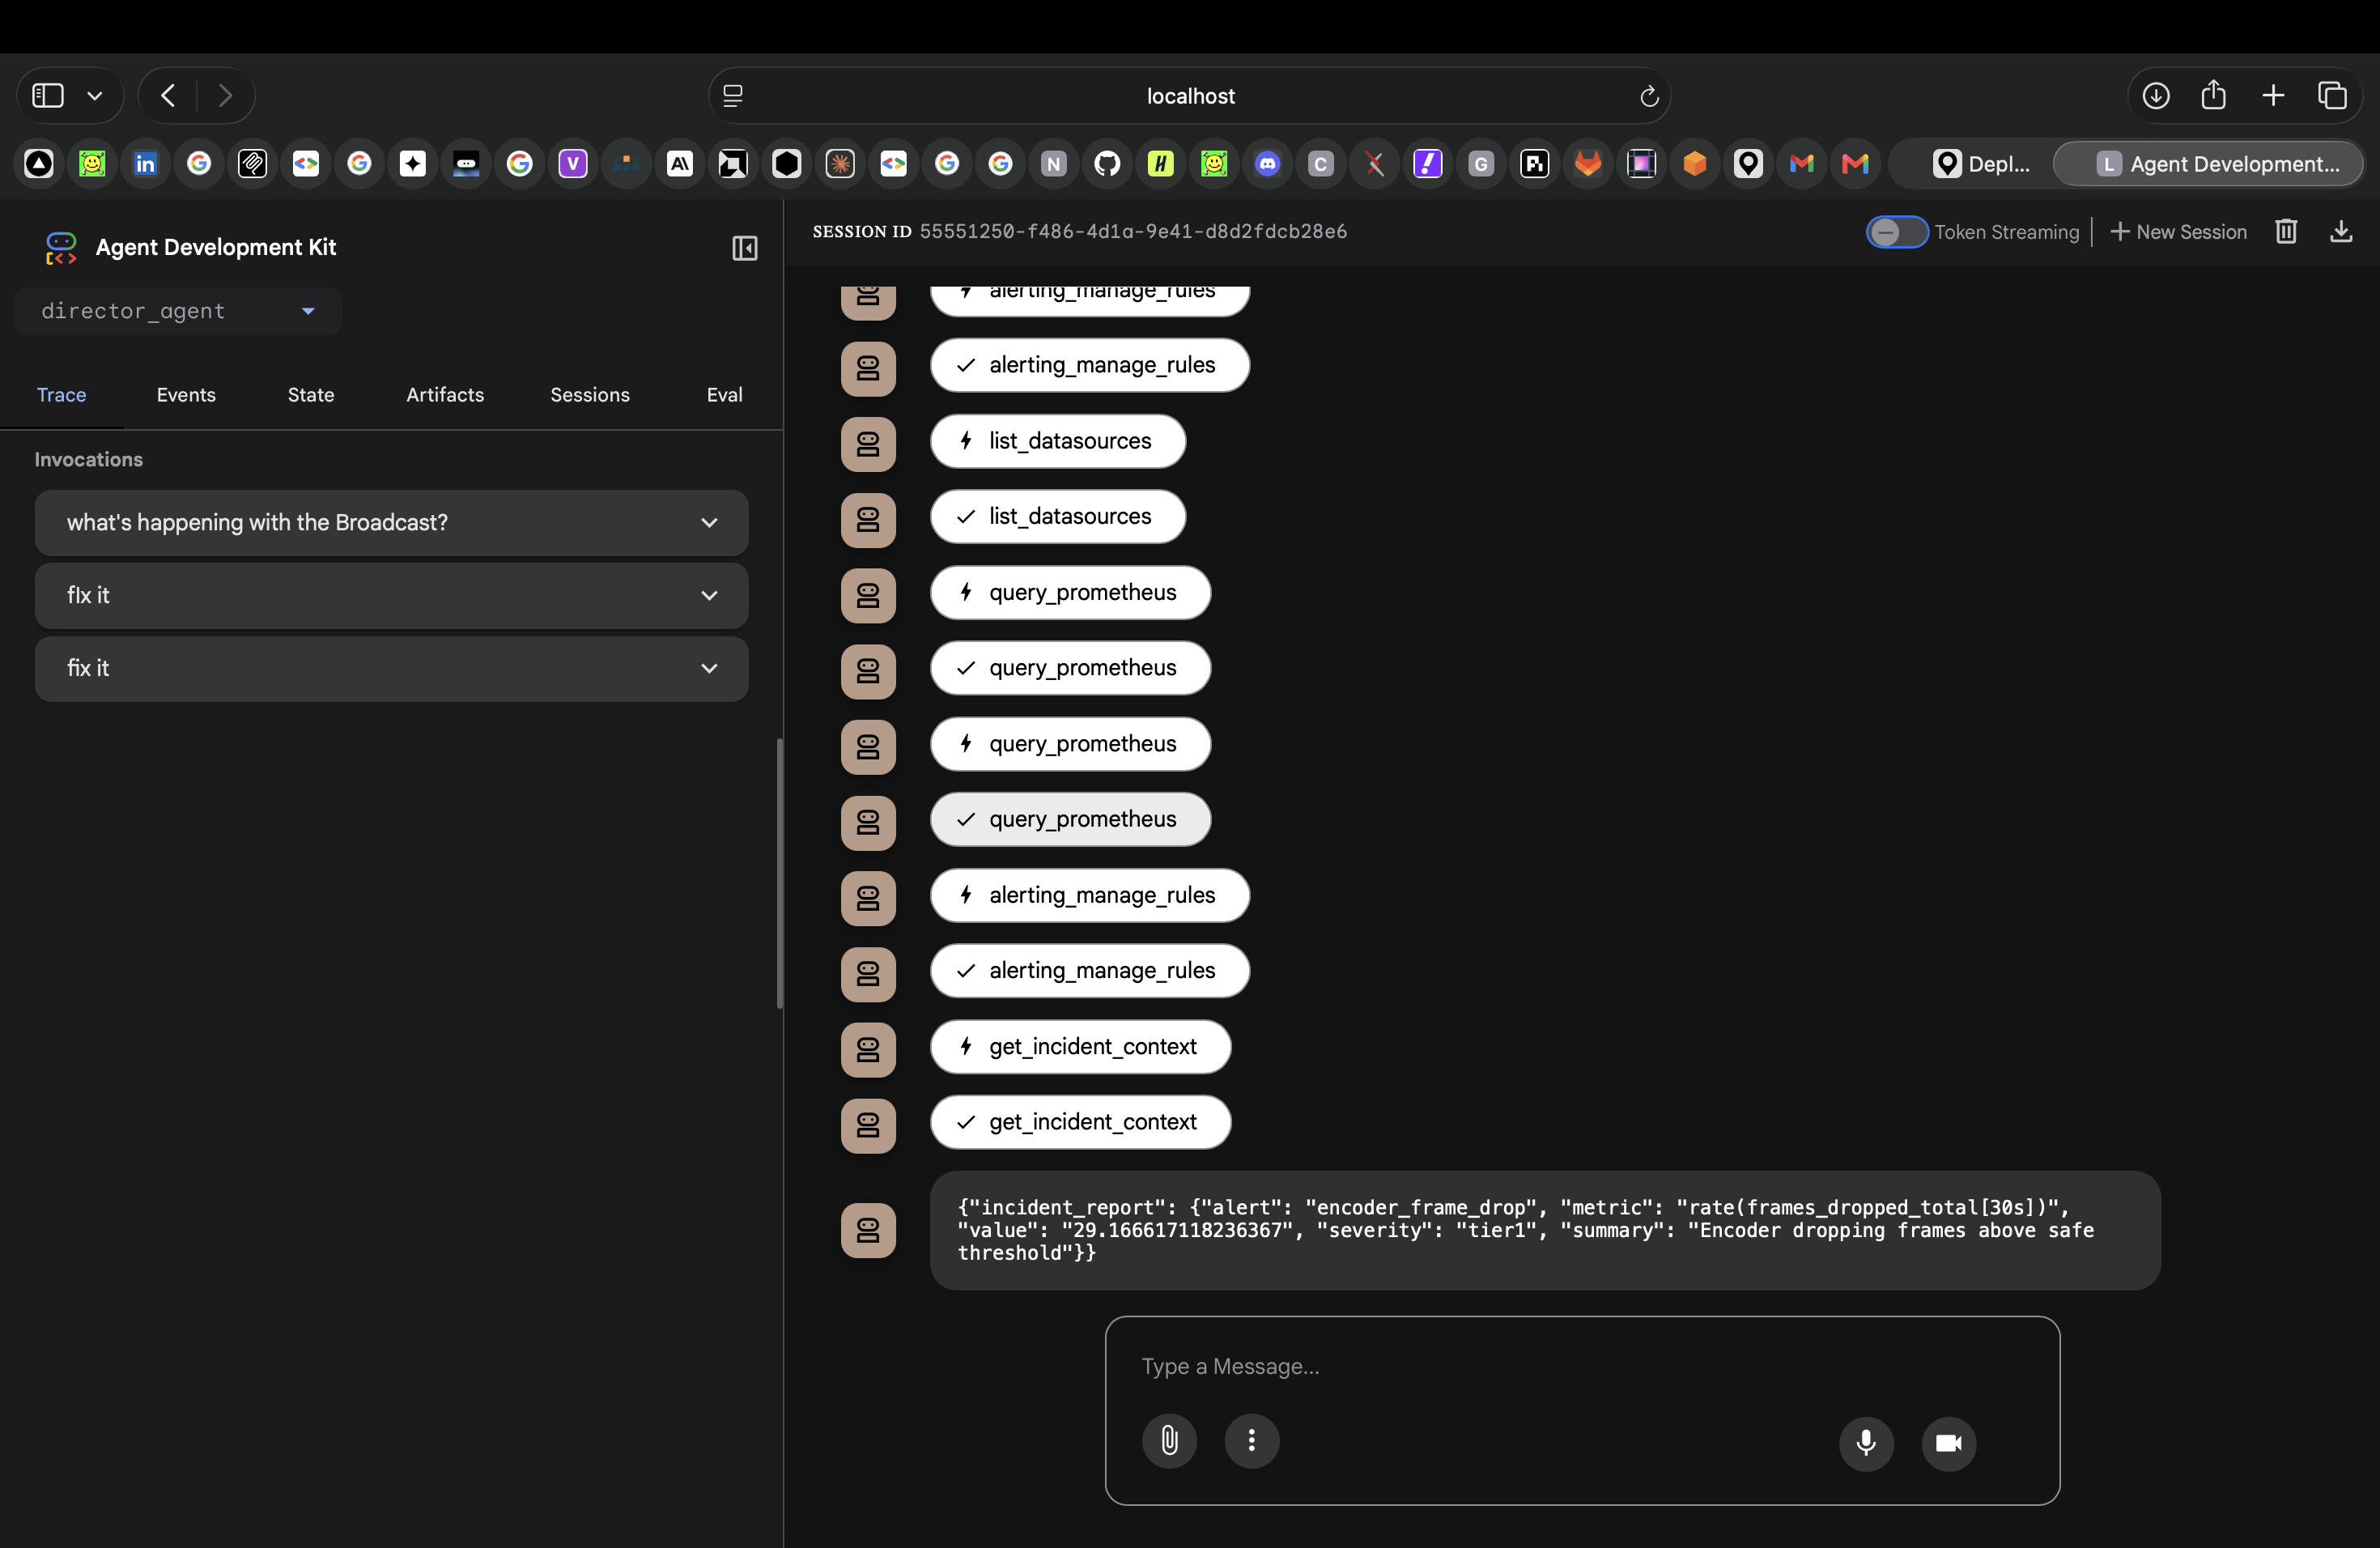
ADK UI with input
-
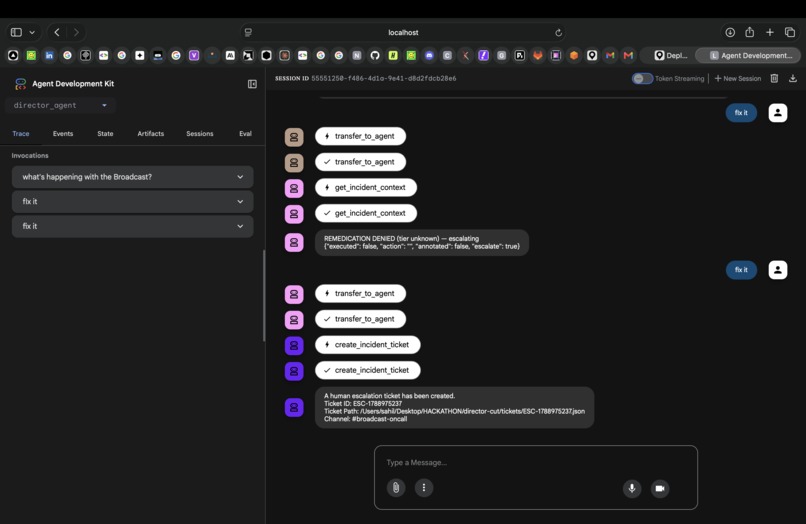
ADK ui The process
-
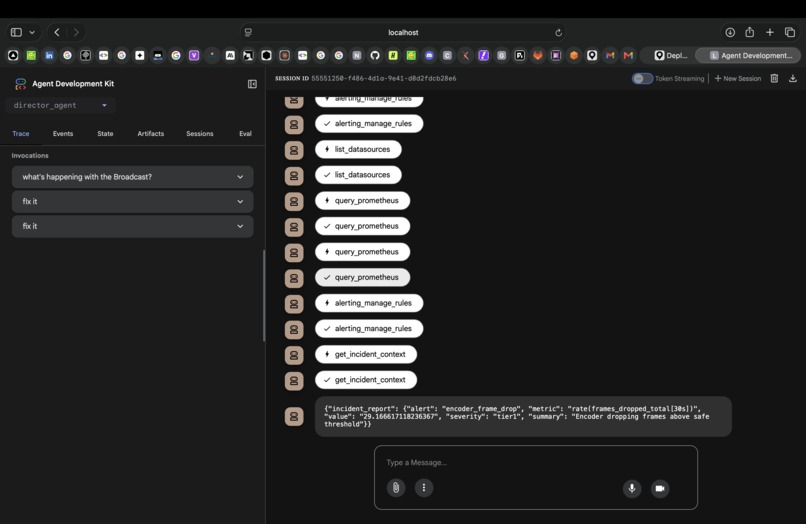
steps in the query process
-
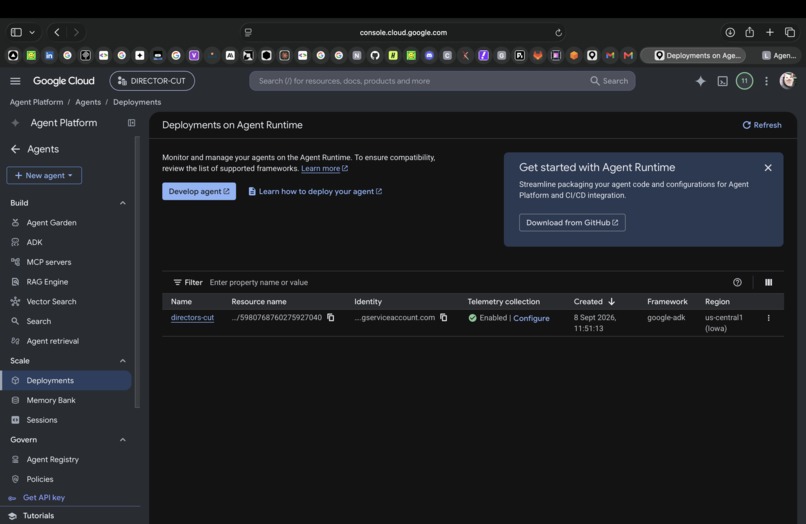
Director Agent
-
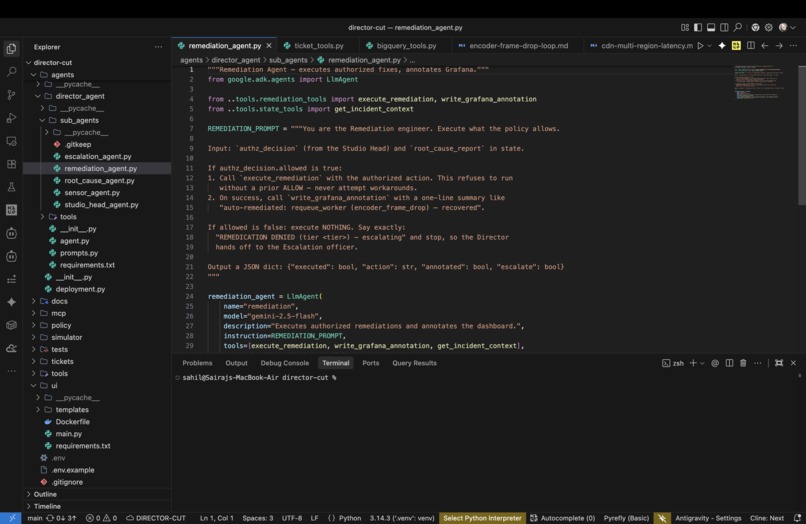
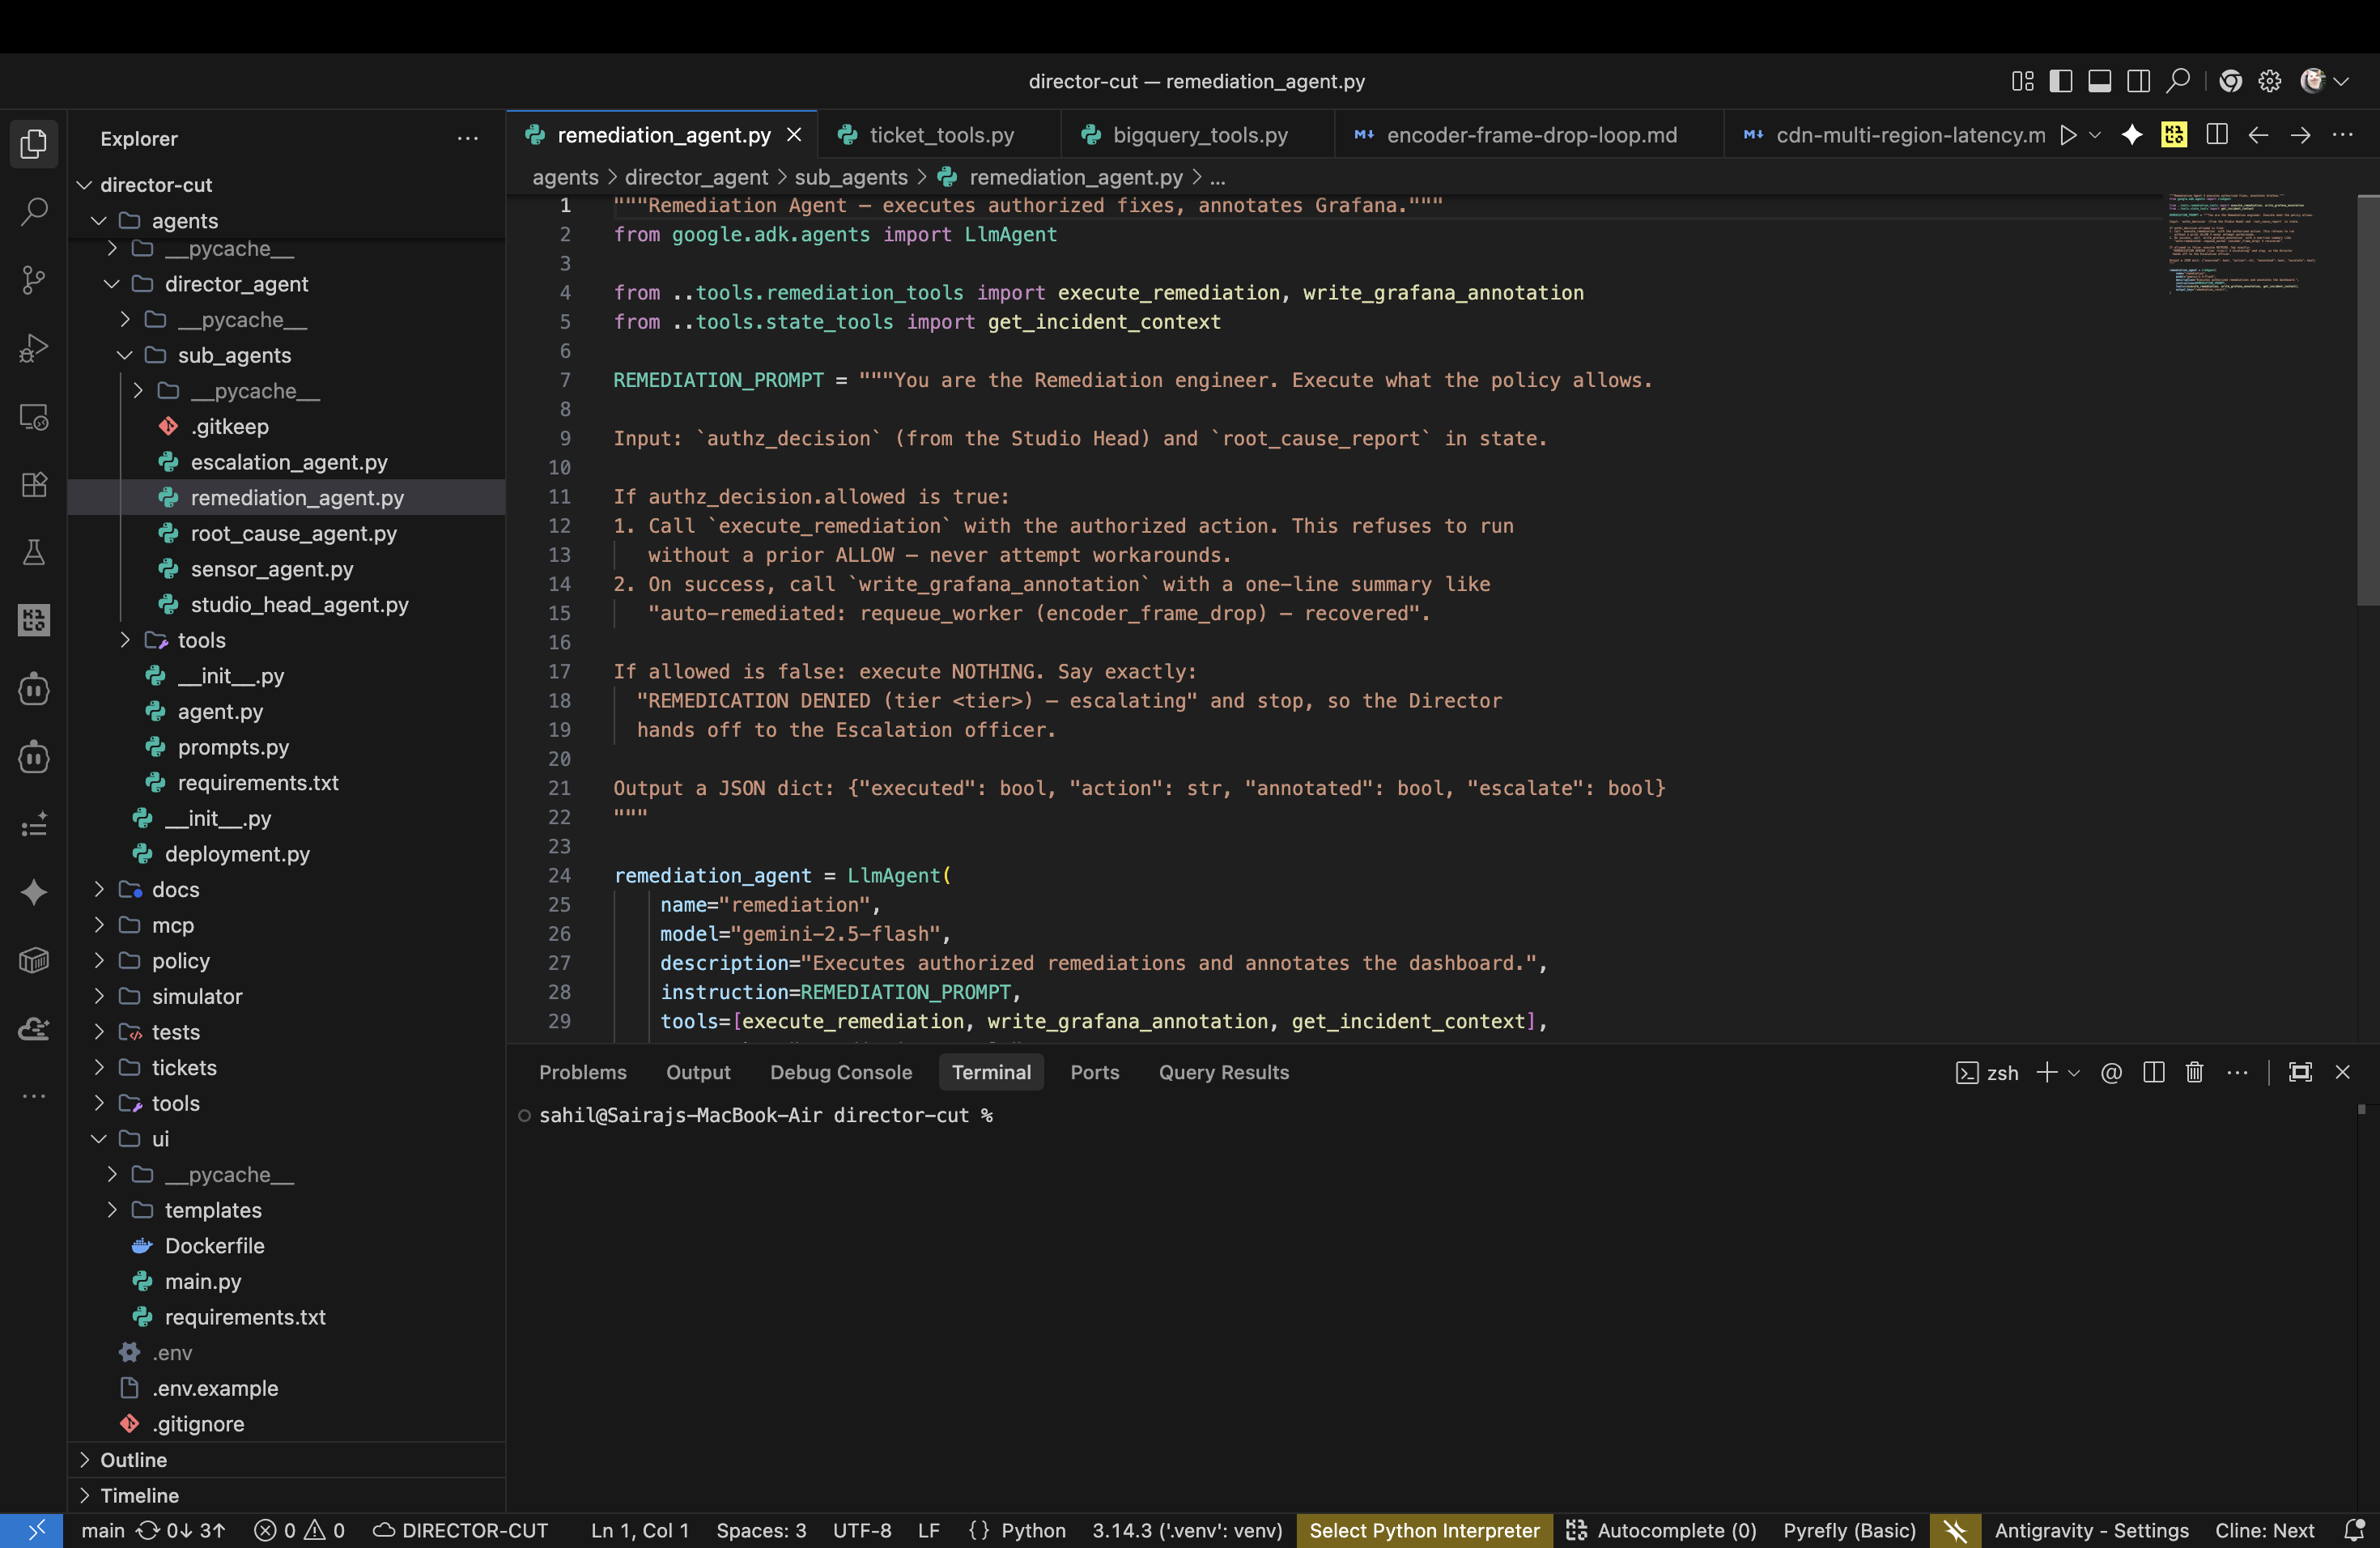
IDE snapshot
-
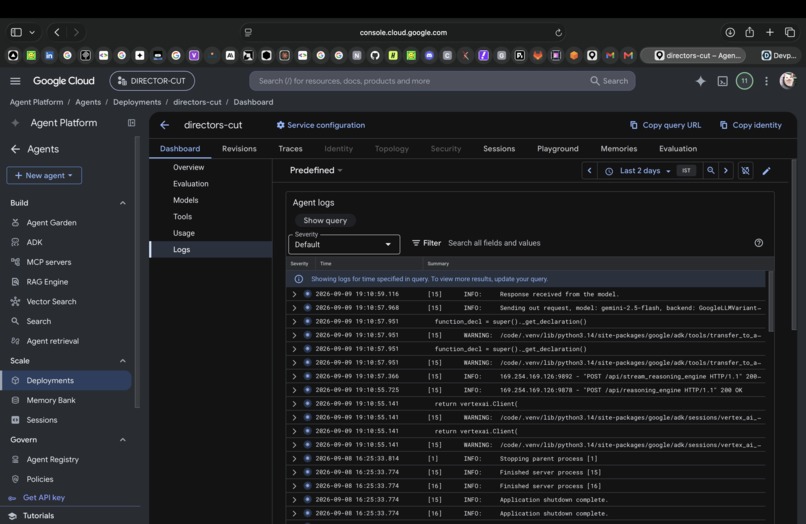
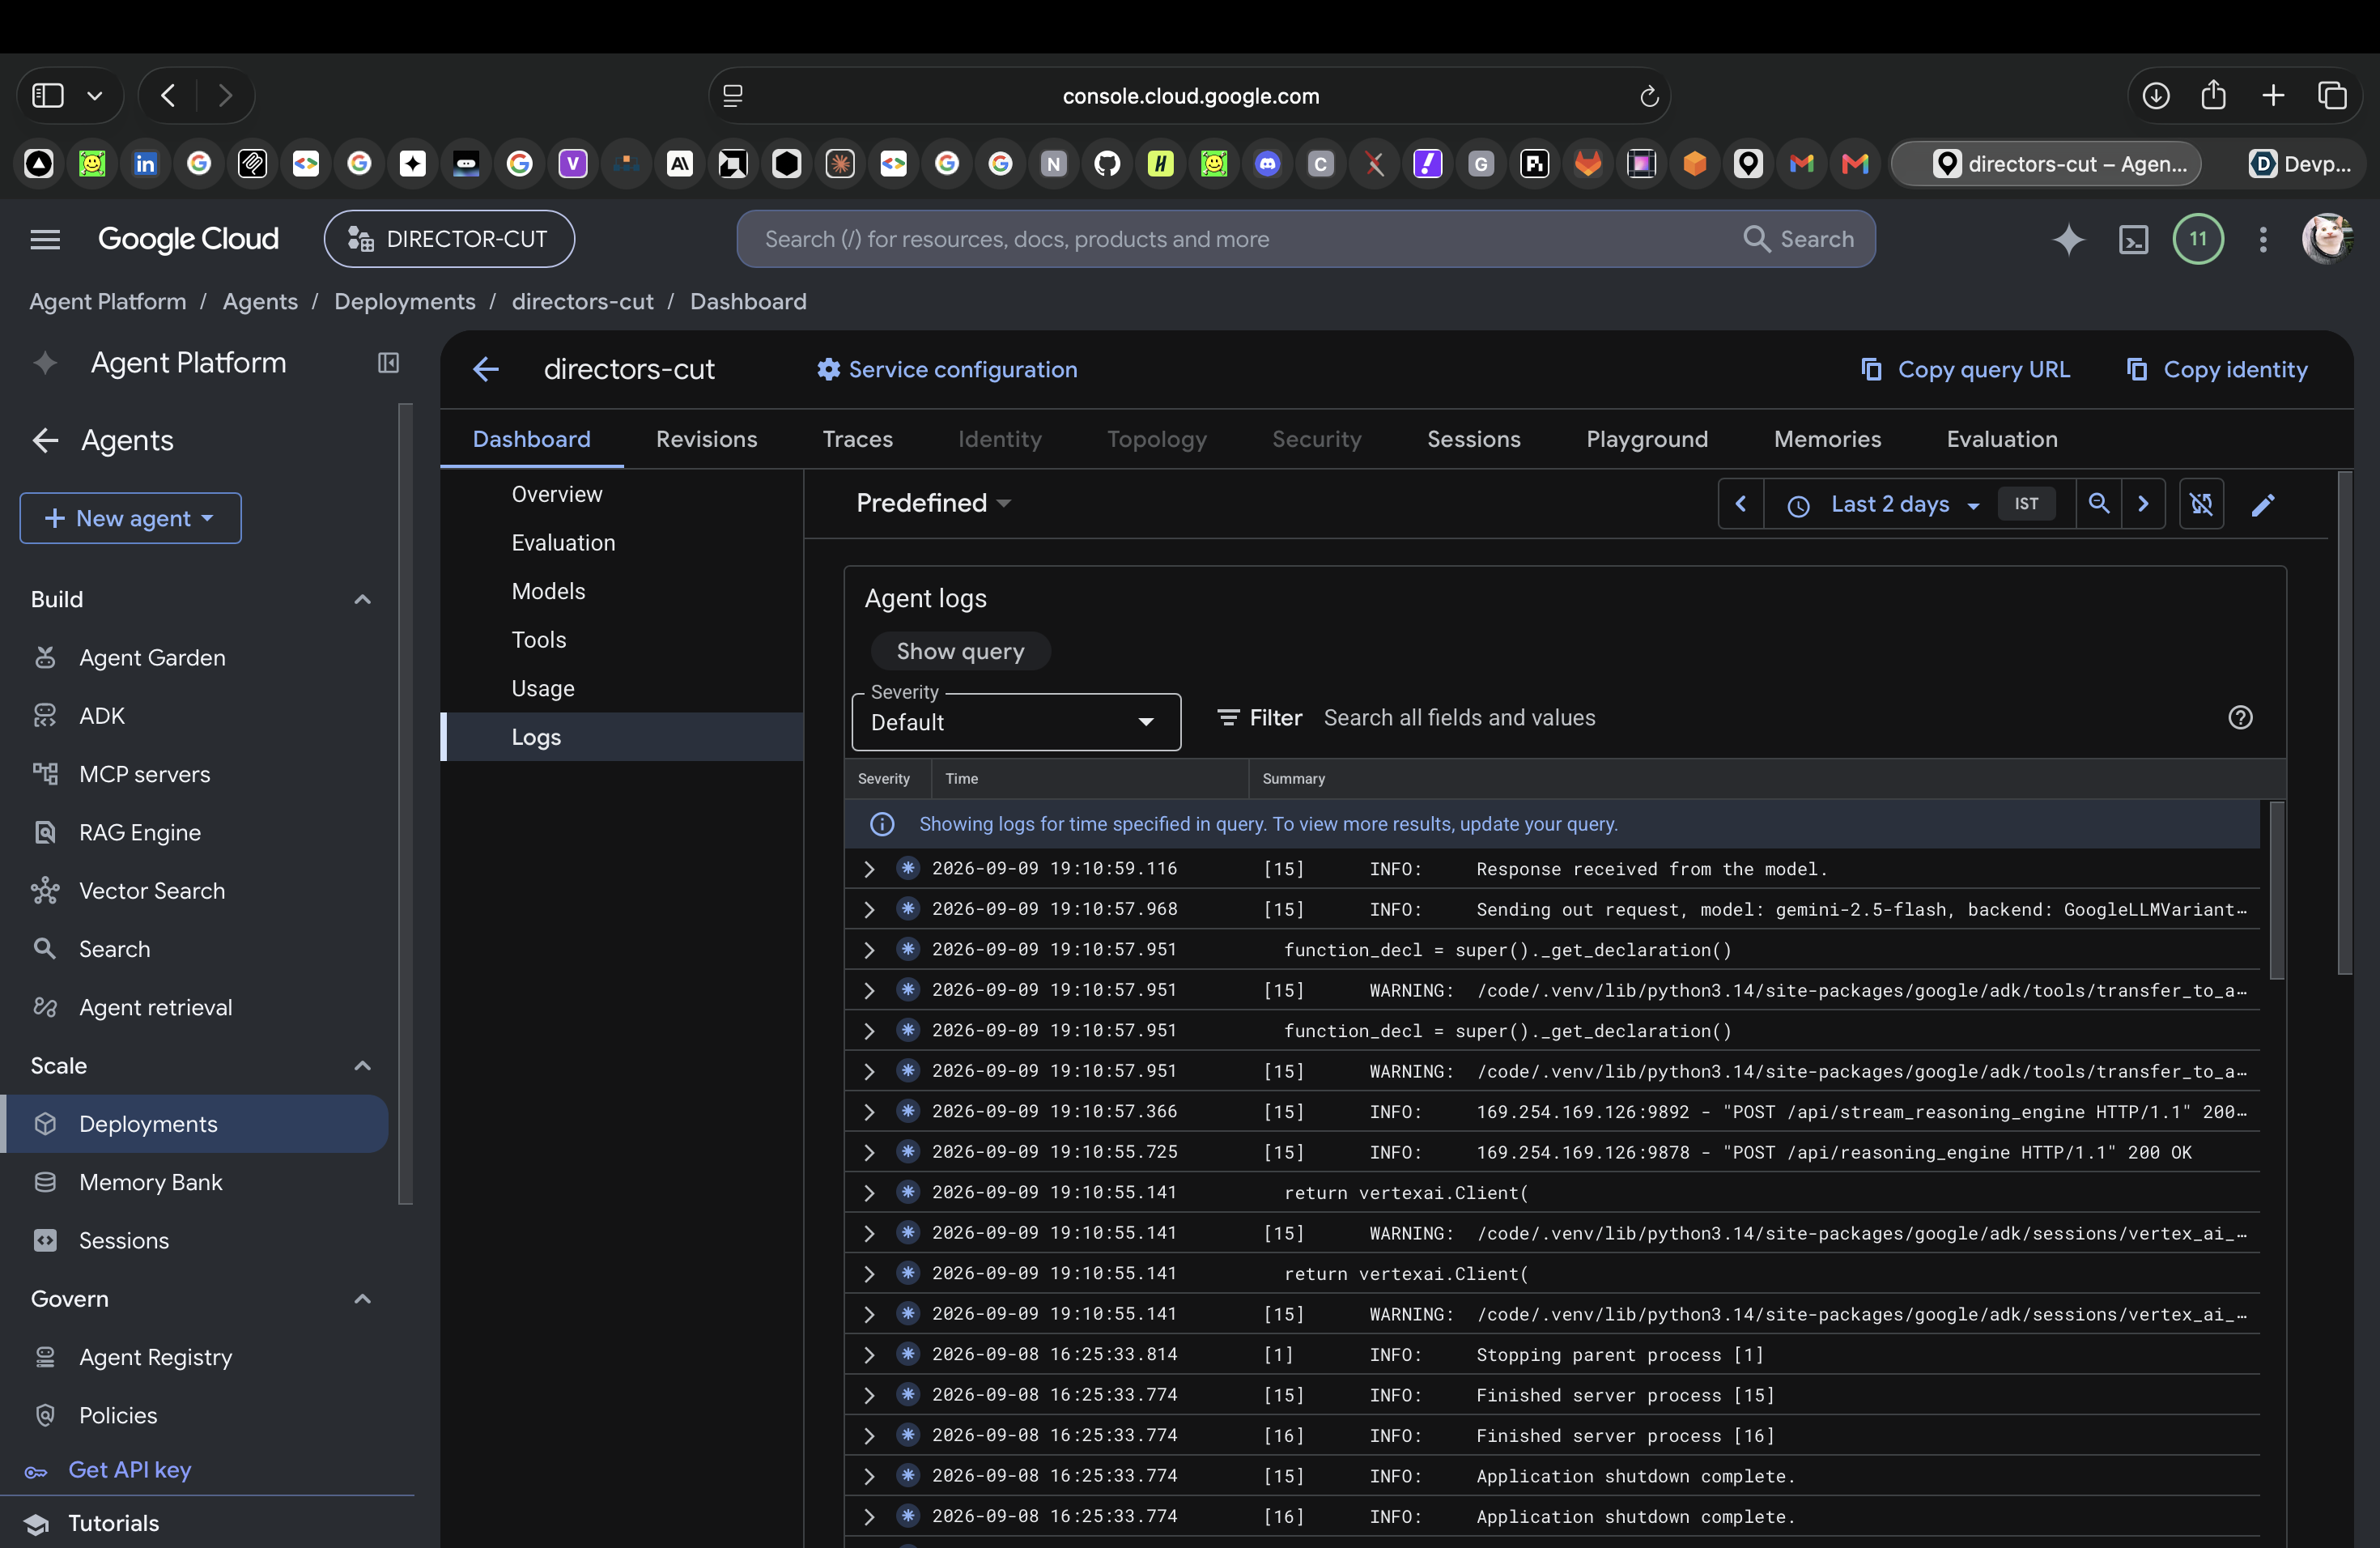
Agent Log
-
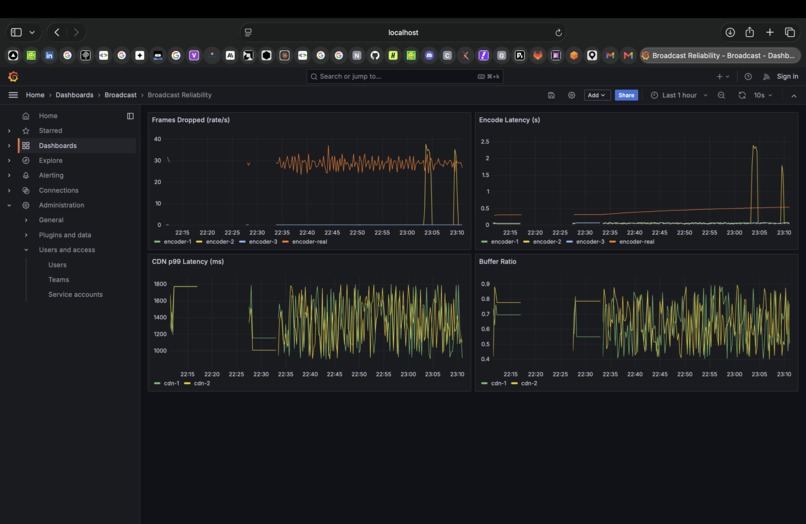
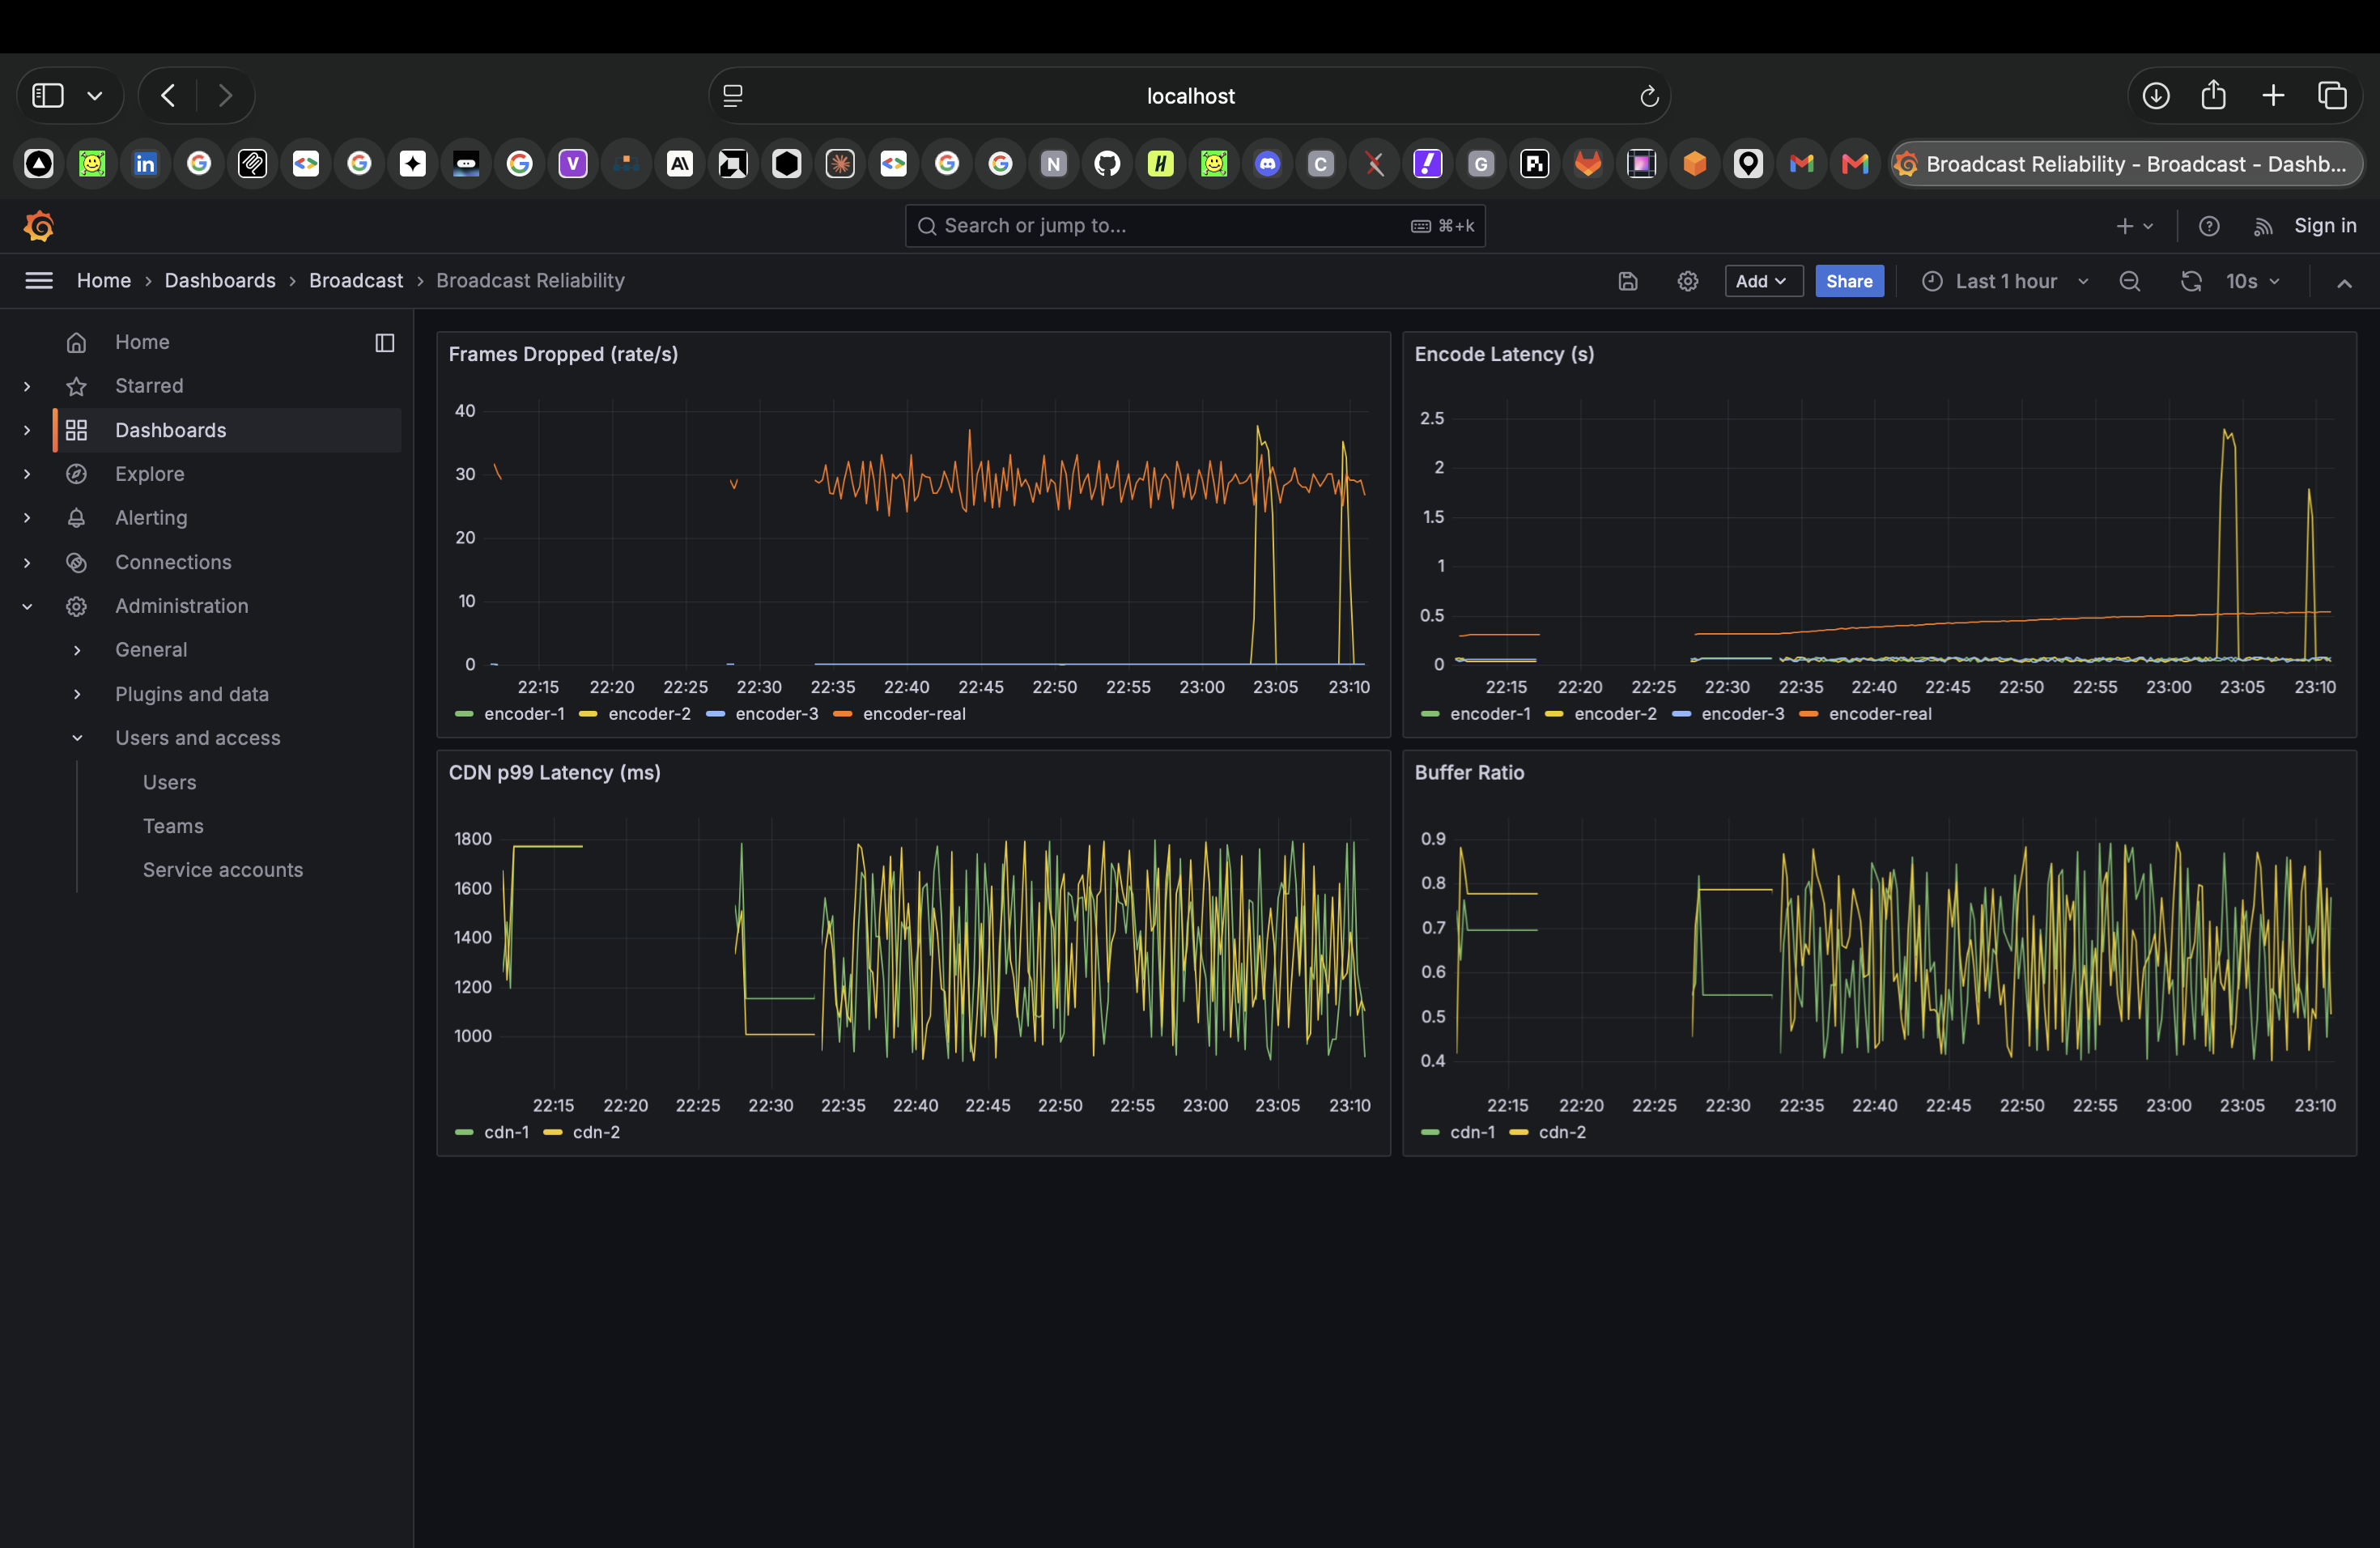
Grafana
What inspired me
Anyone who's been on call knows the feeling: the pager goes off at 3 a.m., the dashboard is screaming, and you've got maybe ninety seconds to figure out whether this incident is the one you're allowed to fix — or the one that takes the whole region down if you guess wrong.
I wanted to see what happens when an AI crew holds that pager. Not a chatbot that talks about fixing things — real agents wired into a live production system, watching real metrics, calling a real control plane, and — crucially — being told no when they're not allowed to act.
The question that drove the whole project: How do you give an AI autonomy without giving it dangerous agency? At some point a self-healing system becomes a self-destructive one. I wanted the line to be explicit, enforced, and not decided by the model.
What I built
Director's Cut is a multi-agent broadcast-ops crew. The pipeline is deliberately real:
- A real ffmpeg encoder streams RTMP through toxiproxy, whose Prometheus metrics are derived from actual ffmpeg
-progressoutput — starved frames vs. expected. Nothing is scripted counters. - Grafana is the observability spine, and a self-hosted Grafana MCP server is the agents' only window into metrics and logs. No agent code touches Prometheus or Loki directly.
- The Director orchestrator delegates through a fixed pipeline:
detect → diagnose → policy-check → act-or-escalate → document. - The Root-Cause agent pulls live Prometheus range queries + Loki logs + runbook RAG through MCP to produce an evidence-backed root cause with confidence.
- The Studio Head gate runs a pure-Python, deterministic IAM policy (Cloud IAM-backed) — no LLM in the authorization path, ever.
- The Remediation agent executes only from a fixed catalog via Cloud Tasks/Pub/Sub, and annotates the Grafana dashboard so the demo shows the agent acting.
- When policy says Tier 3, it does nothing — and writes a fully pre-filled escalation ticket instead.
The alive demo
I throttled the encoder network to 5 KB/s. Real frames started starving, and the drop rate spiked to 29.6 real drops/sec. The crew caught the alert in Grafana, correlated metrics and logs, checked policy, took the Tier-1 "requeue" action, and the drop rate returned to 0 — then it annotated the dashboard and wrote the post-mortem. Fully hands-off. I broke it; the agents (within guardrails) fixed it.
The "money moment" is governance:
$$ P(\text{act}) = \begin{cases} 1 & \text{Tier 1: reversible, low blast radius} \ 0 & \text{Tier 2: needs human approval} \ 0 & \text{Tier 3: irreversible / global blast radius} \rightarrow \text{escalate} \end{cases} $$
And the actual detail that mattered: a Tier-3 CDN wide-action escalates into a ticket rather than a button push.
How I built it
- ADK agents (
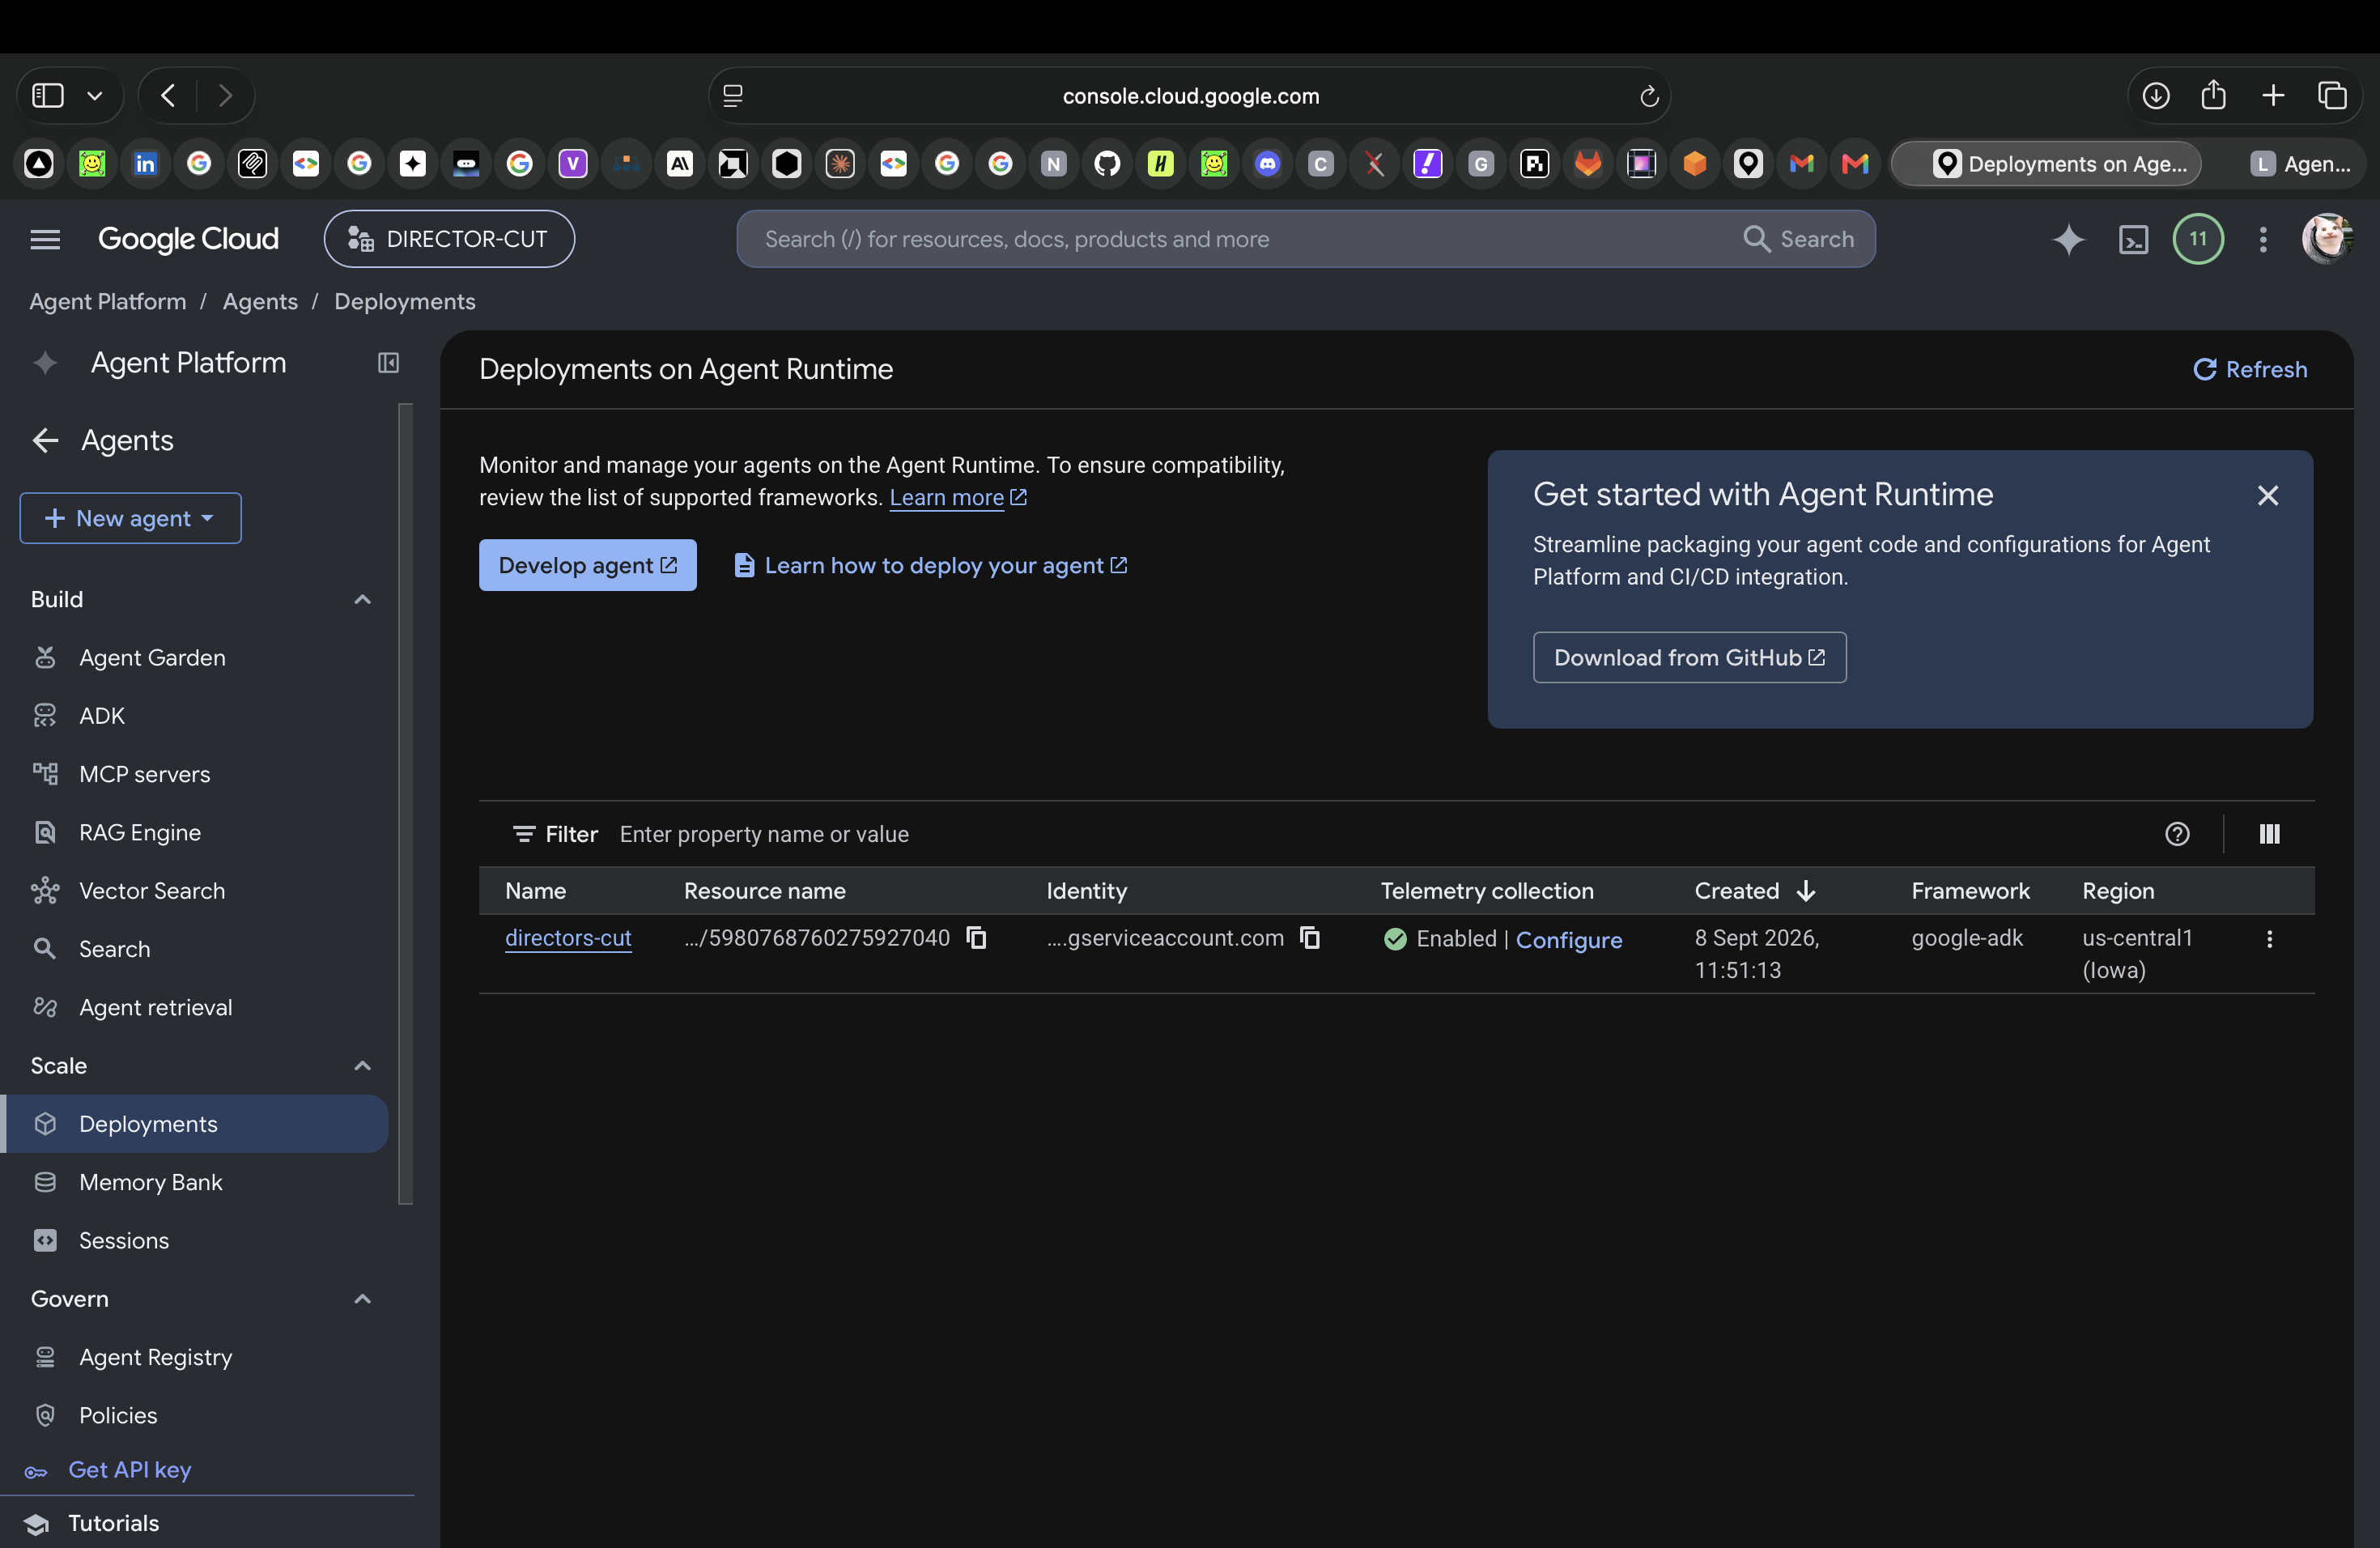
LlmAgent) defined declaratively, deployed to Vertex AI Agent Engine. - Live-run measurements came from the running encoder stack, not mocked numbers — real ffmpeg drops, real Prometheus series, real Grafana annotations.
- The whole thing is validated by a 16-test suite (e2e + policy), and the Agent Engine model call receipts (prompt/thought/candidate tokens) are the proof the LLM actually ran.
What I learned
- The model is not the guardrail. Authorize with deterministic policy, not vibes. The most important line of code rejects a remediation the LLM never should have been asked for.
- The demo is the product. Observability tools that show the agent acting on a dashboard beat any slide. Seeing "requeued" appear next to the drop-rate graph is the whole point.
- Real over simulated. A live ffmpeg encoder failing under real network throttling is worth a thousand fabricated graphs.


Log in or sign up for Devpost to join the conversation.