-
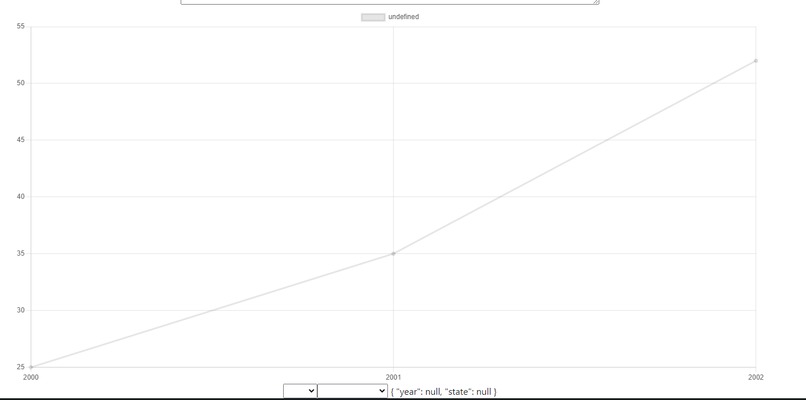
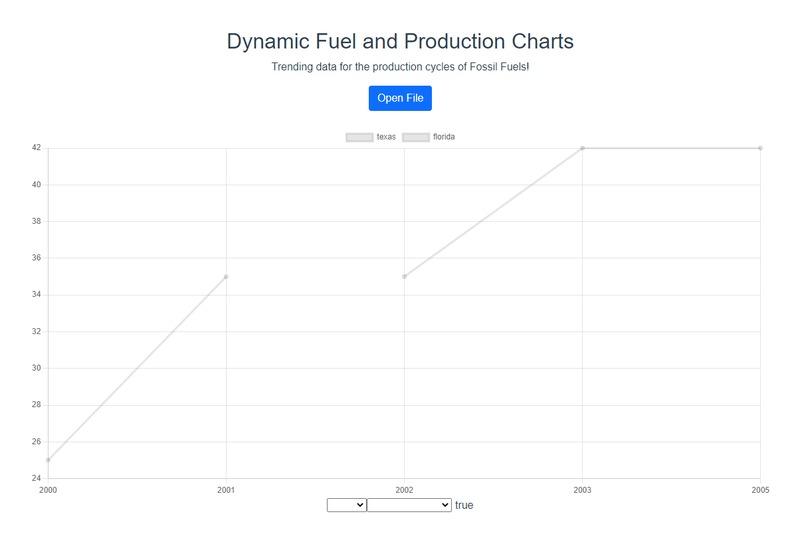
sample graph from early on
-
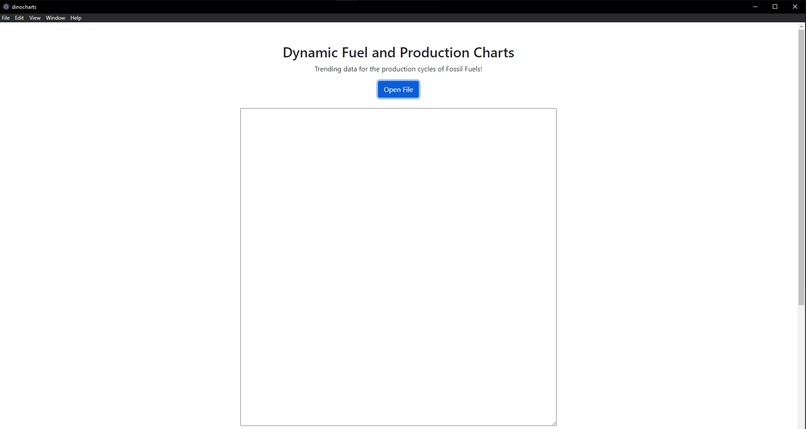
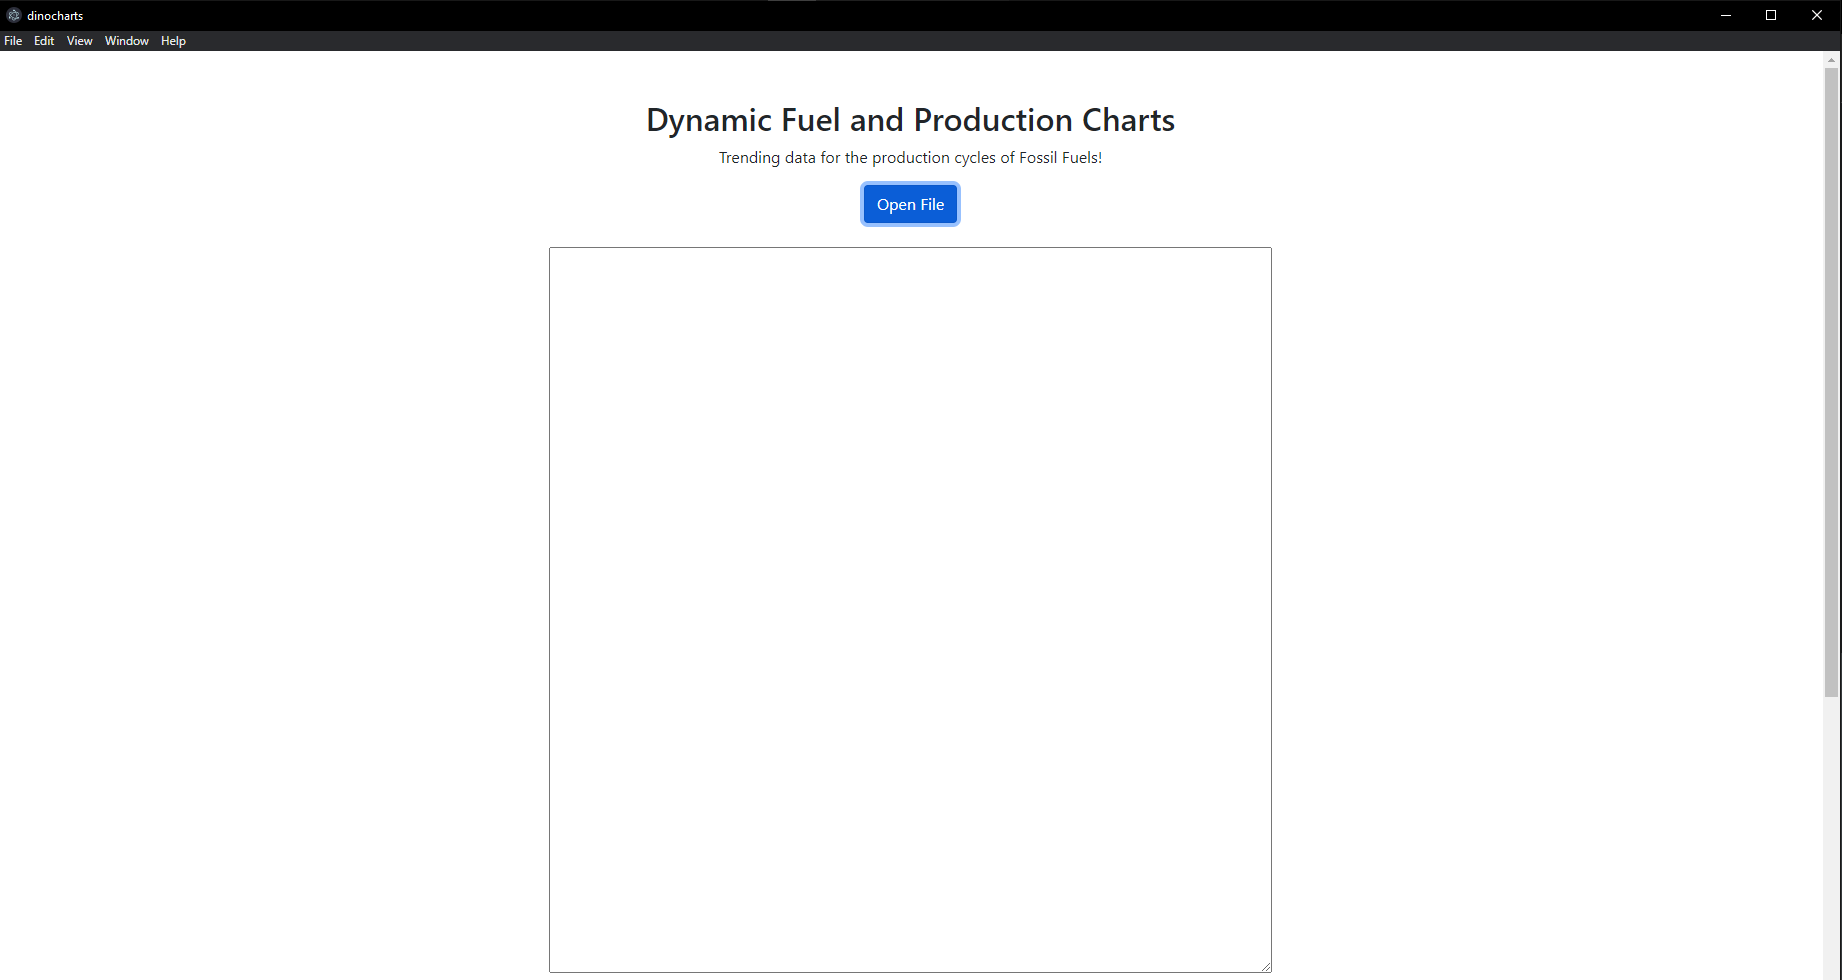
home view
-
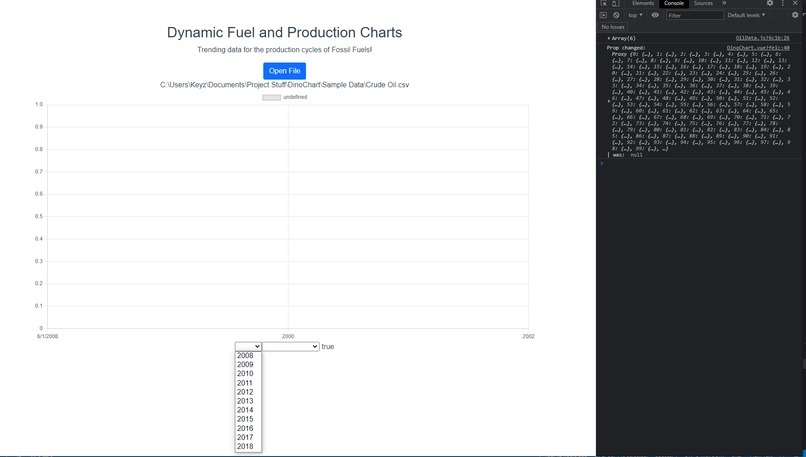
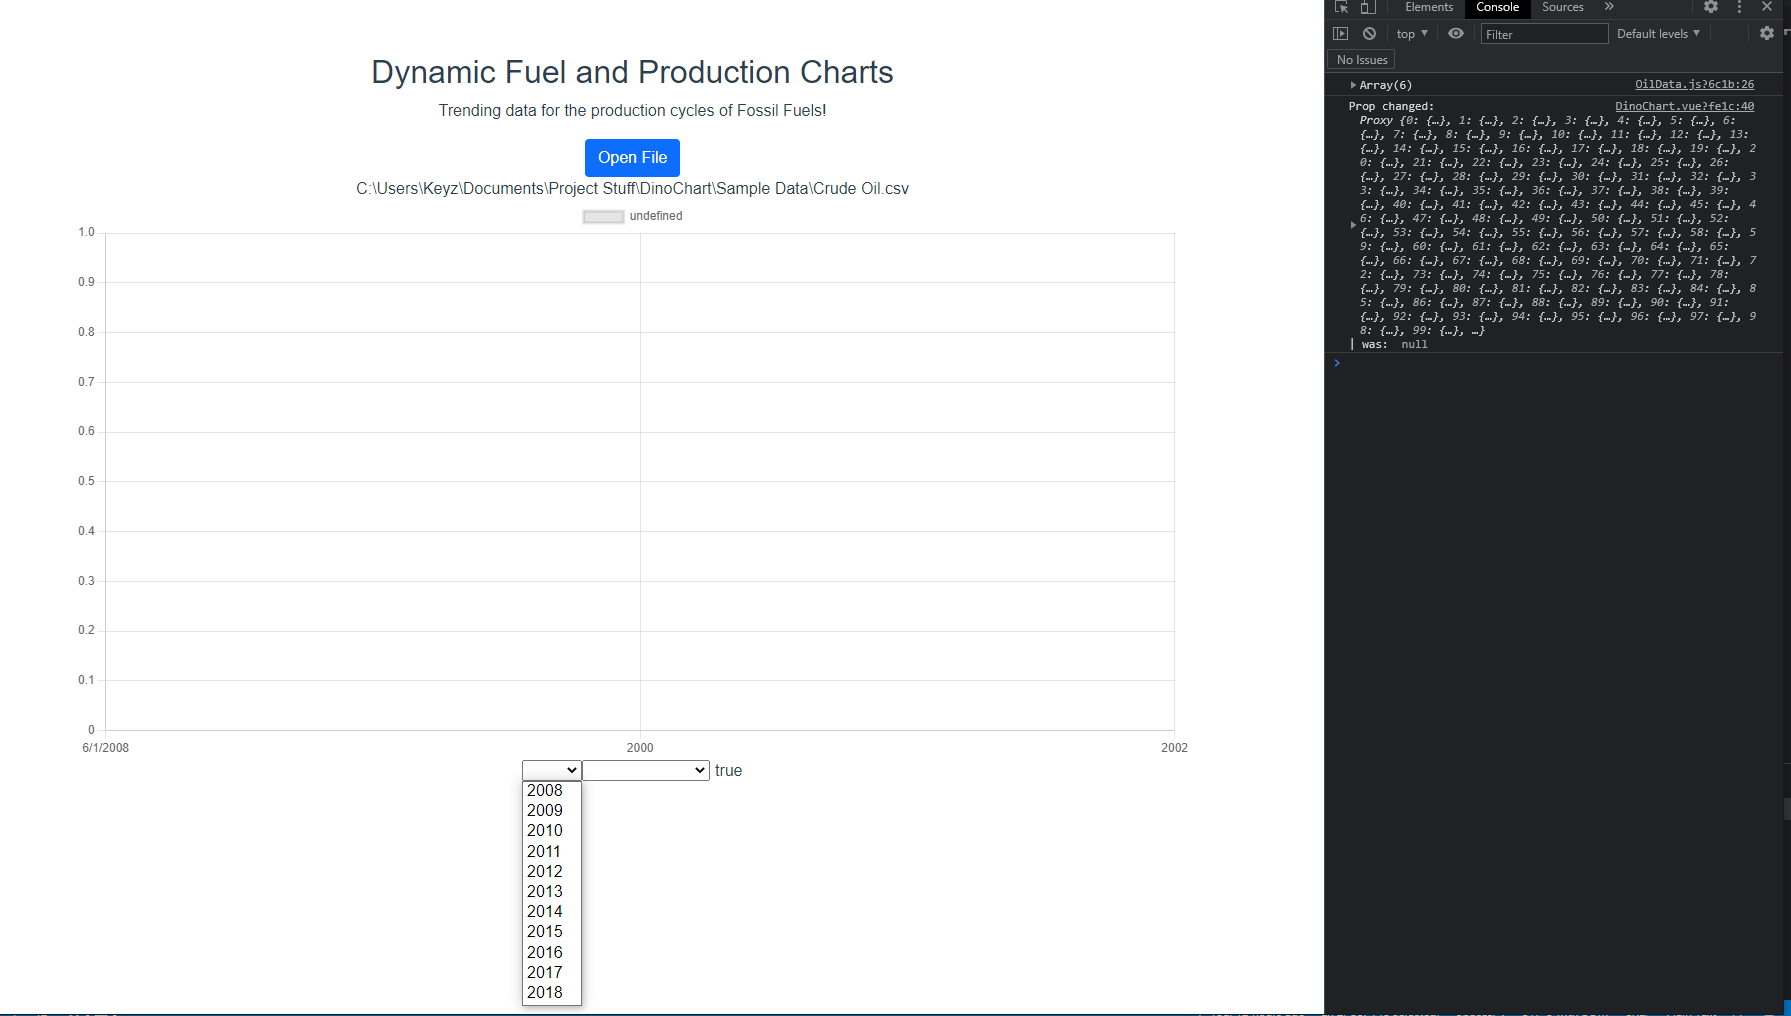
dev tools and dropdowns
-
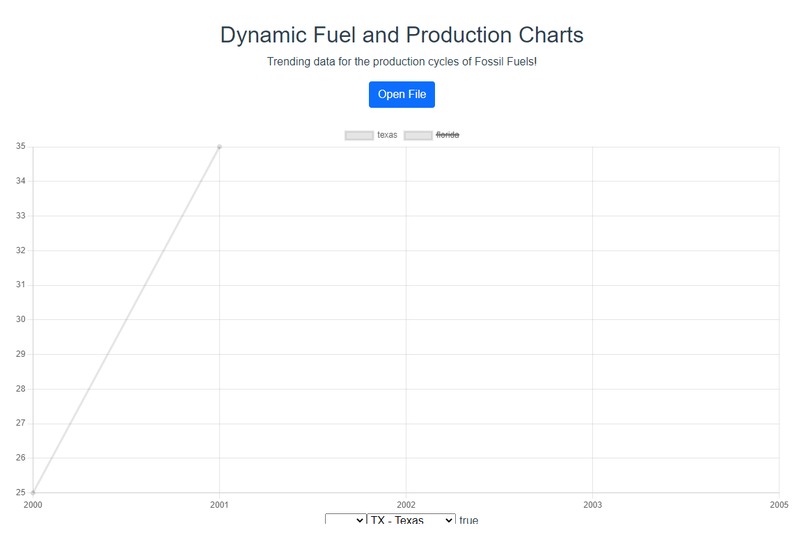
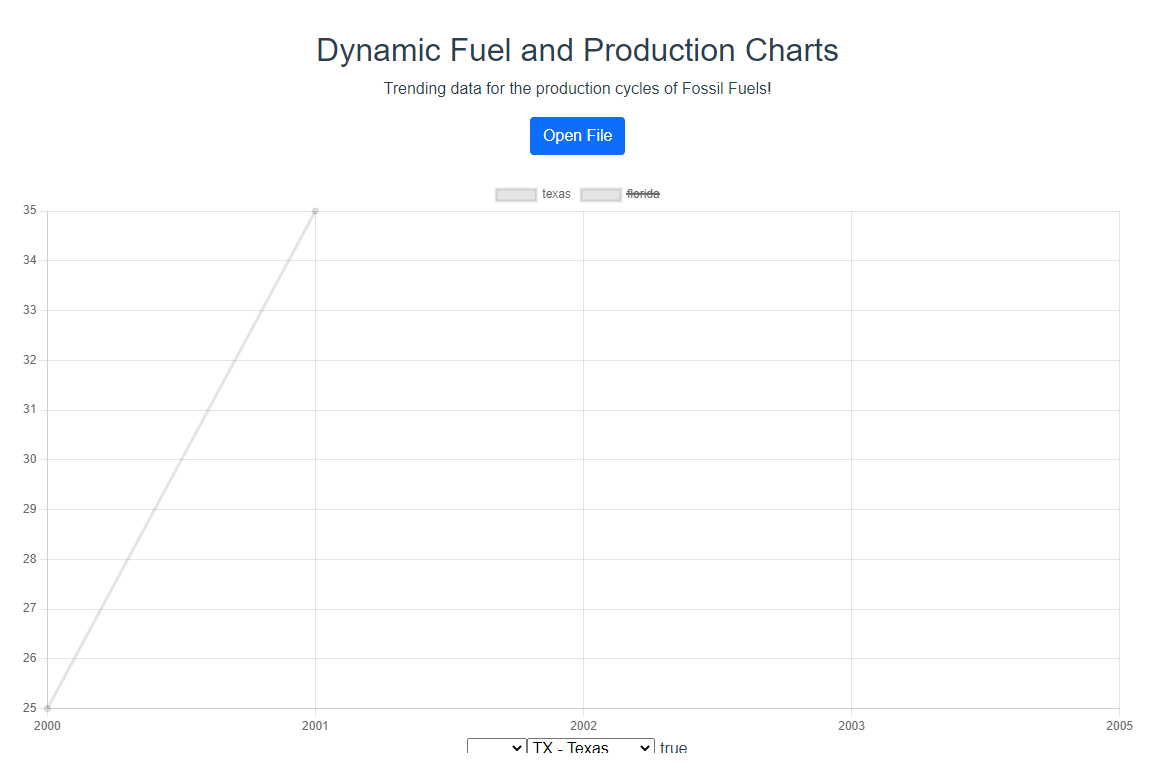
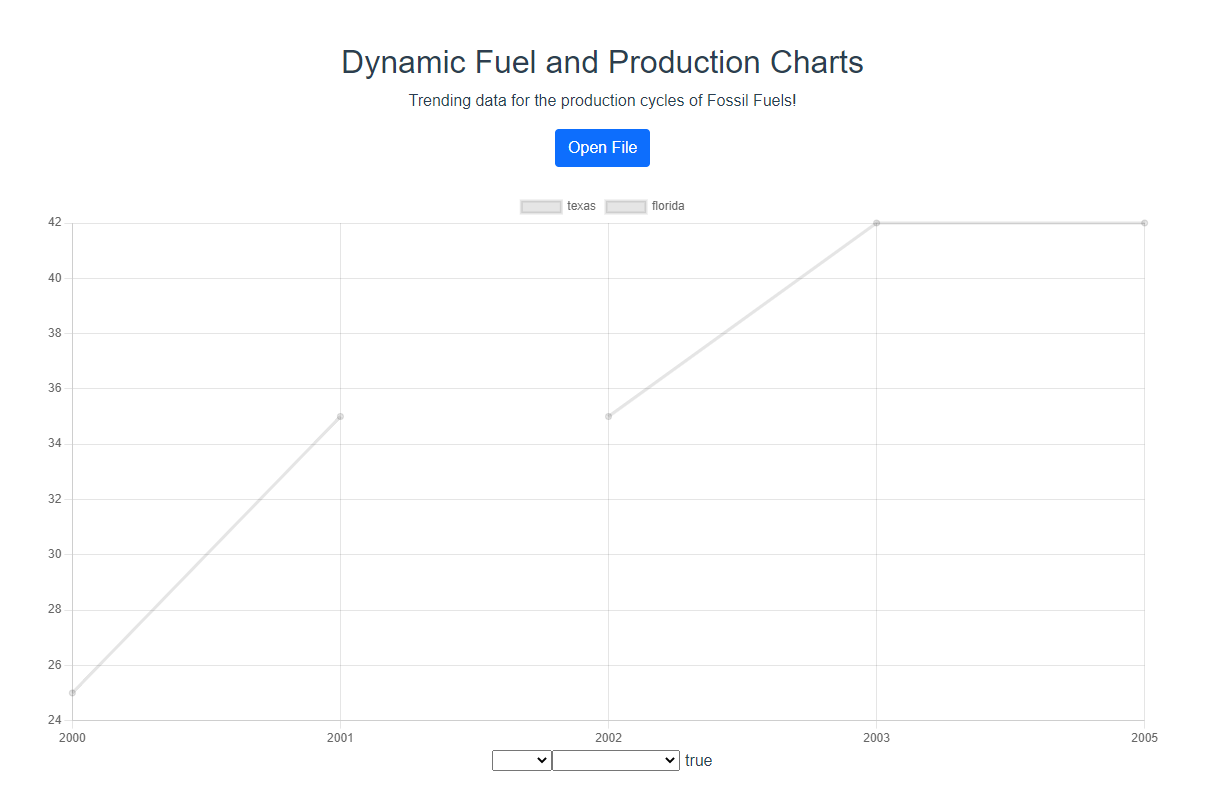
filtering out florida and showcasing texas 2000-2001
-
showcasing two states at the same time with different time periods

Inspiration
We wanted to write a charting system that would make it easy to analyze spreadsheets and see meaningful data in an easy-to-understand way.
What it does
Loads a spreadsheet in .csv format and loads it into the graph section lower on the page.
How we built it
We built it with JS. Specifically, we utilized Vue and Electron so it functions on the web as well as a standalone application for your desktop
Challenges we ran into
Chart.js utilization can get really granular and loading CSVs into electron proved quite a challenge at first leaving us scratching our heads for a reasonable amount of time.
Accomplishments that we're proud of
We're proud of being able to say we developed a desktop application with Electron. It was a good learning experience and a good way to work with files.
What we learned
We learned new frameworks like Chart.js as well as how to use Electron.
What's next for DinoChart
I believe polishing it up and making an actual good deliverable would be what's up next for this project. We didn't get all the progress we wanted in the timeframe so that would be the priority.
Built With
- csv
- electron
- javascript
- vue

Log in or sign up for Devpost to join the conversation.