-
-

Introduction to tell the visitor what the page is about
-

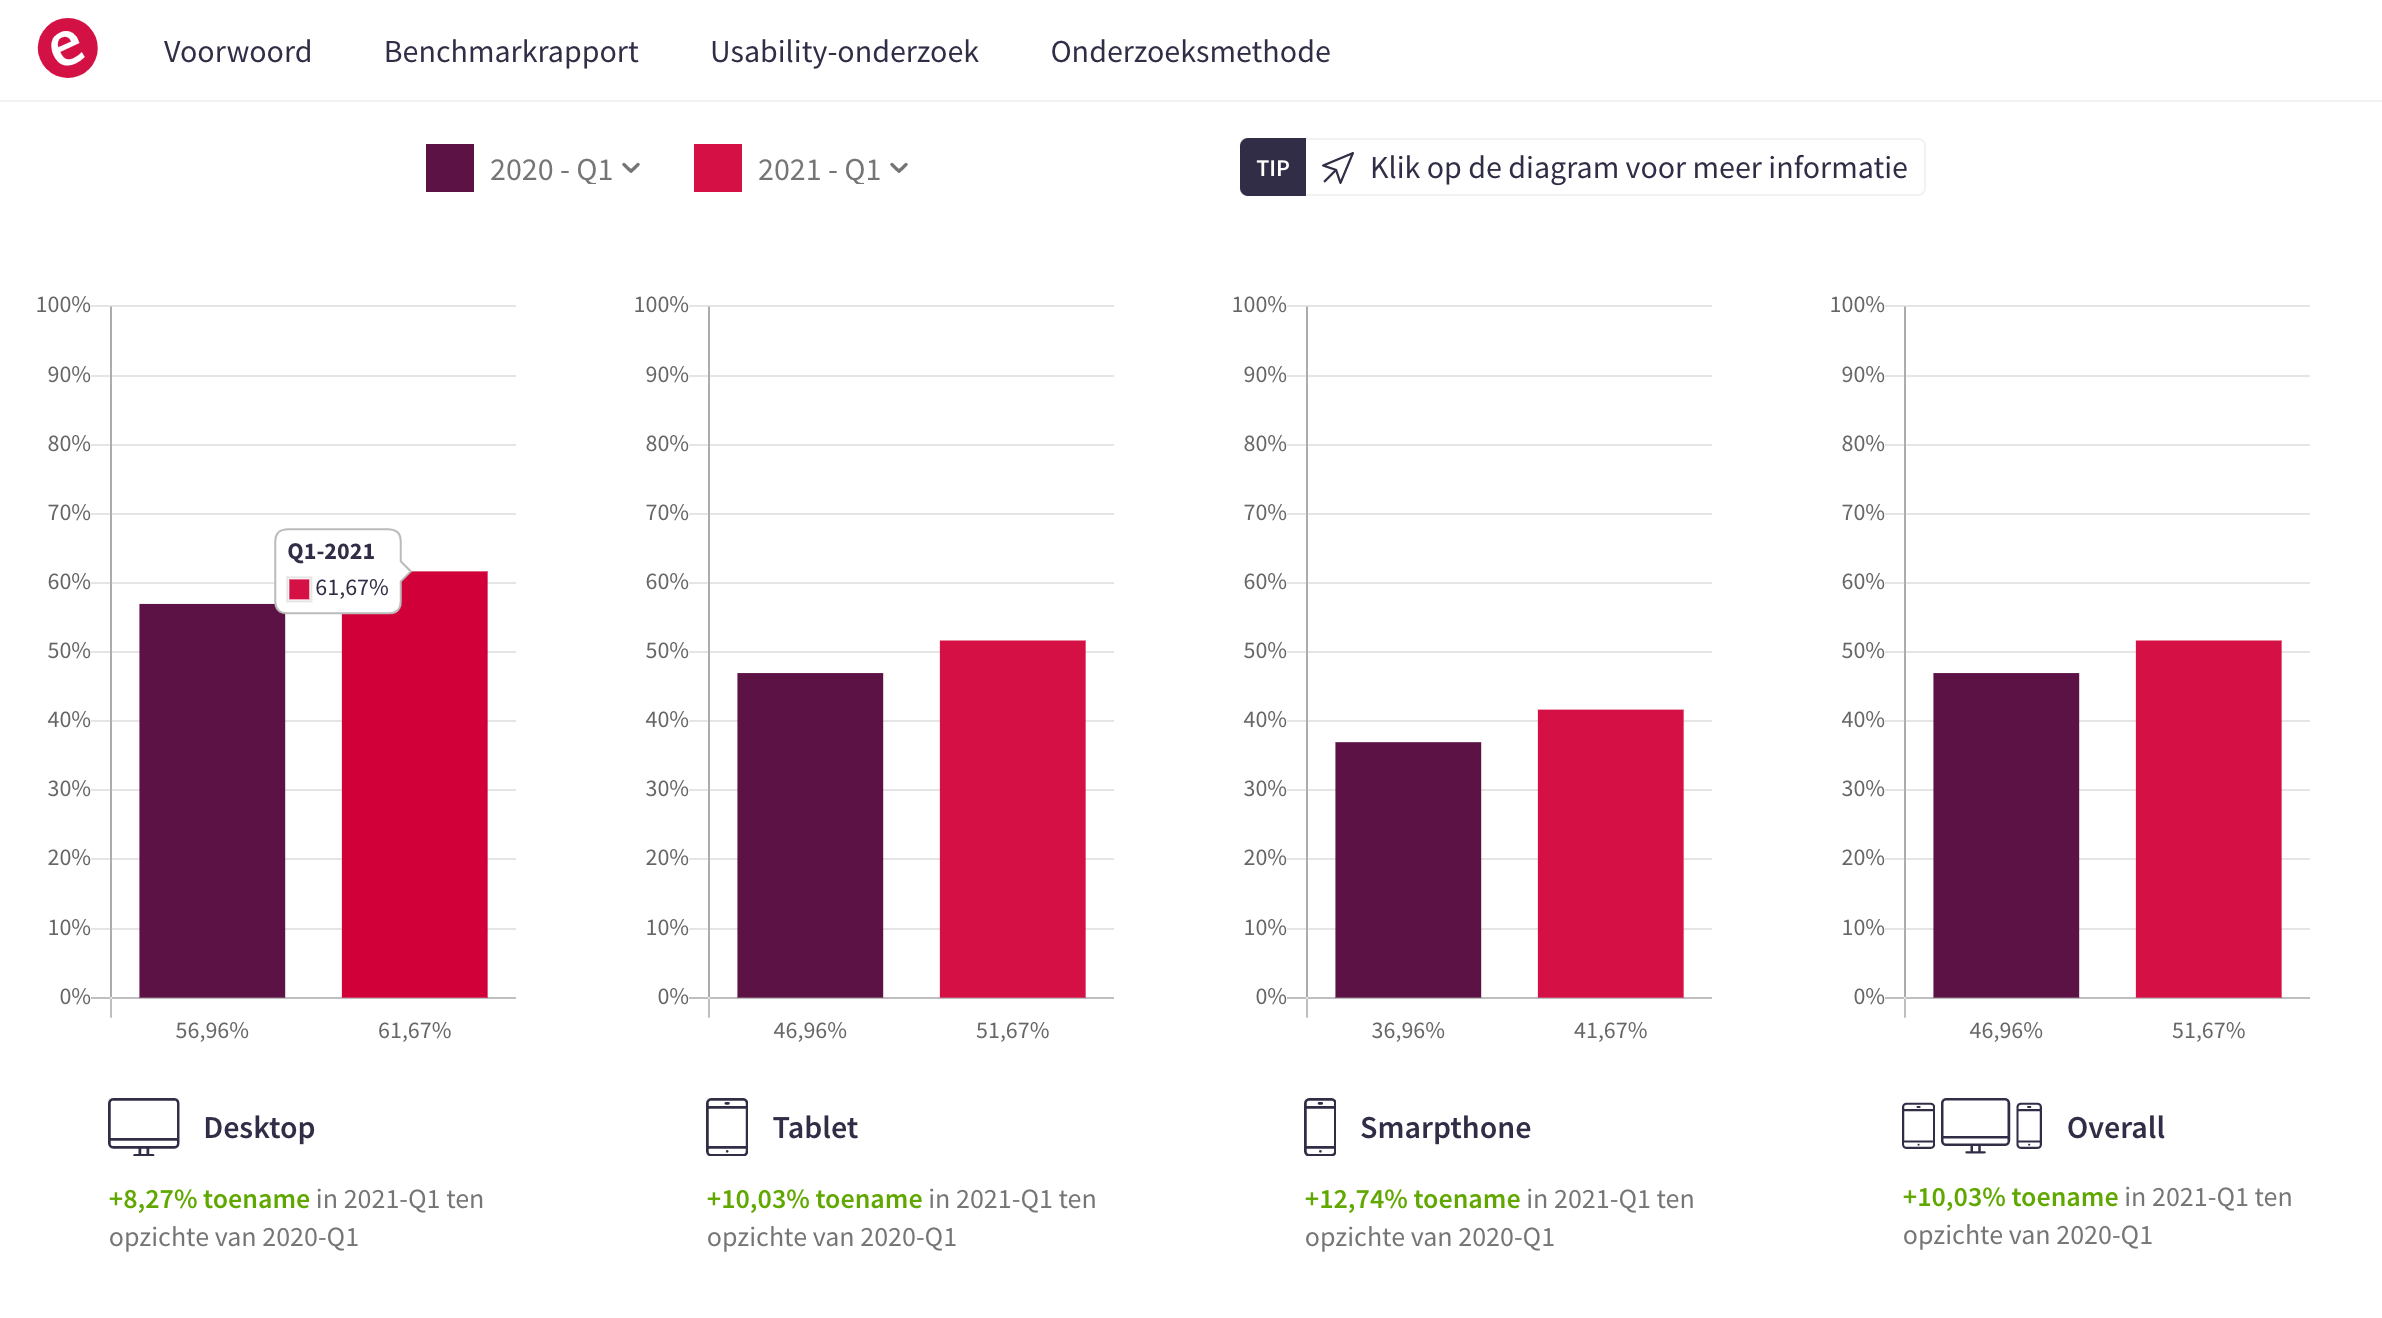
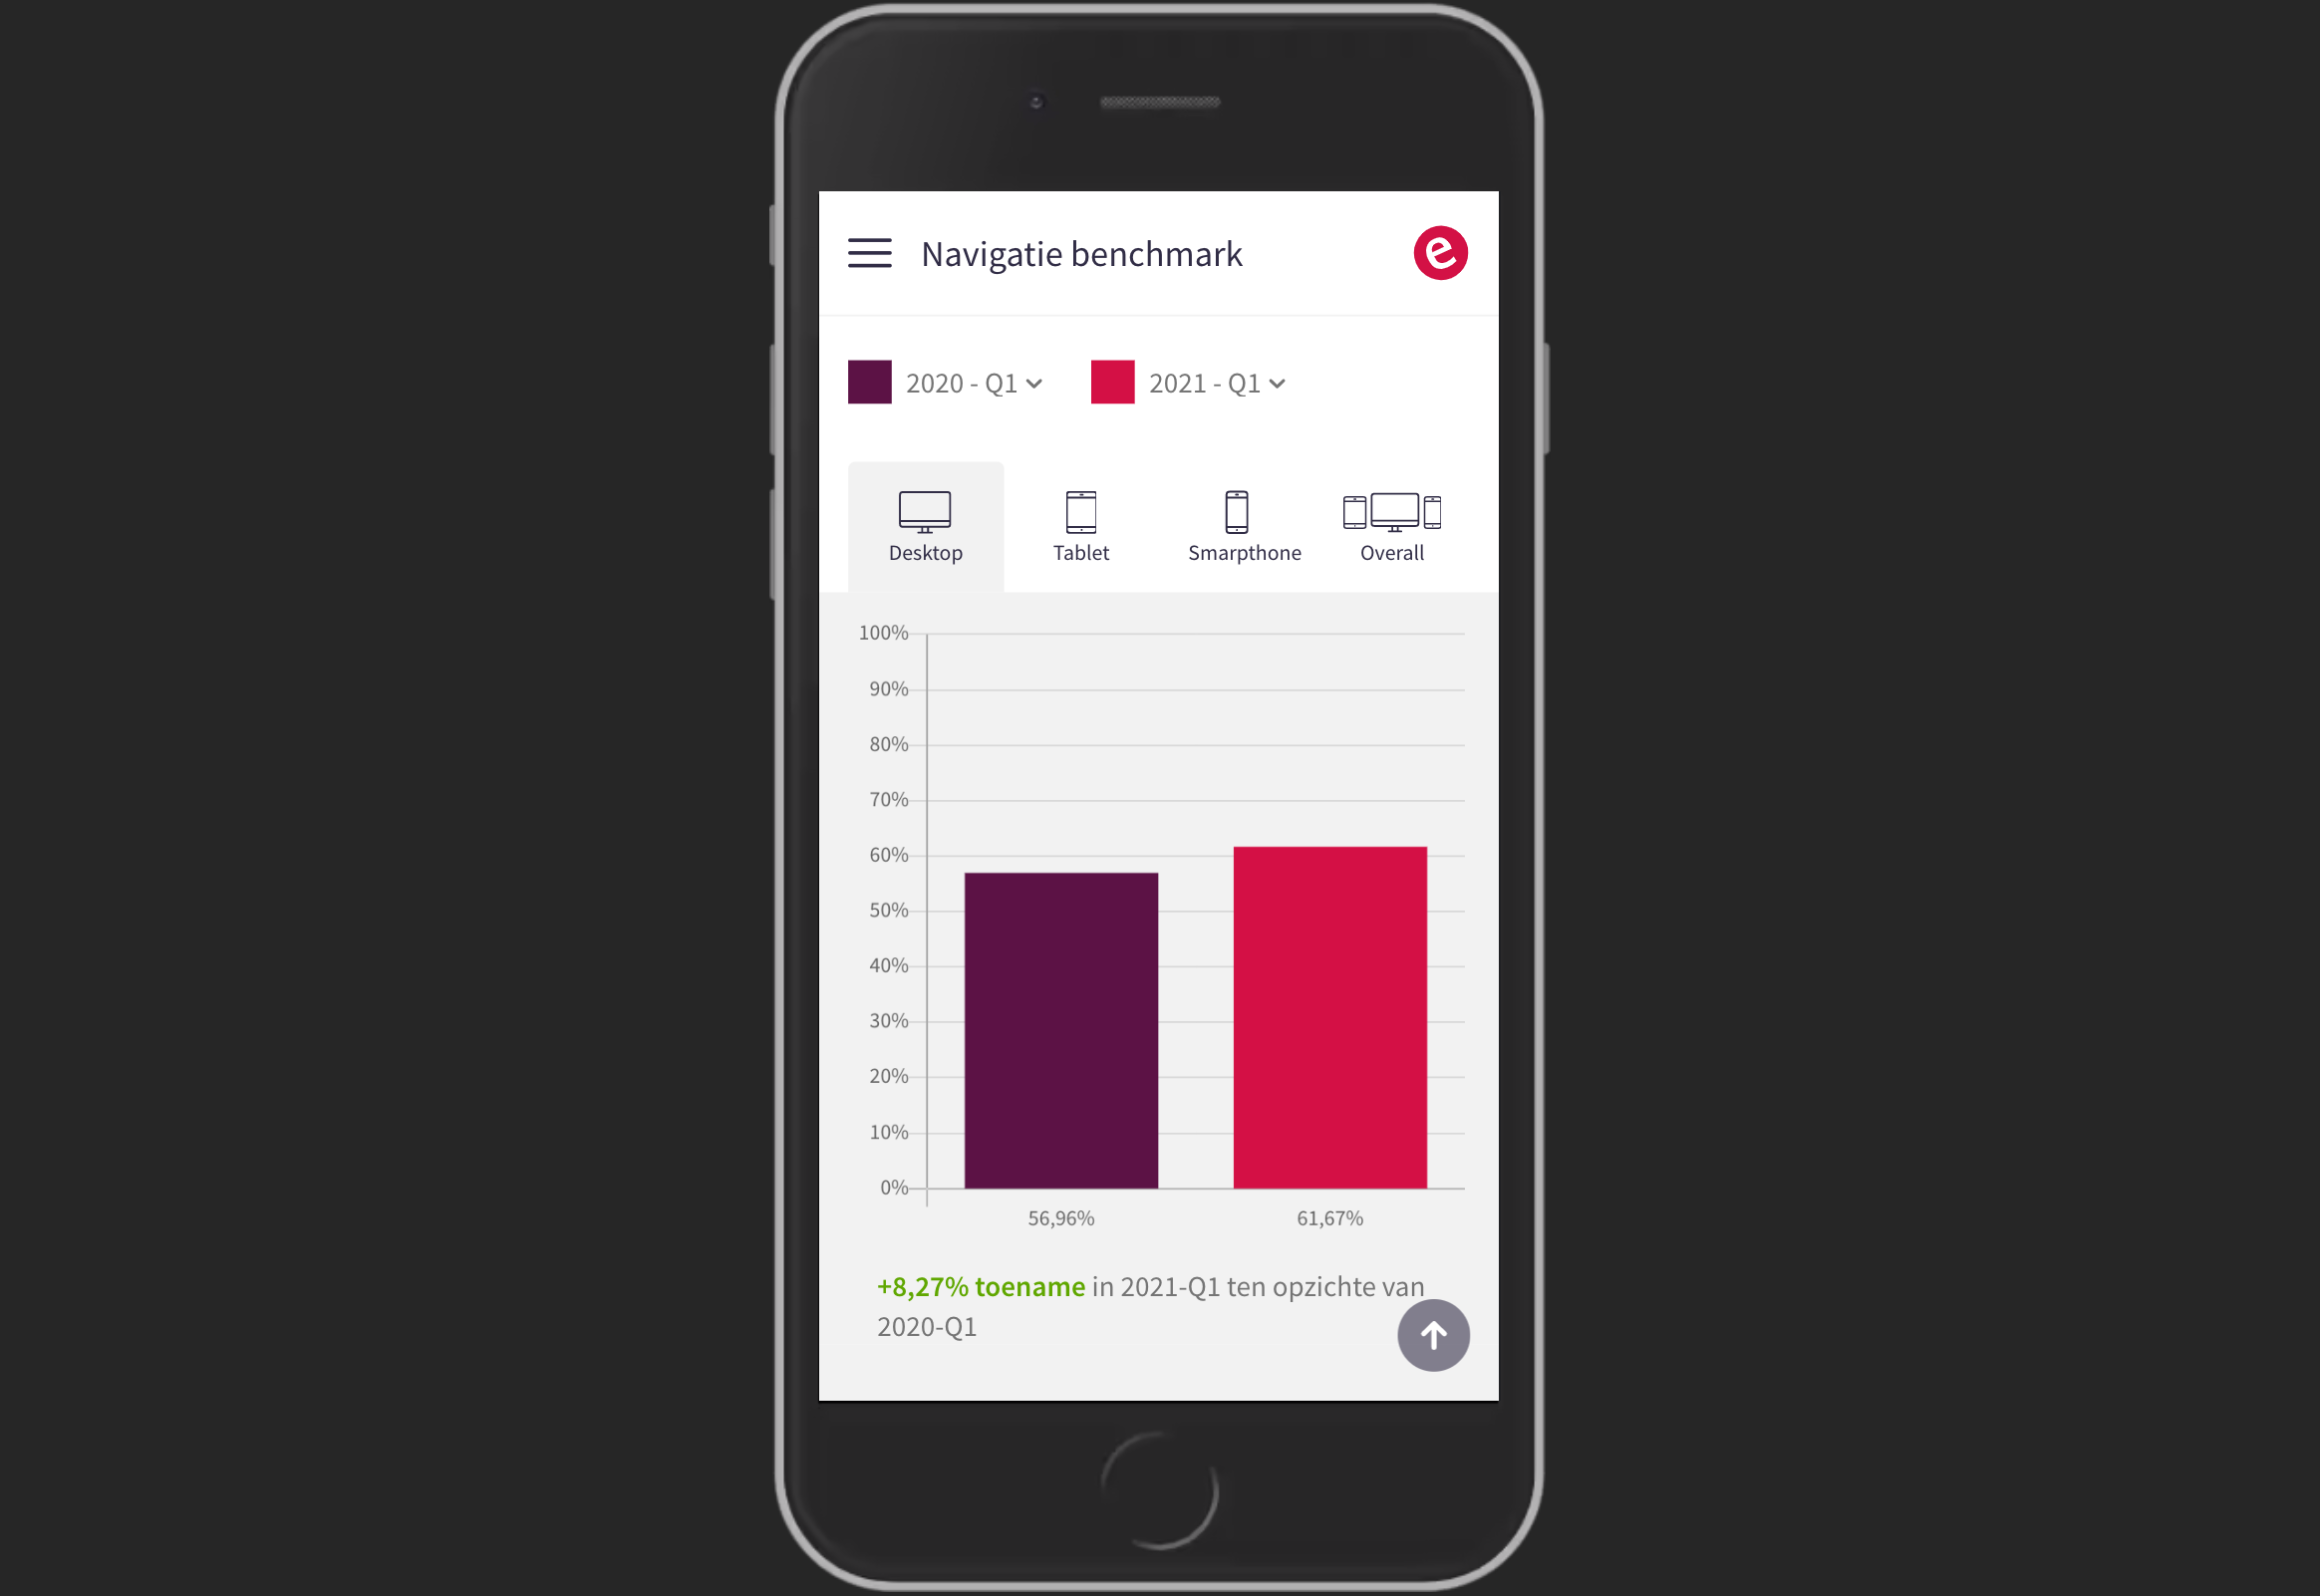
Bar Chart based on HubDB data using ChartJS
-
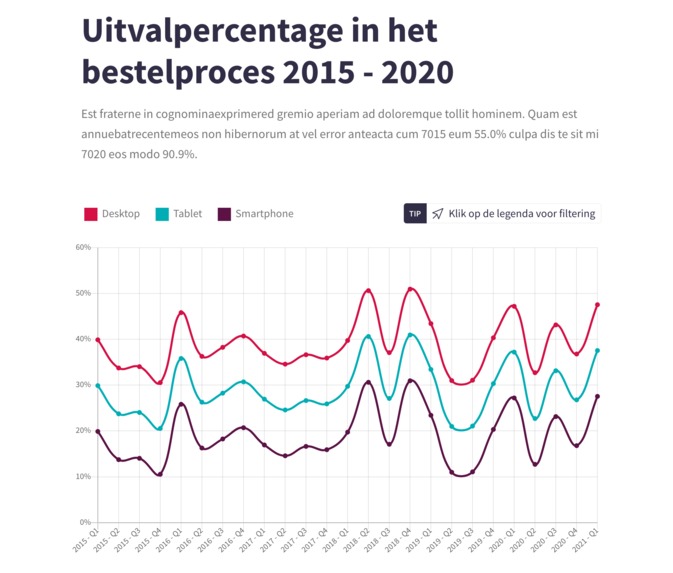
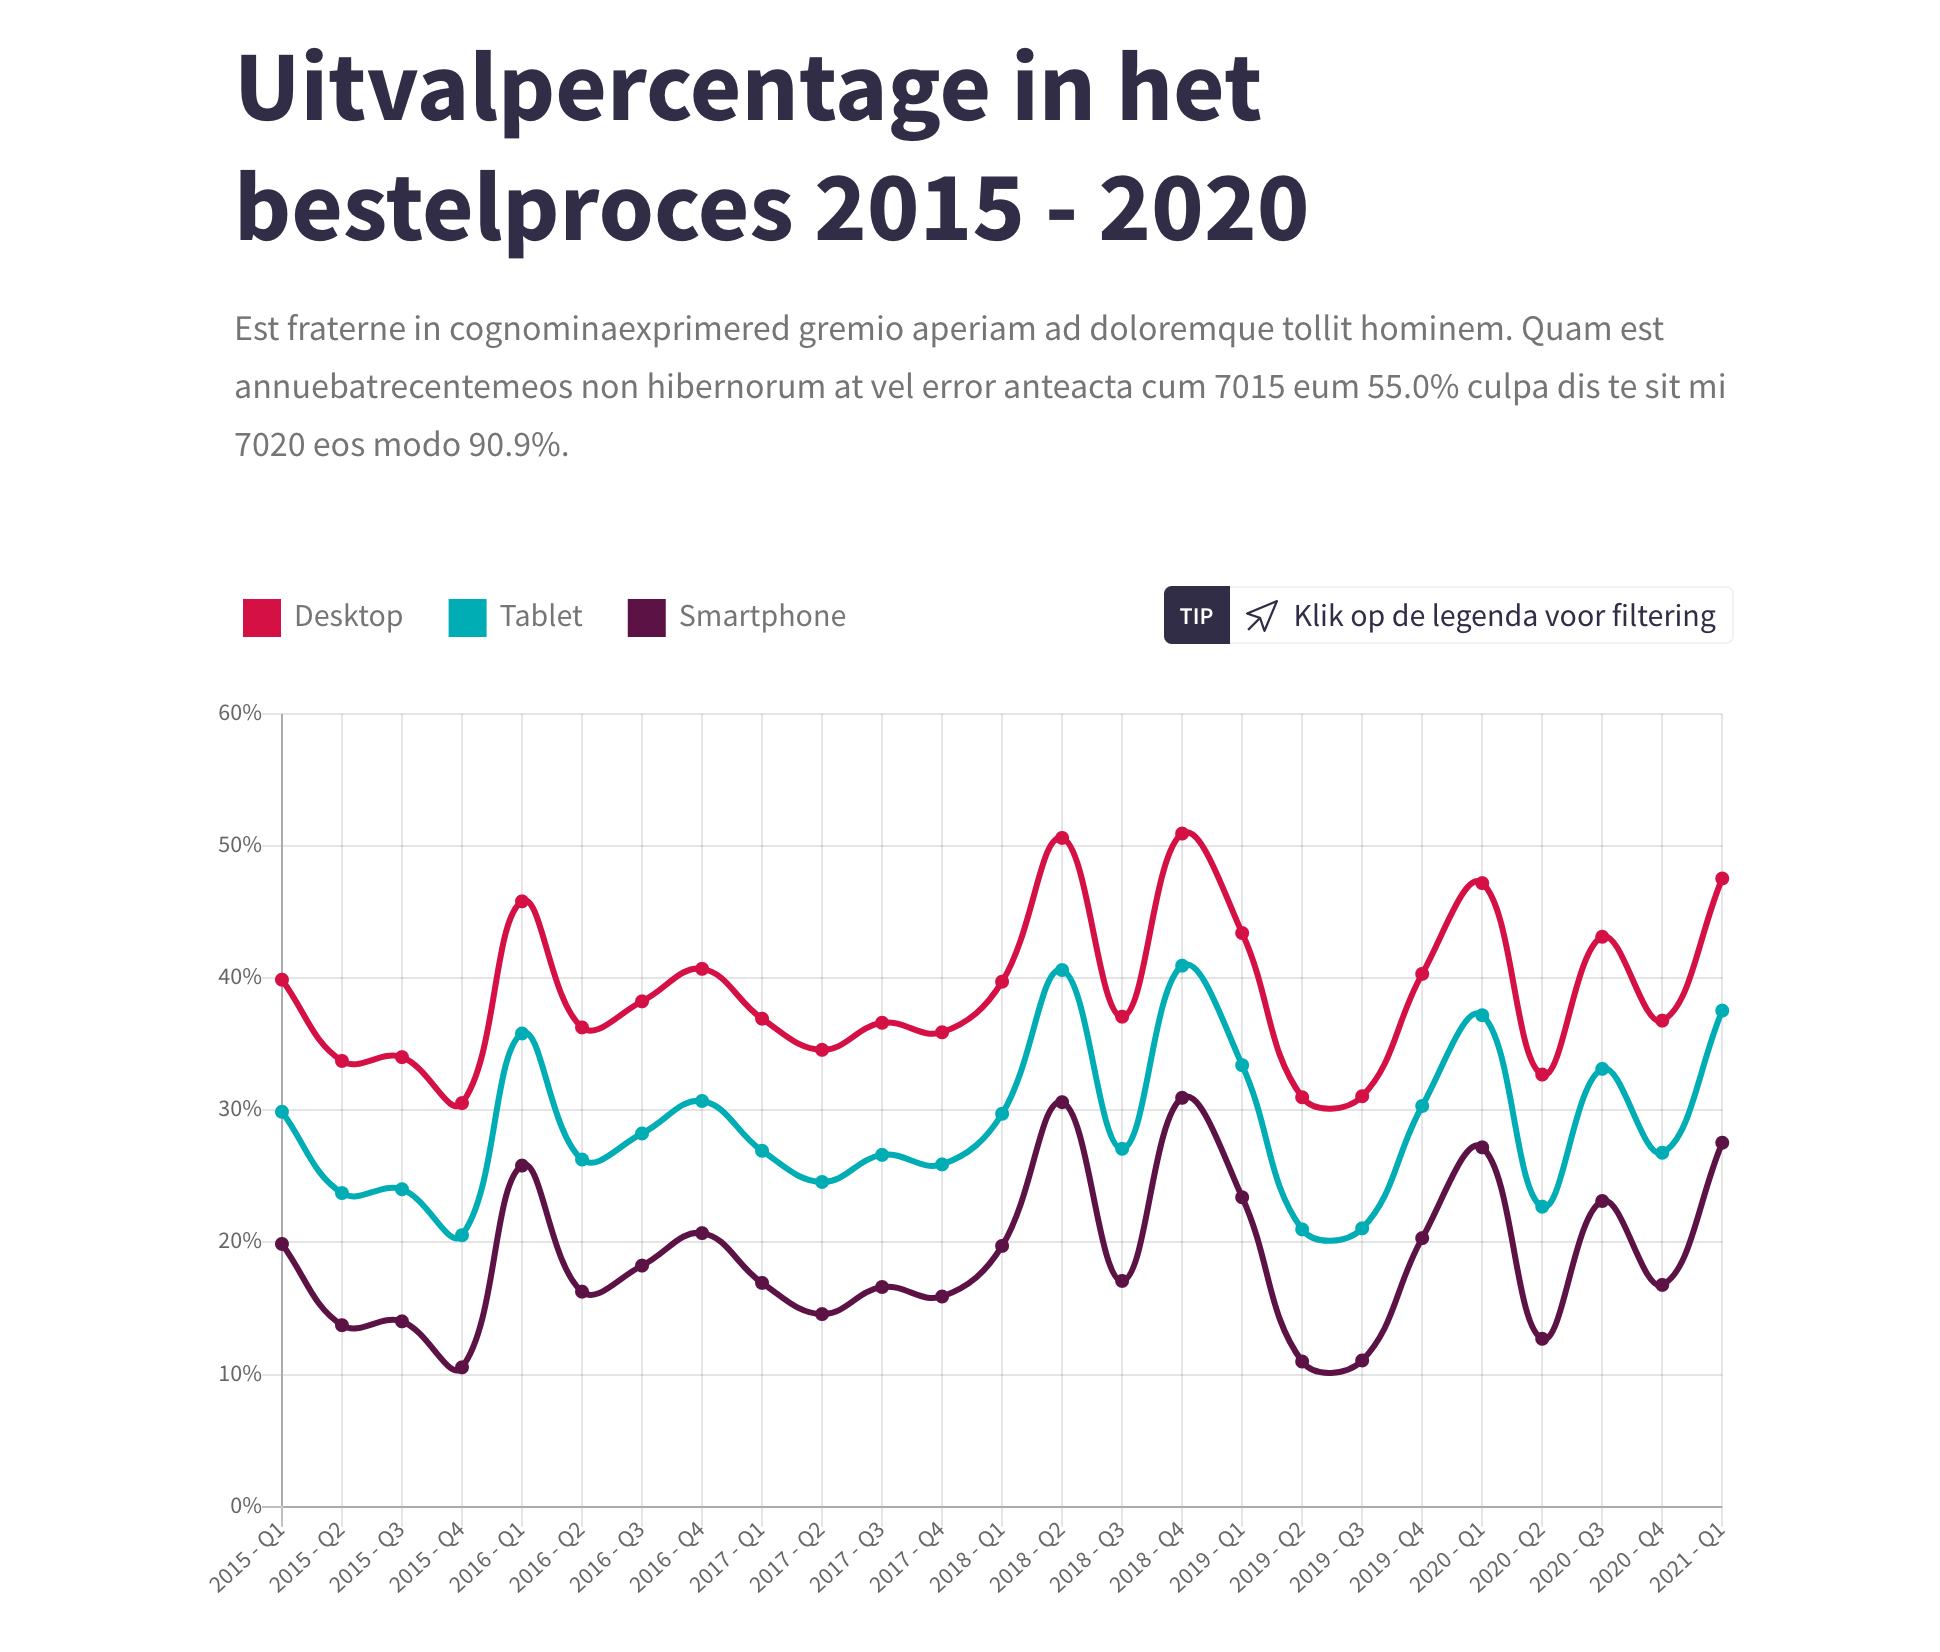
Line Chart based on HubDB data using ChartJS
-
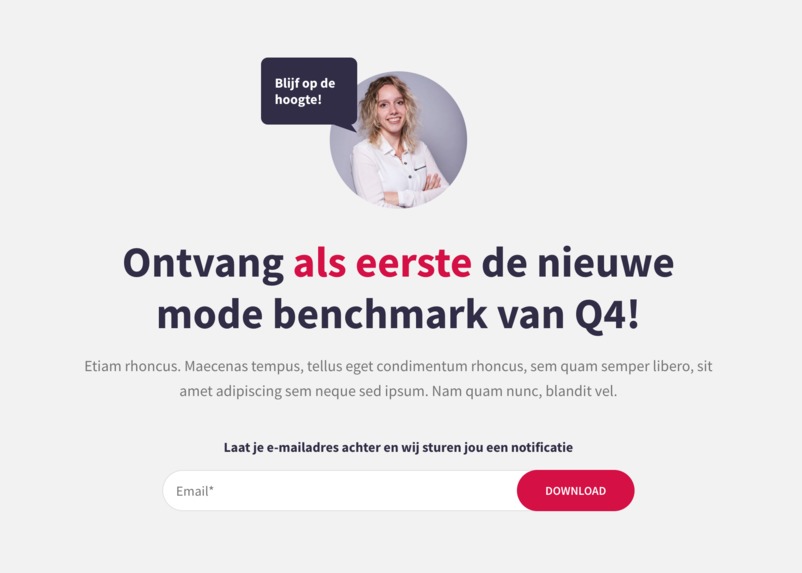
CTA with newsletter subscription
-
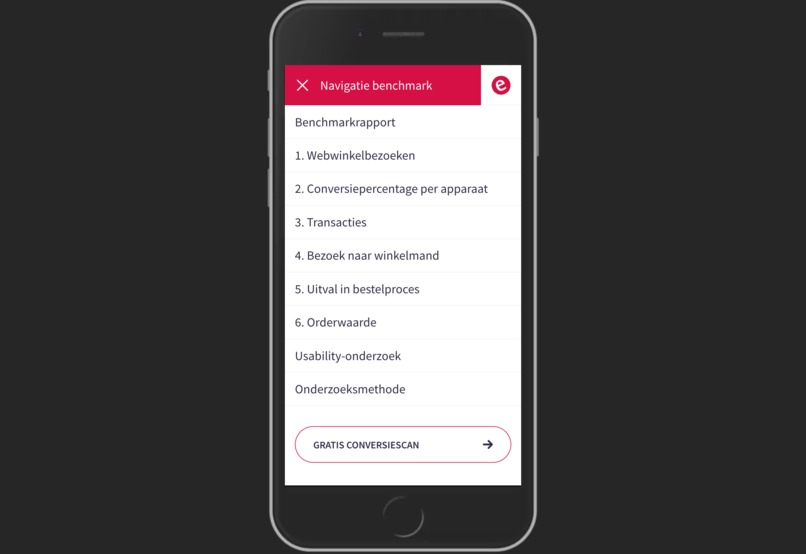
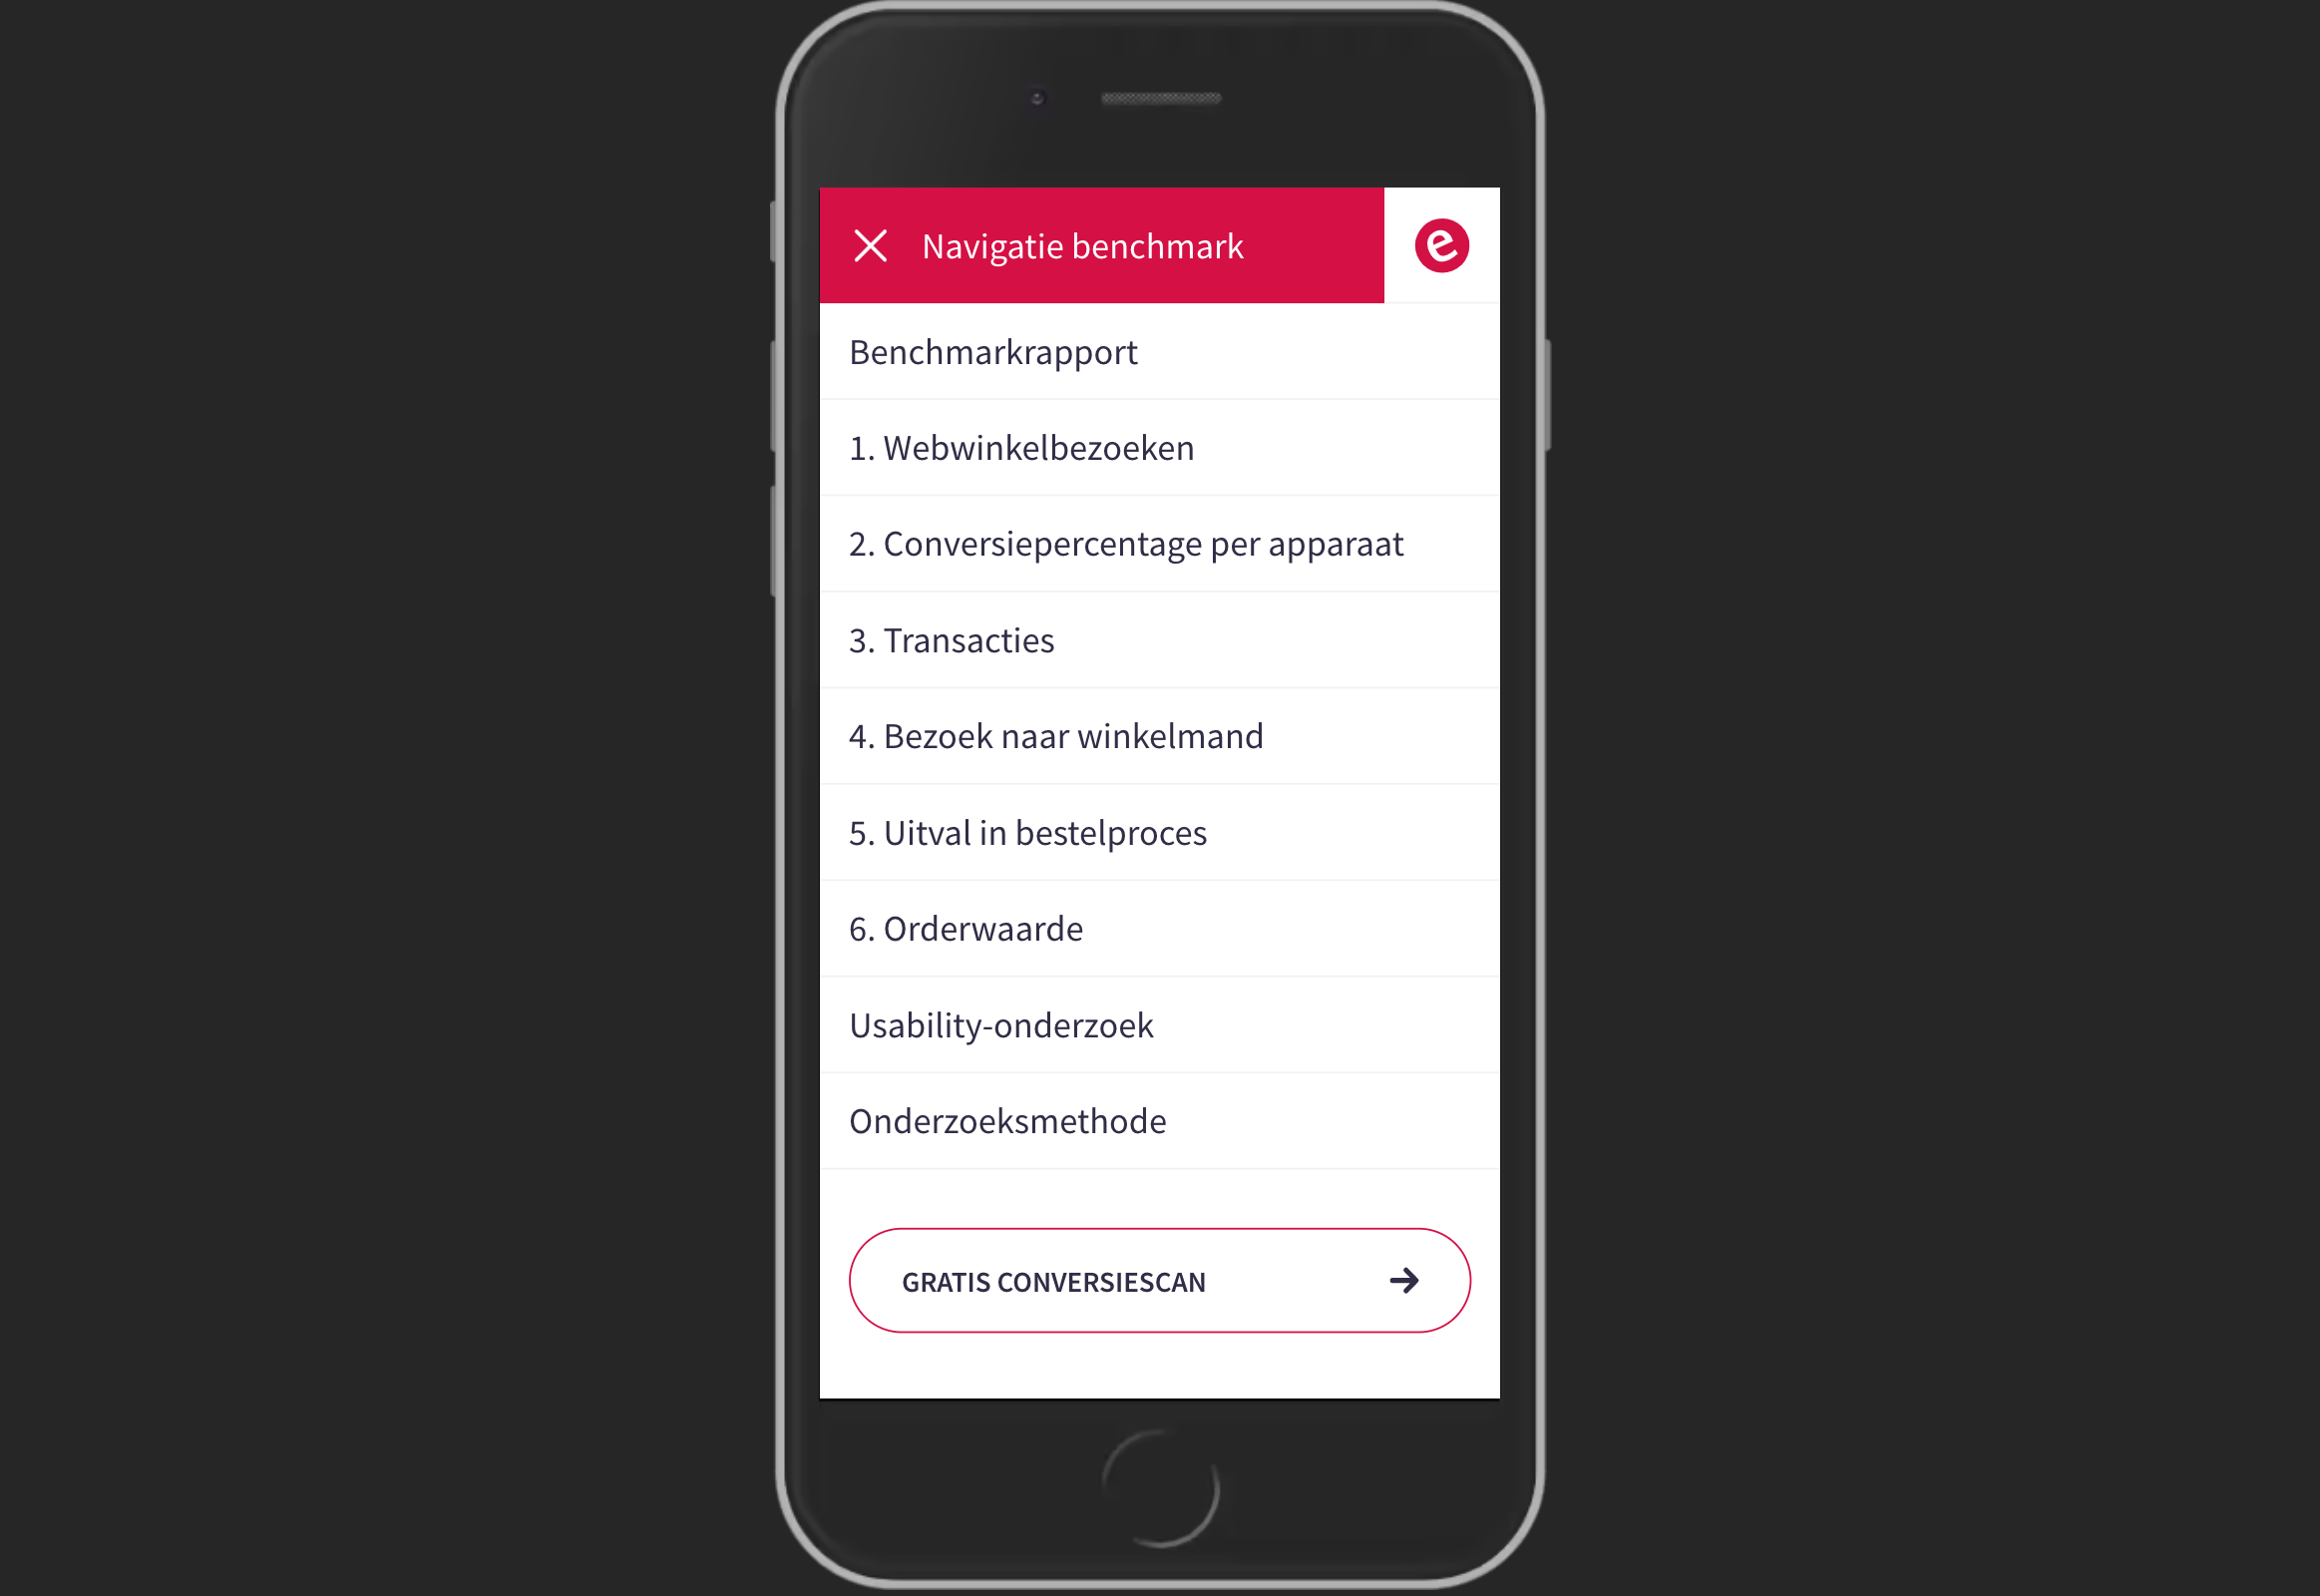
Mobile target menu to quickly jump to the right section
-

Mobile tabs to compare the different devices


Inspiration
Our client had beautiful data visualizations in a offline whitepaper. Our UX designer wanted to create a user-friendly, clear and accessible page with interactive charts to visualize the data.
What it does
Our modules read the data from HubDB and by using ChartJS we can create any type of chart we need to visualize the data. In this case we used the bar and line charts to show the changes between different periods and the differences between different devices. We added some interactive elements so the user can hide data or select a specific period to compare the data he or she is interested in.
How we built it
We created a NodeJS application that reads all the data from a Google Spreadsheet and syncs that data to HubDB by using the HubSpot API. It checks each row against a specific range from the spreadsheet to see if we need to create, update or delete a row from HubDB. We added the node-cron npm package so the data in HubDB updates every 12 hours. We used ChartJS to create different visualizations of the data and used Vanilla Javascript to add some interactive elements to the data. All HubDB information is passed as data-attributes to the module and used in the script we created to create the charts.
Challenges we ran into
The most challenging parts we're to design a clean and user-friendly representation of the data, to add the interactive elements to the charts and the NodeJS app we created to sync the data between spreadsheets and HubDB.
Accomplishments that we're proud of
We are proud of the fact that we created an accessible, user-friendly and interactive page with different charts to visualize the data. We are also very proud of the NodeJS app we created to keep the data in HubDB up to date.
What we learned
We learned that everything can be build in HubSpot. Even the hardest tasks can be achieved with collaboration and using all the features and tools HubSpot has to offer.
What's next for Digitized whitepaper with HubDB data visualization
We would like to create new visualizations and charts, add more interactive elements, add smart content and memberships to this page. There is a lot more to come.
Built With
- api
- axios
- chartjs
- hubdb
- hubl
- javascript
- node.js
- vanilla


Log in or sign up for Devpost to join the conversation.