Inspiration
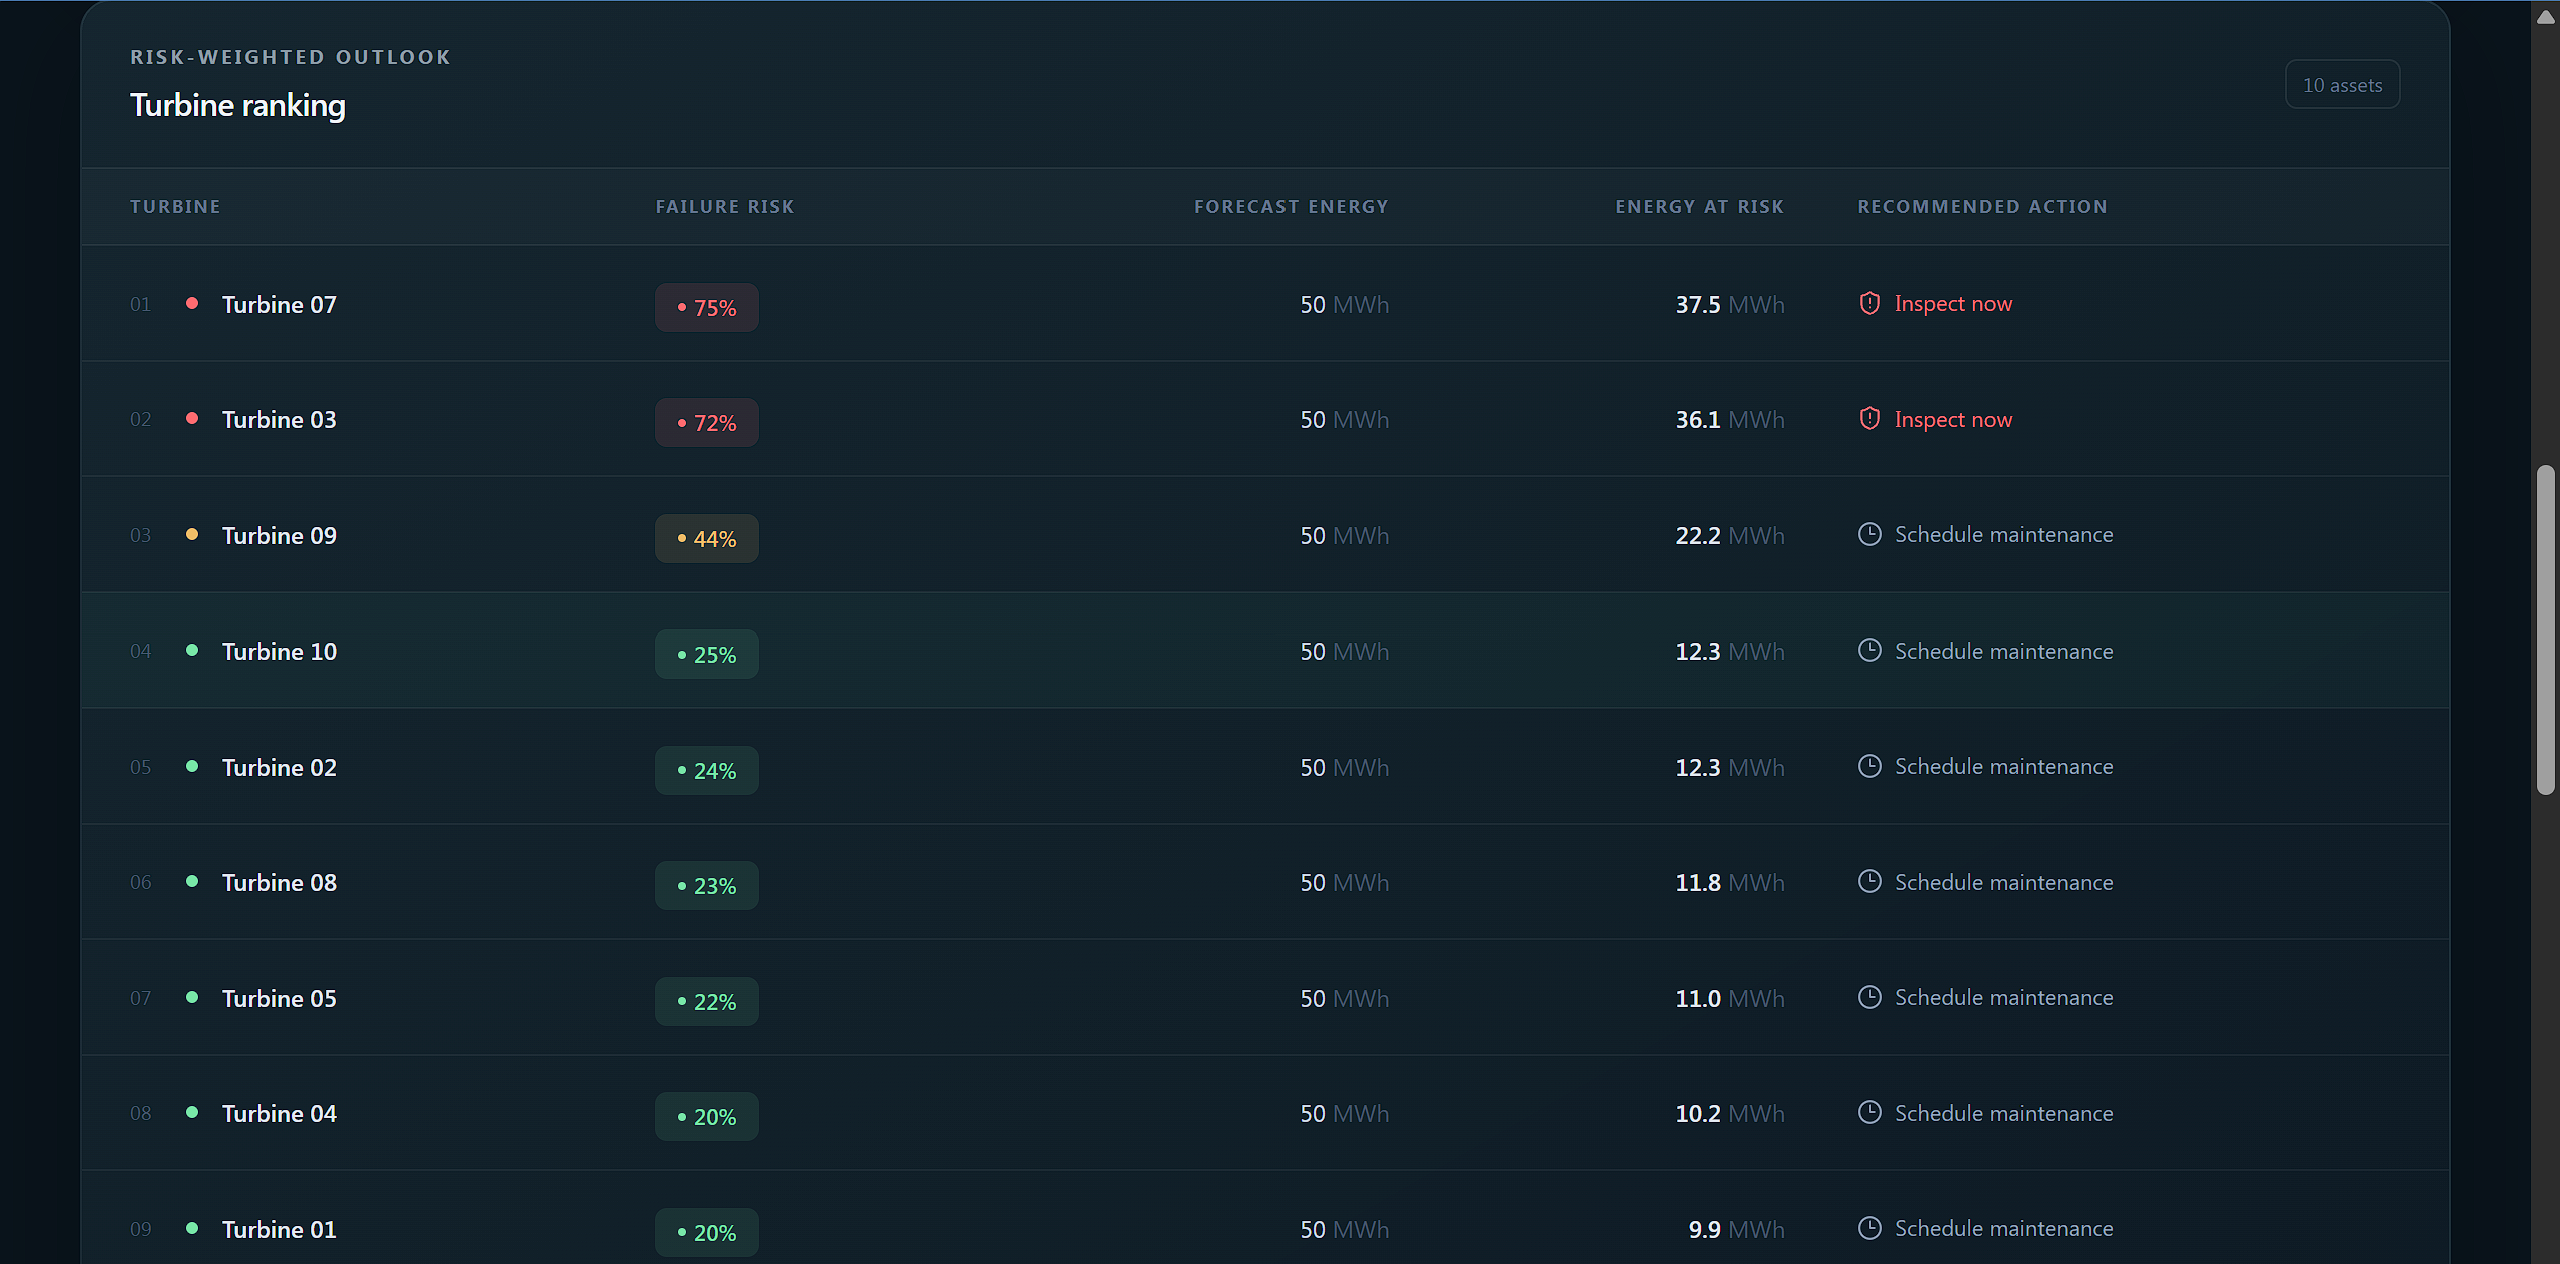
Twind uses APIs such as the National Weather Service API and the NREL WIND Toolkit. It monitors air pressure, wind speed, weather conditions, and turbine conditions to determine whether a turbine is a high-risk asset. This information is used to calculate the digital twin.
What it does
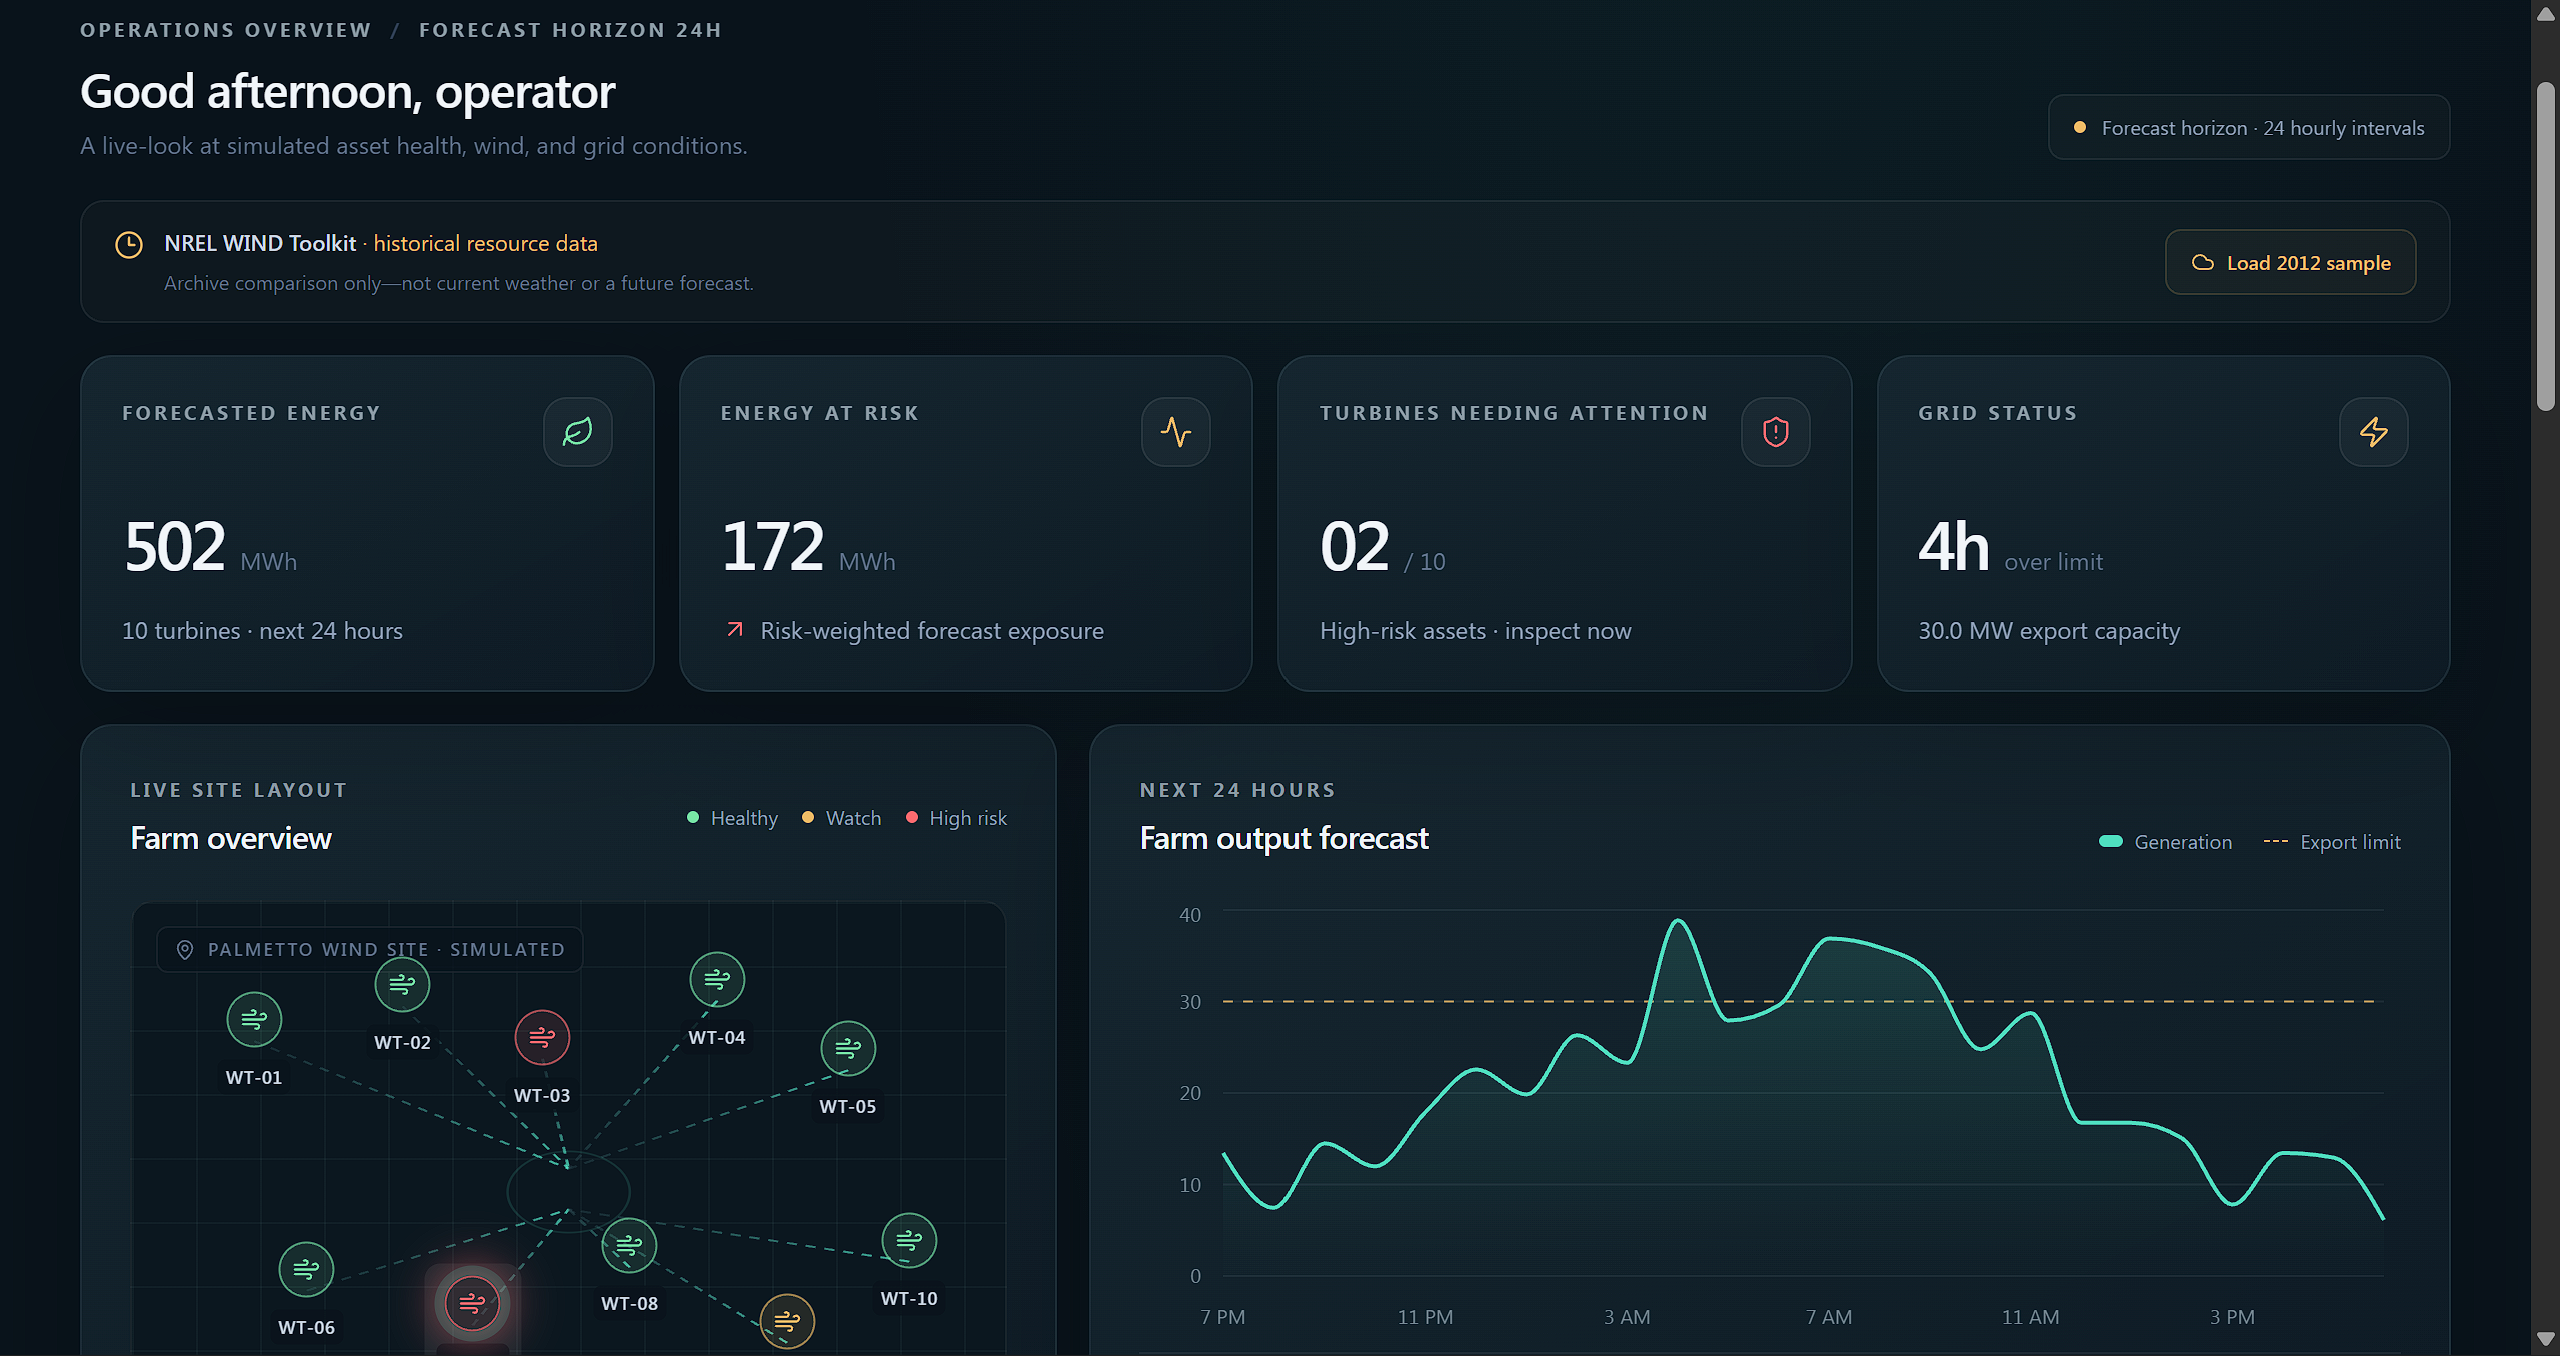
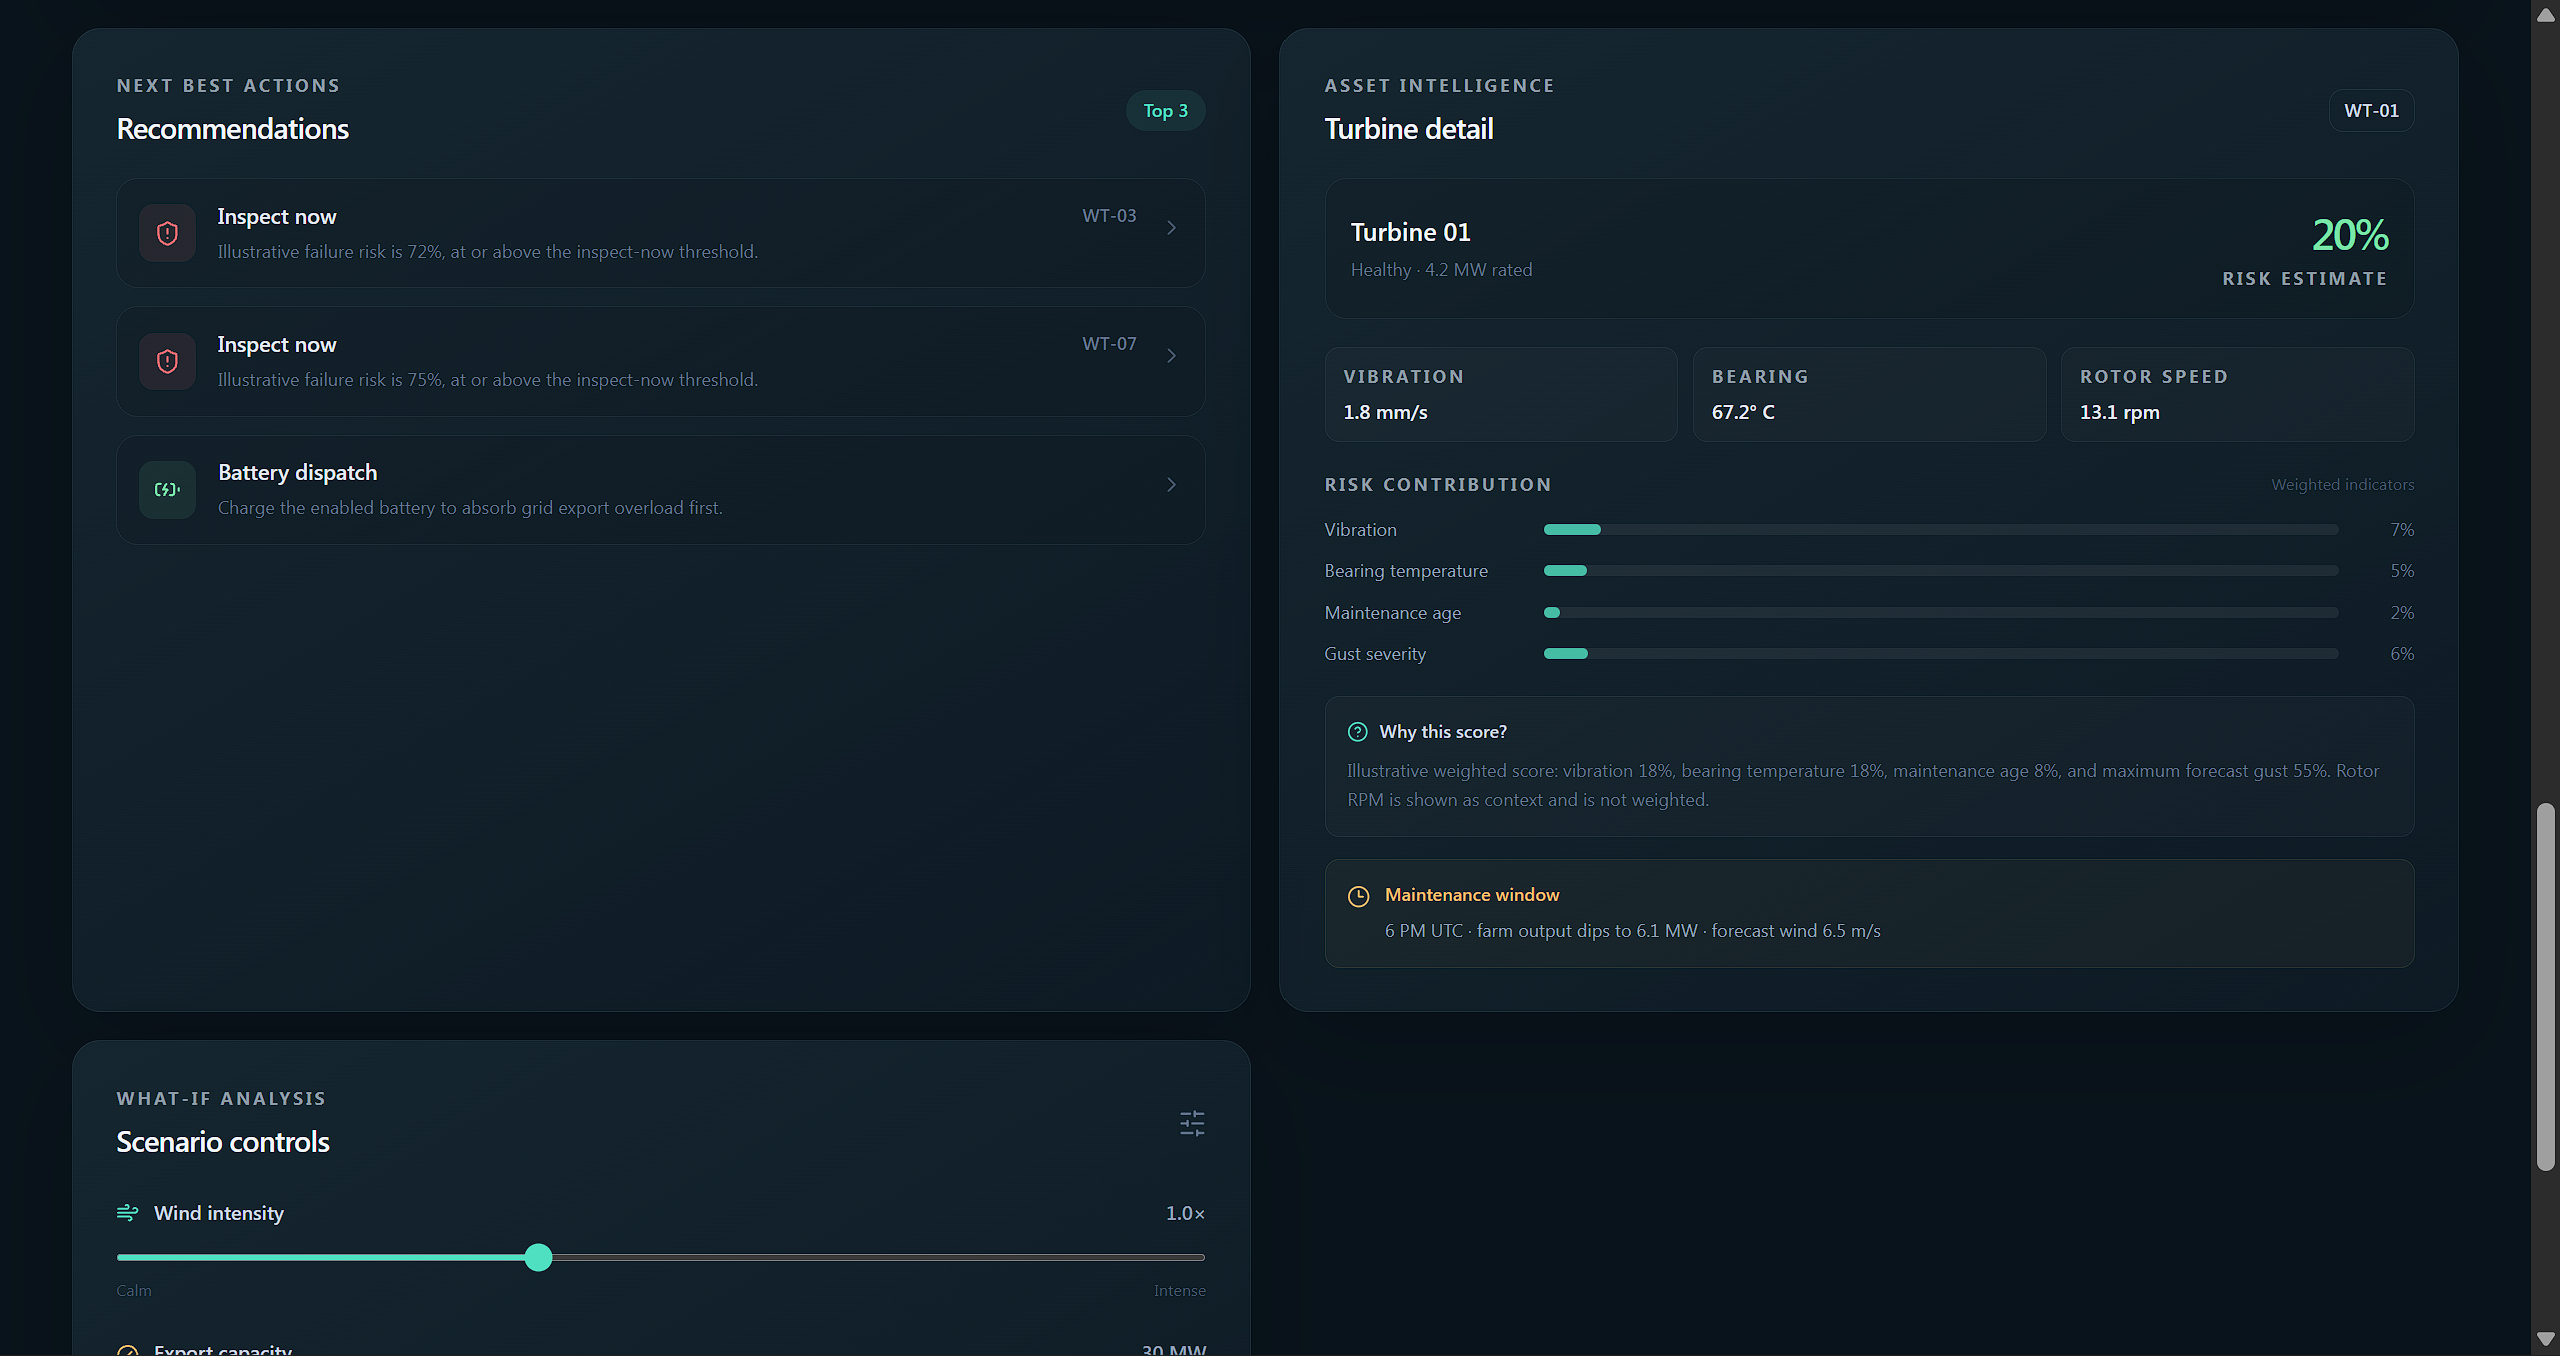
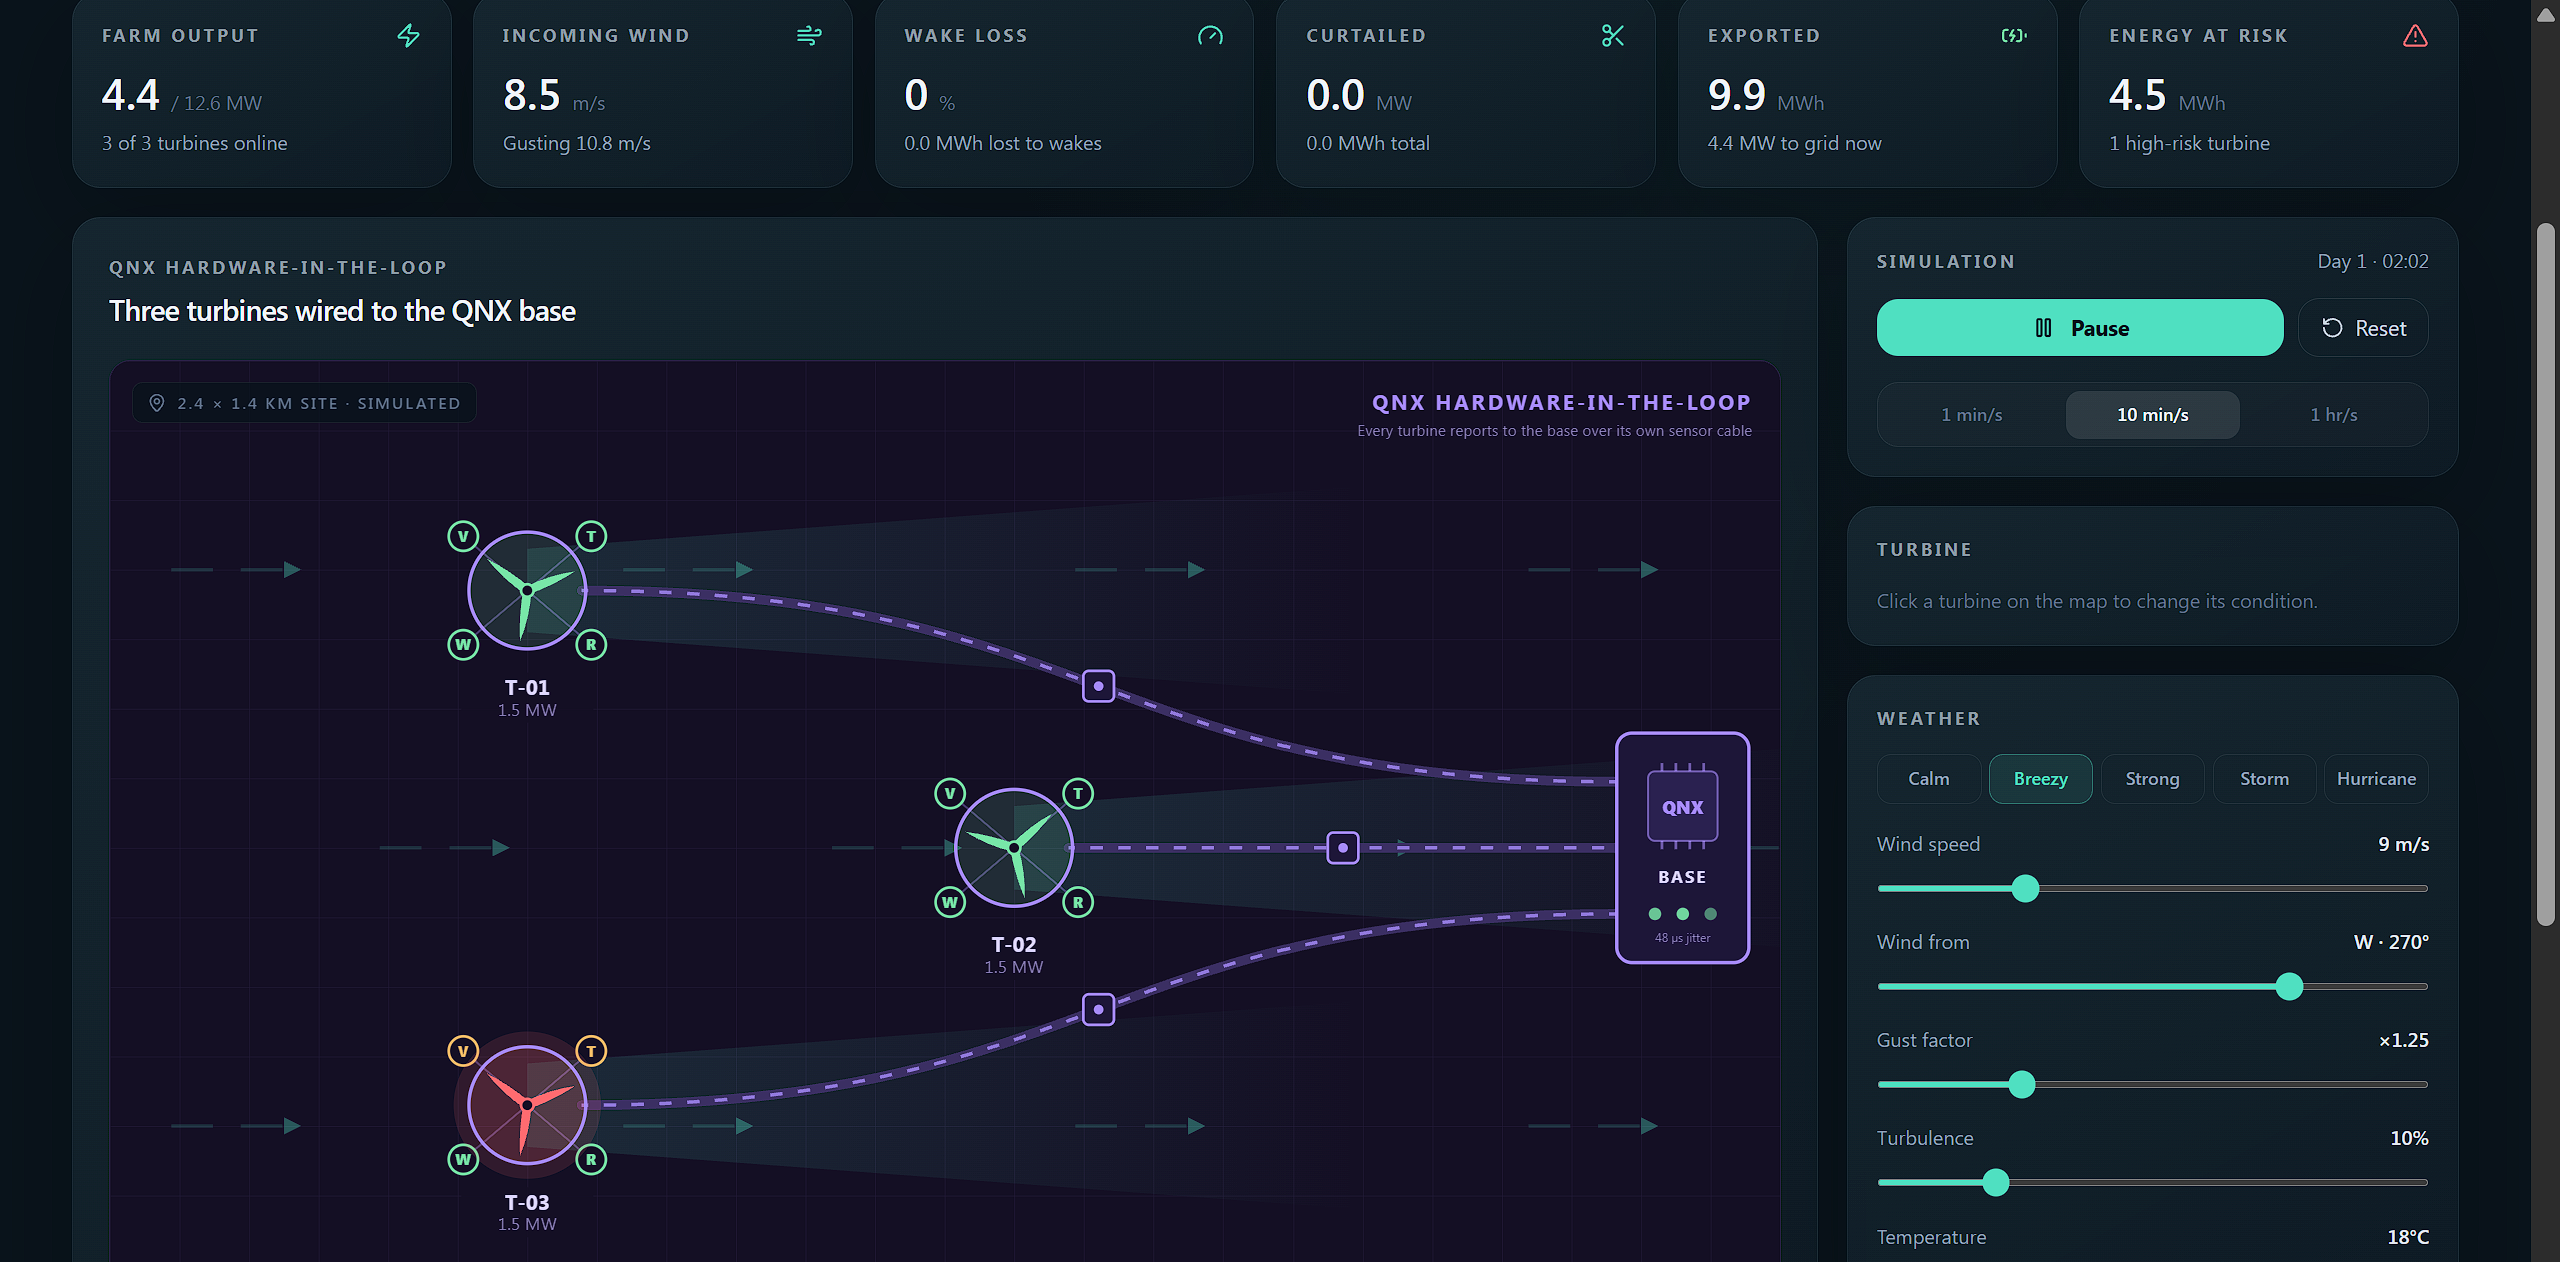
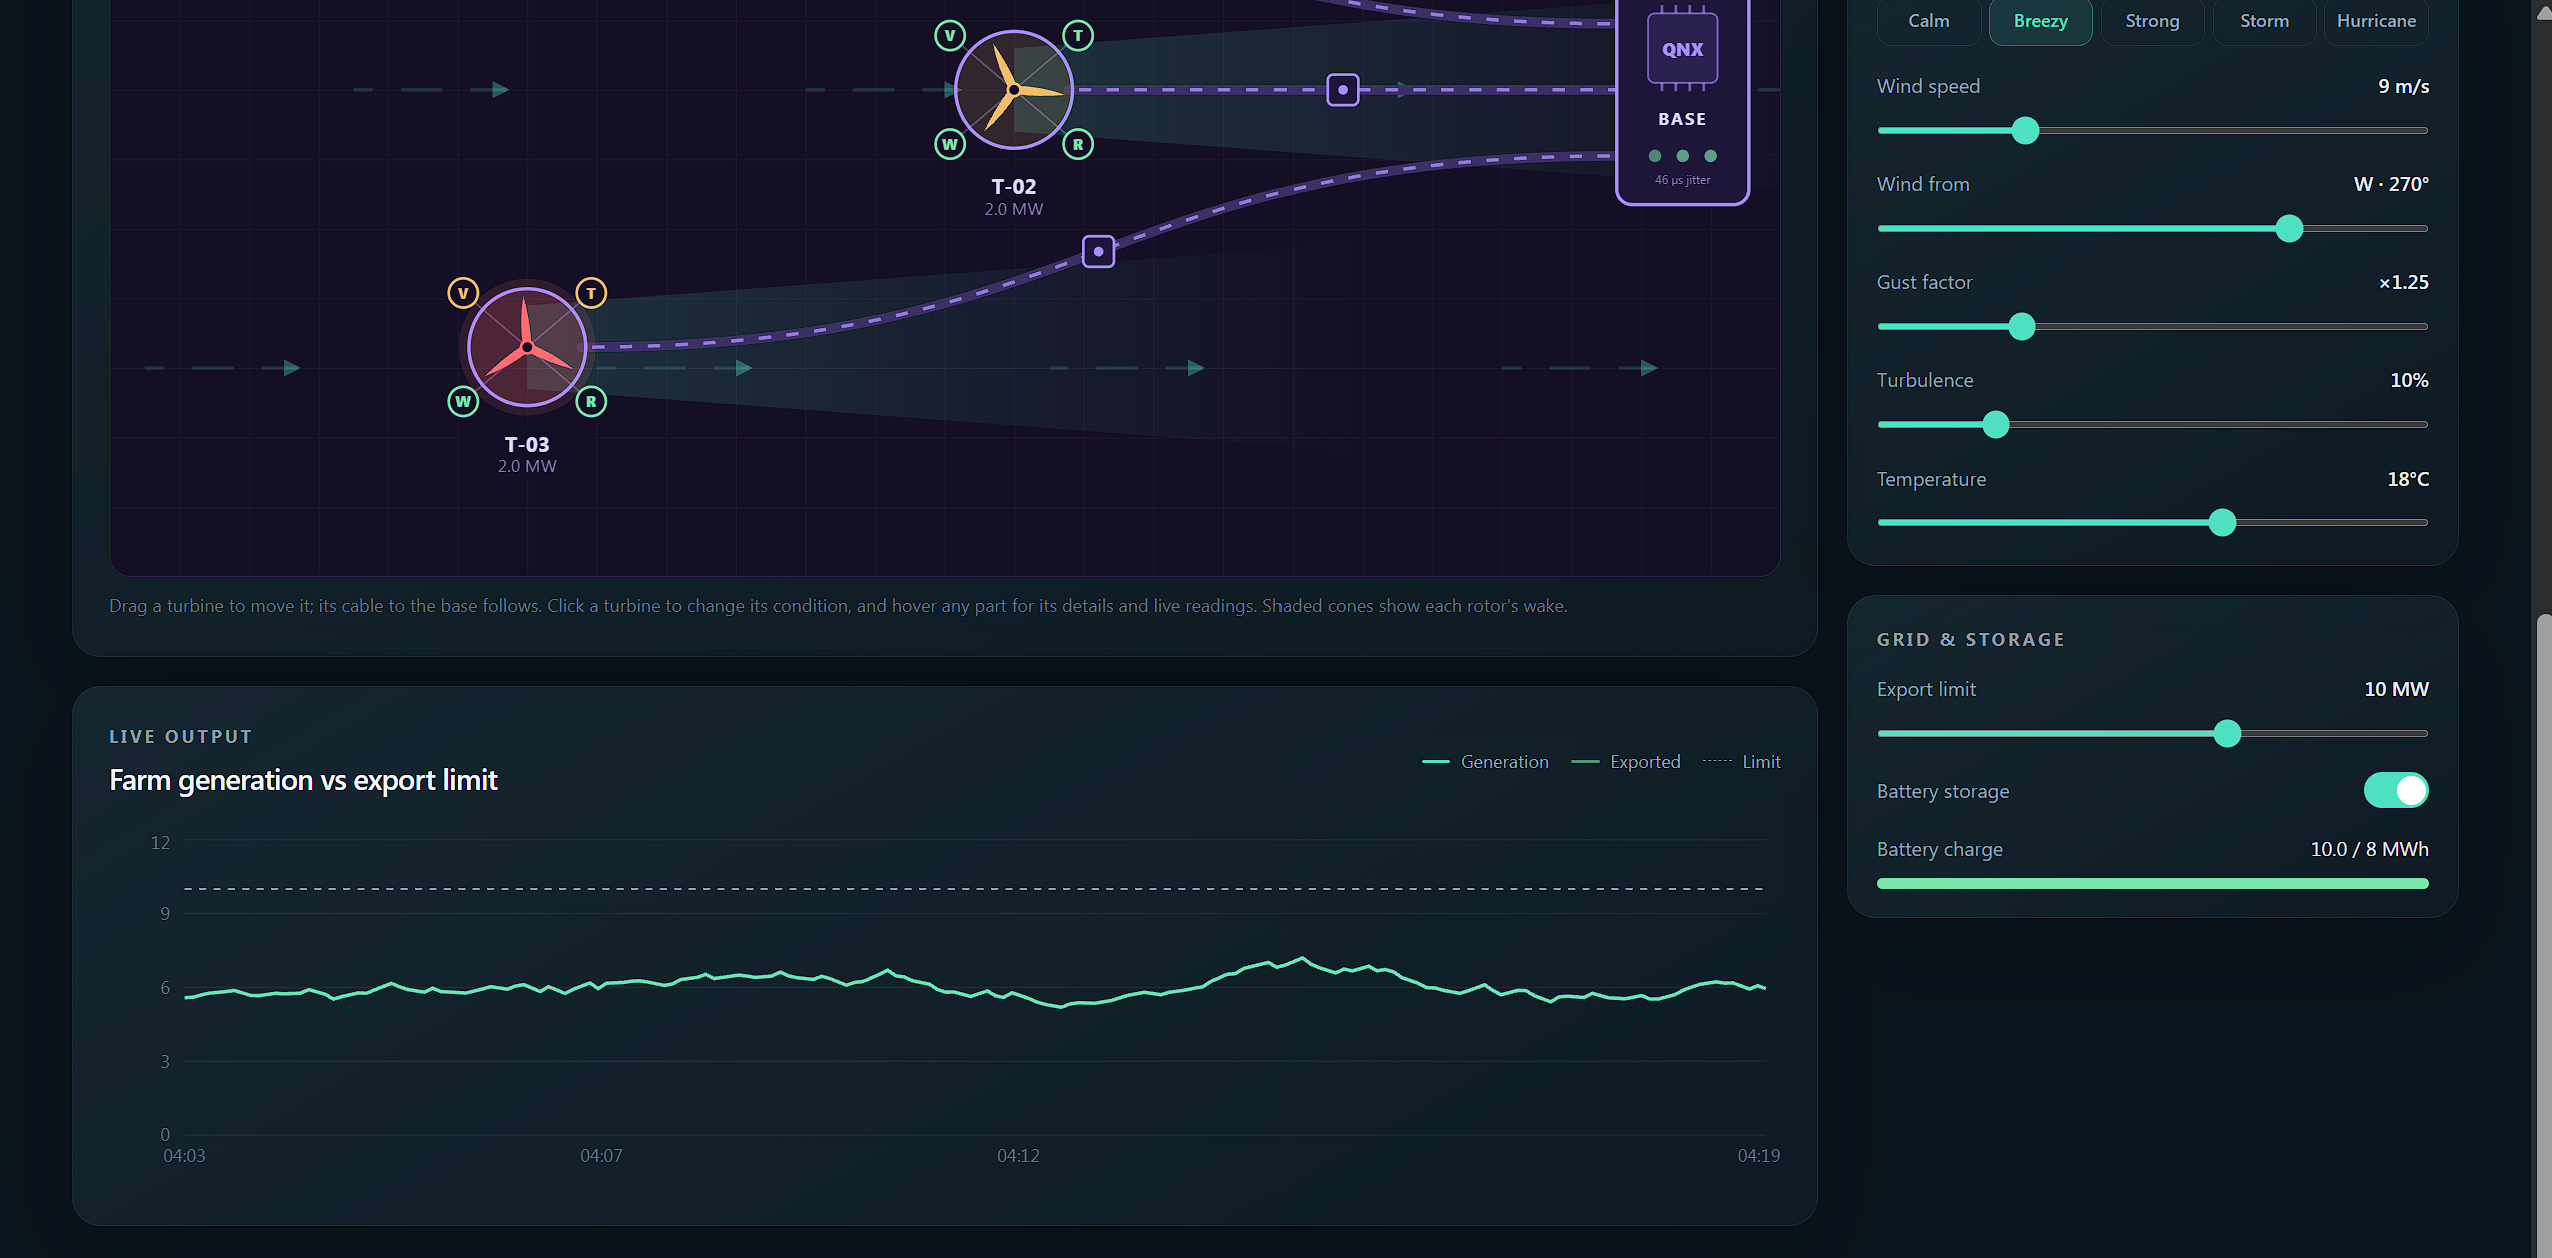
For user interaction, there is a dashboard that includes the location and status of each wind turbine. Users can click on each turbine to view its simulated conditions, including temperature, RPM, gust severity, and maintenance age. Users can also input specific parameters, such as RPM and temperature, for the program to simulate. This displays a chart that predicts expected output based on the current condition of the turbines. The simulation page includes a site builder where users can move individual turbines. When a user clicks on a turbine, they can edit its features. The simulation also includes a live output chart, an events section, and a grid and storage section.
How we built it
First we built the data importer using the APIs and a custom parser for better usability. Then the Twind engine, allowing us to simulate turbine conditions. We built these conditions using stats from the research paper Wind turbine condition monitoring dataset of Fraunhofer LBF by Atabak Mostafavi. The weather_provider is where we call the APIs. After that, we put it into FastAPI for better data handling, wrapping up the backend development. We made a data generator and a datafile with demo data for testing purposes. For frontend HTML, CSS, Tailwind and Vite to make a clean, modern dashboard. For the hardware aspect, we made three turbine objects that have several variables and several weather variables that affect the turbine's output. The turbines are all connected through wiring and sensors to the base controller which takes in their input. When the user changes their input, the simulation updates the objects and their aspects in real time.
Challenges we ran into
One challenge we ran into was implementing the NREL WIND Toolkit, which is a key part of making Twind work. It was not working because of backend issues, including an outdated URL, incorrect API parameters, and data that was not being parsed correctly.
Accomplishments that we're proud of
The achievement we are most proud of is getting the NREL WIND Toolkit to work properly. We did this by fixing the link we were using and using a better parsing tool. Another achievement we are proud of is implementing a stress-test simulator. In the simulator, users can edit weather conditions, turbine locations, and the turbines themselves.
What we learned
We researched and learned a lot about wind farms to make our simulation as accurate as possible. Our dashboard displays forecasted energy, energy at risk, turbines needing attention, and grid status. In the individual turbine details, it displays vibration, bearing temperature, rotor speed, maintenance age, and gust severity. This is all key information for a real wind farm.
What's next for Twind
In the future, Twind could be expanded because the more data the digital twin can use, the more accurate the simulations could become.

