-
-
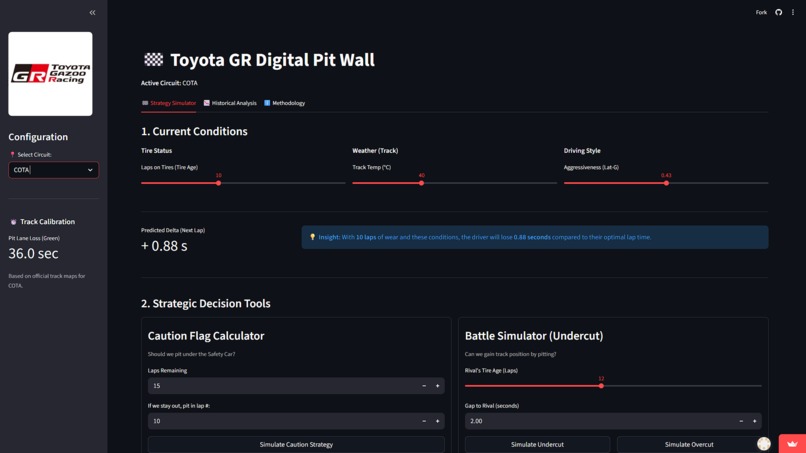
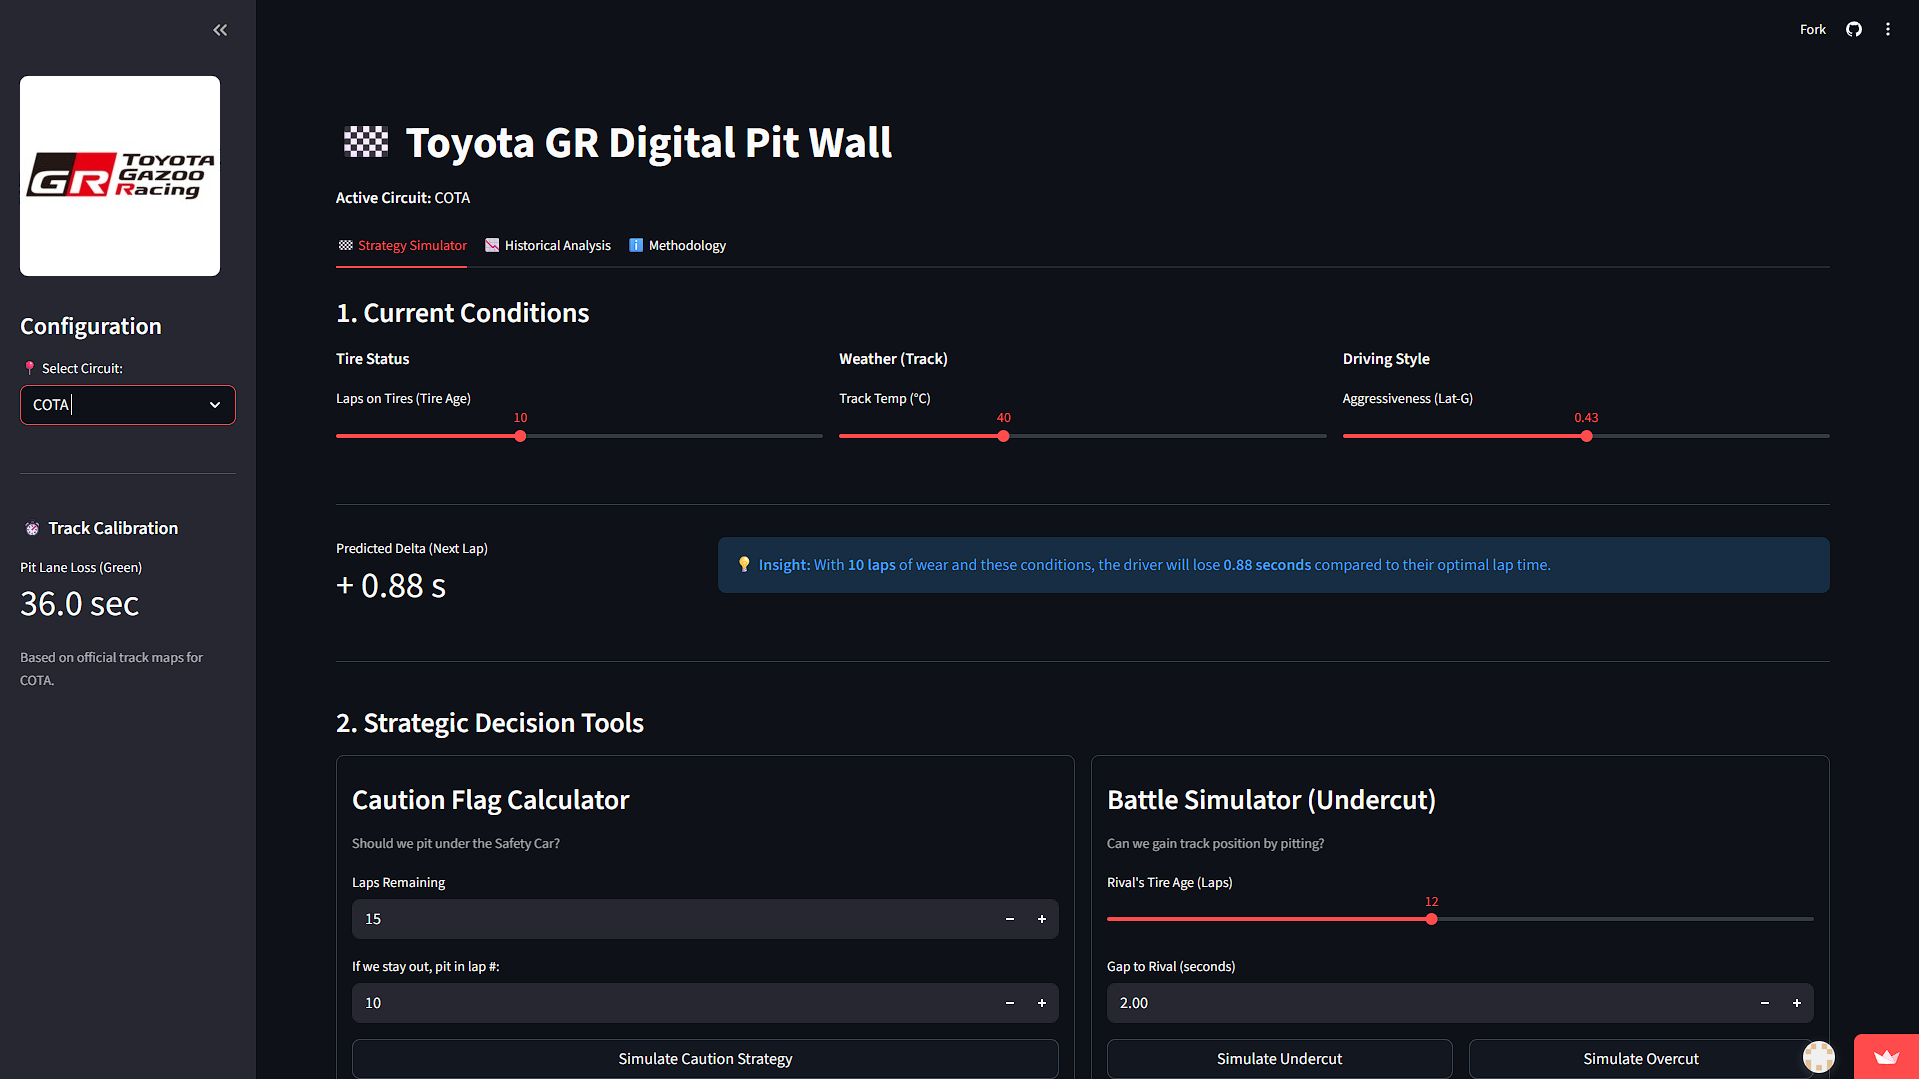
Main Dashboard: Real-time Tire Degradation Predictor and Strategy Simulator.
-
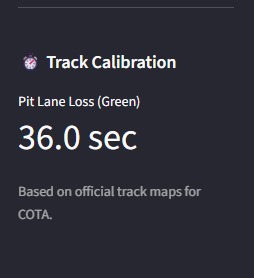
Track Calibration: Pit lane transit times are calibrated per track using official data.
-
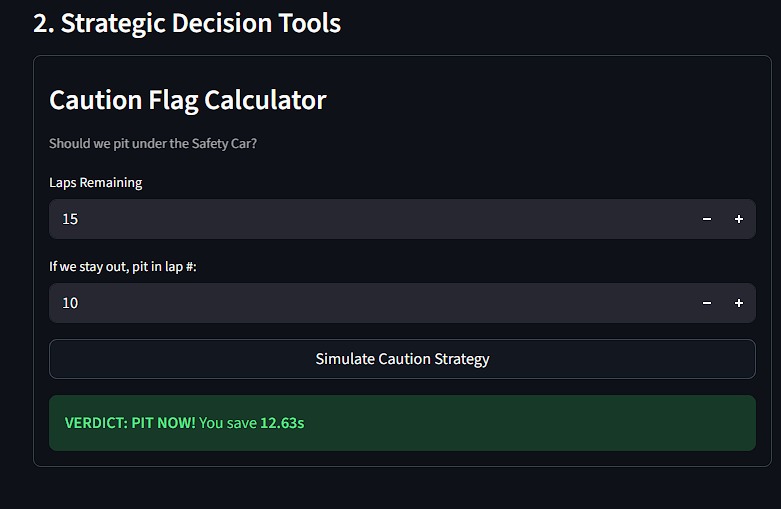
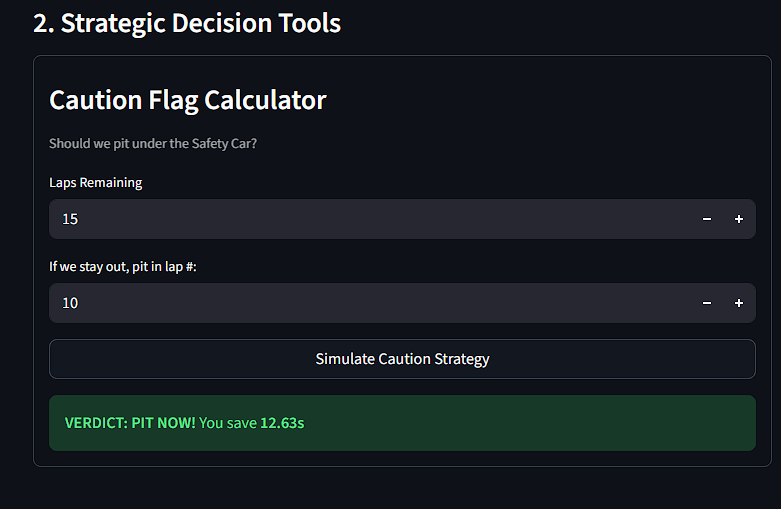
Caution Scenario: The simulator correctly identifies a strategic opportunity to pit under yellow.
-
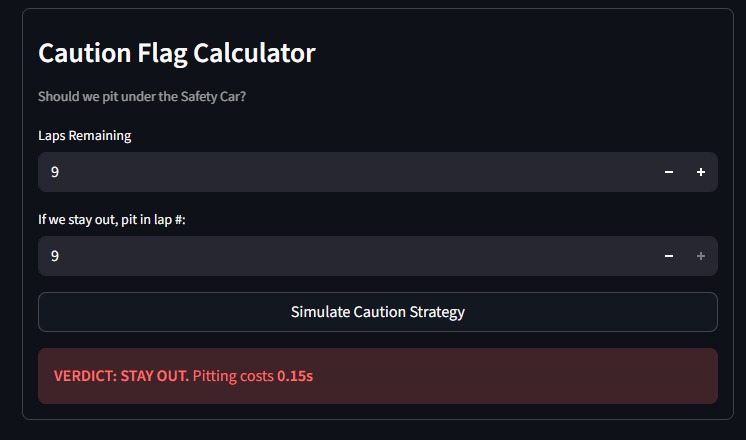
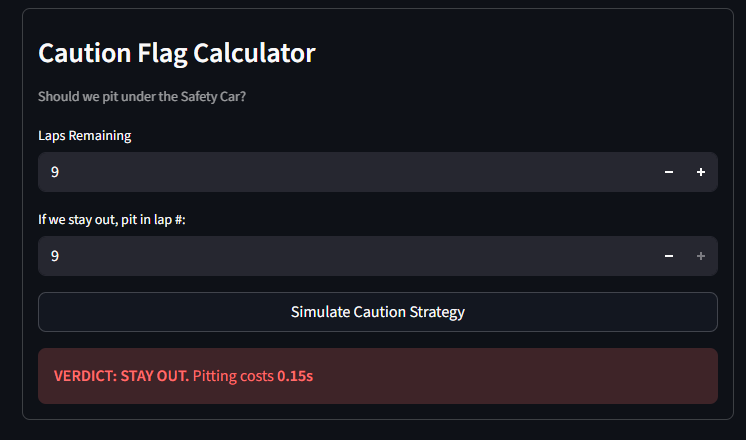
Caution Scenario: The system advises against a pit stop when it results in a net time loss.
-
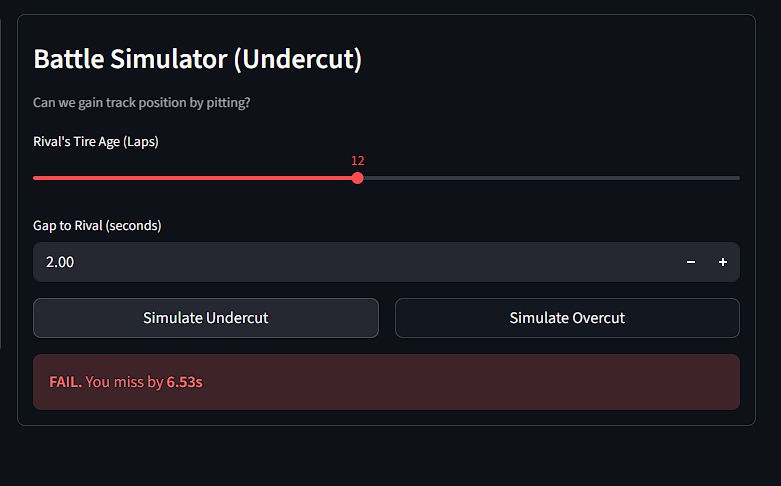
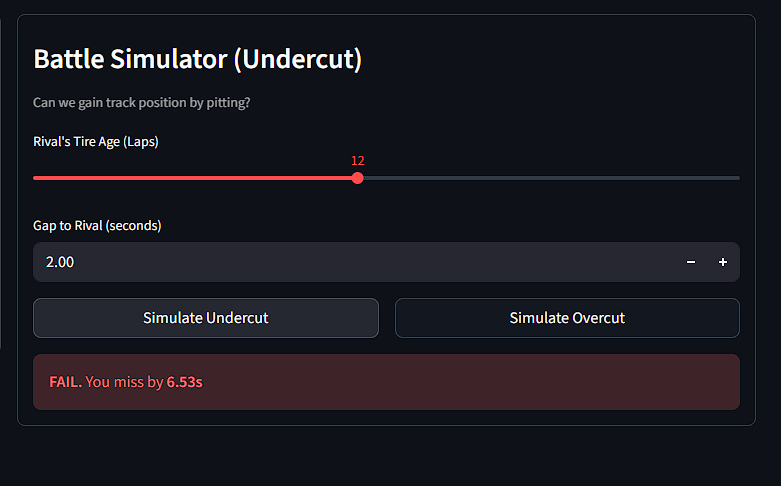
Undercut Simulation: Predicting a failed attempt to gain track position via an early pit stop.
-
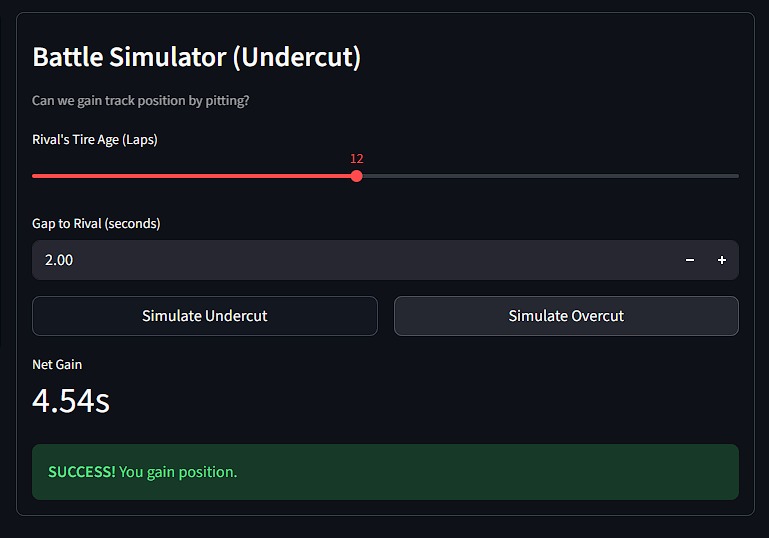
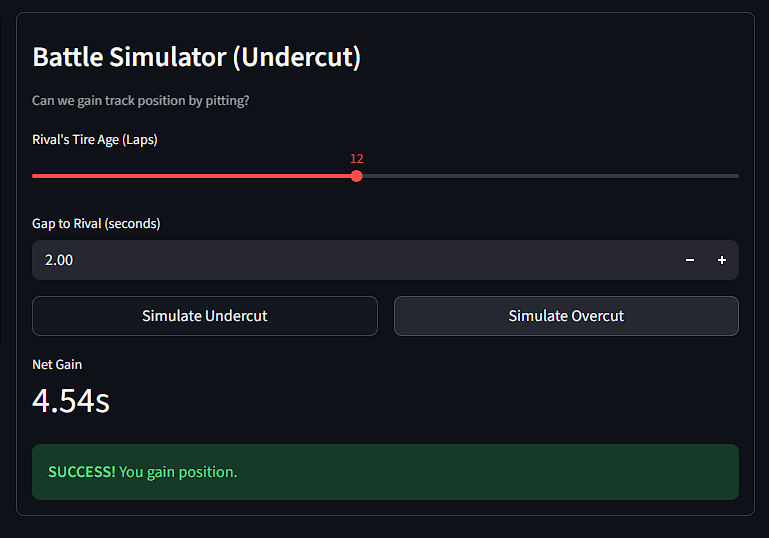
Undercut Simulation: Successfully predicting a track position gain of 4.54s.
-
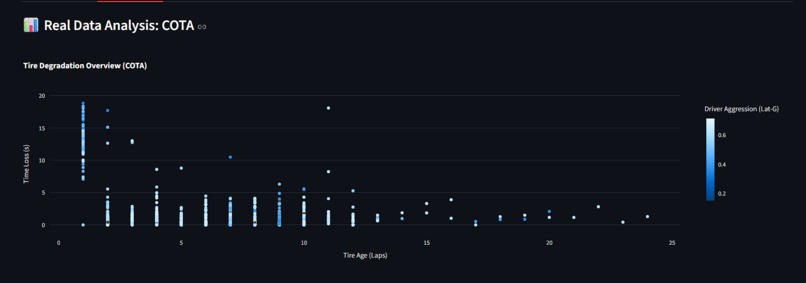
Historical Analysis: Visualizing tire degradation (Lap Delta) over a stint at COTA.
-
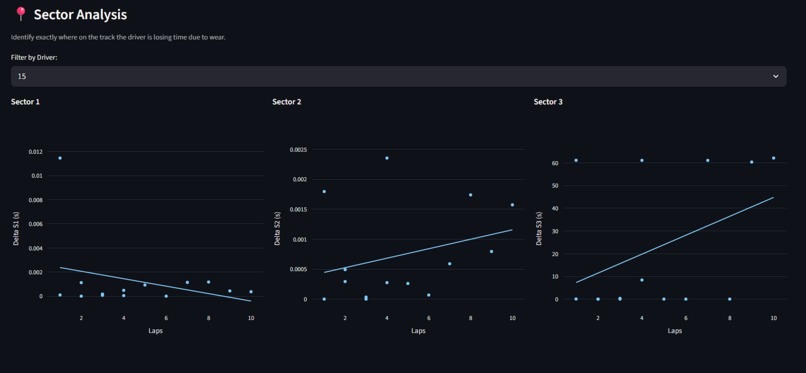
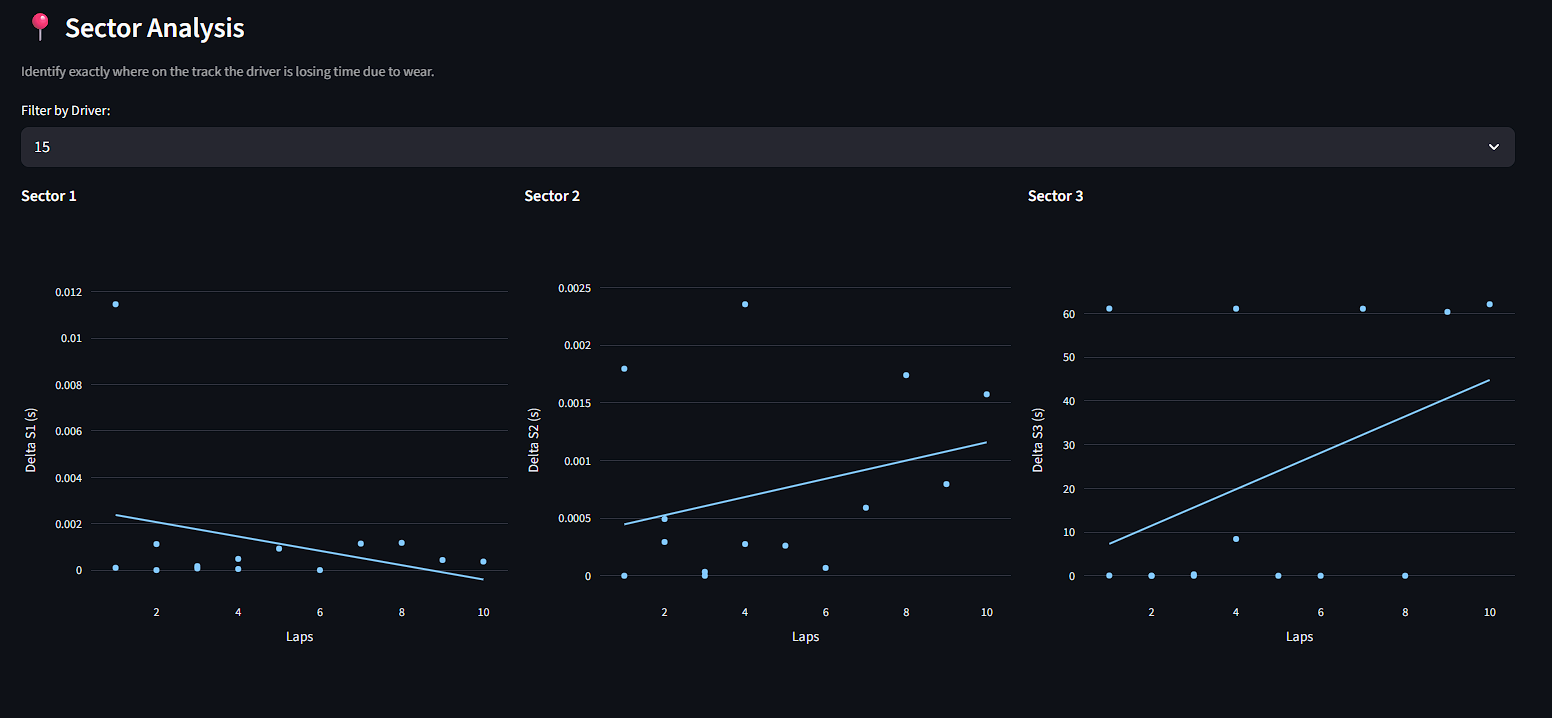
Granular Insights: Analyzing tire wear impact sector-by-sector for Driver #15.
-
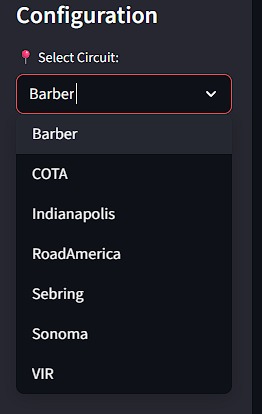
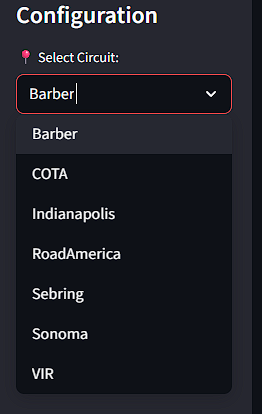
Multi-Track Support: The system loads specific models and calibrations for 7 different circuits.
-

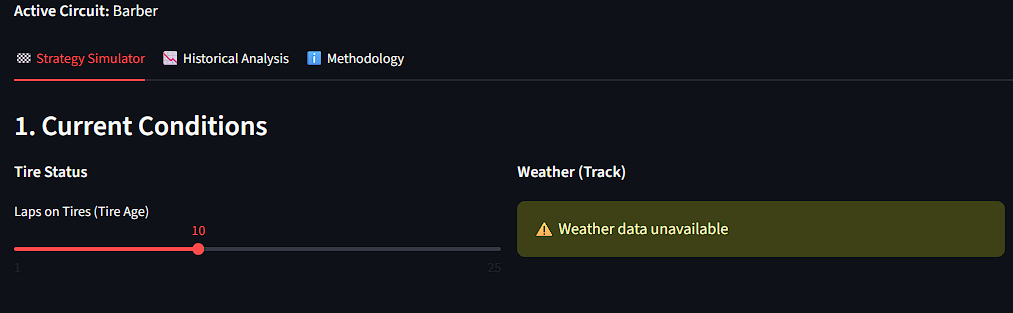
Robust Mode Active: The system detects corrupt weather data at Barber and automatically adapts.
-
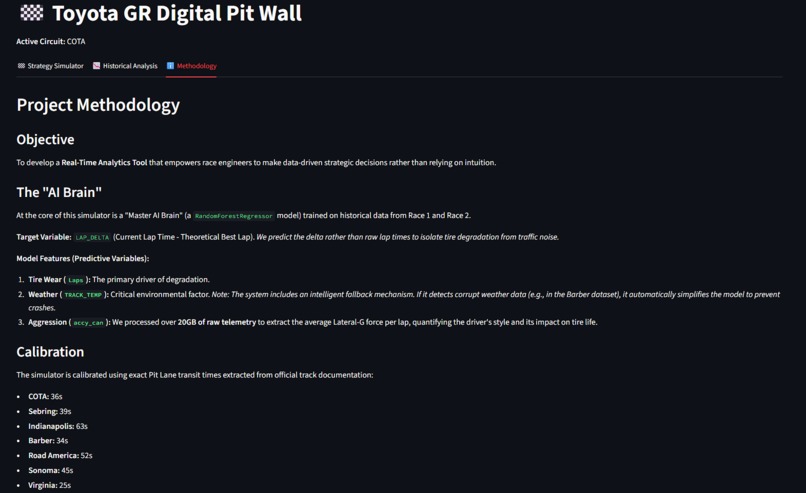
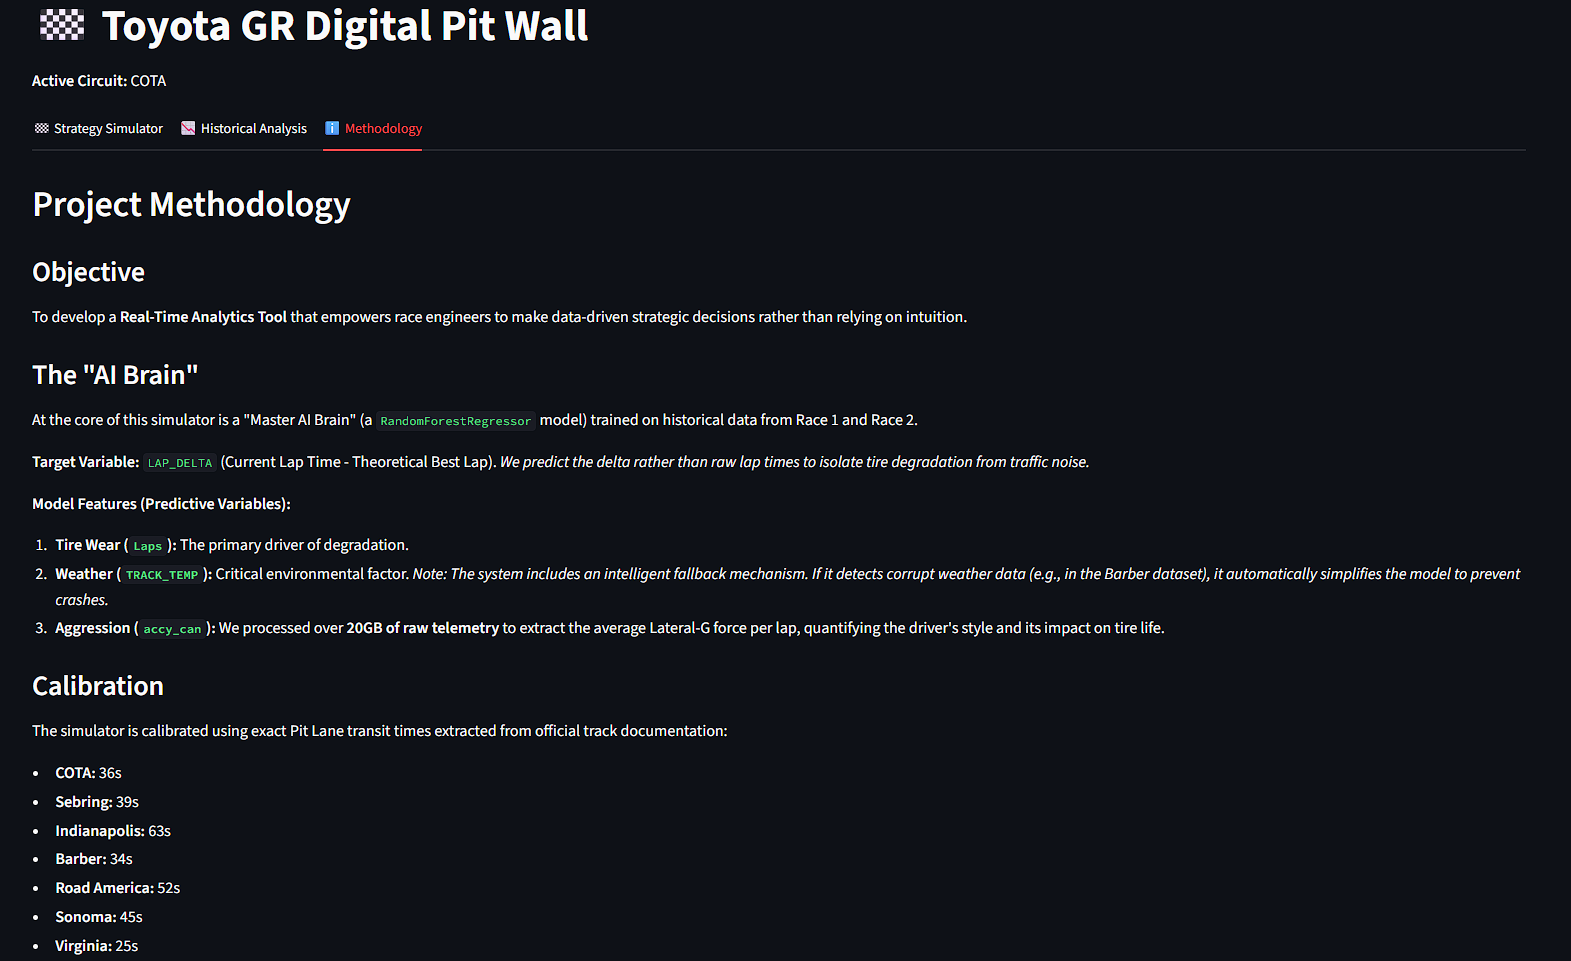
Project Methodology: Explaining the AI model, feature engineering, and calibration logic.

Inspiration
I have always been obsessed with motorsports. From the strategic precision of Formula 1 to the raw adaptability of Rally, I’ve grown up fascinated not just by the drivers, but by the invisible decisions made on the pit wall.
Watching races, I often found myself shouting at the screen: "Box now! The undercut is open!" or "Stay out, the rain is passing!". I realized that victory isn't just about speed; it's about data-driven timing.
When I saw the Hack the Track challenge, I knew I didn't just want to visualize past data. I wanted to build the tool I always wished I had: a system that predicts the future of the race and answers the ultimate question: "What do we do NOW?"
What it does
The Digital Pit Wall is a real-time strategy simulator for the Toyota GR Cup. It uses Machine Learning to predict tire degradation and simulates critical race scenarios.
It allows a Race Engineer to:
- Predict Lap Delta: Forecast exactly how much time a driver will lose per lap due to tire wear and track conditions.
- Simulate "What-If" Scenarios: Instantly calculate the outcome of pitting under a Caution Flag vs. Green Flag.
- Calculate Undercuts: Simulate a 3-lap battle with a rival to see if an early pit stop will gain track position.
How we built it
We built a robust ETL (Extract, Transform, Load) and ML pipeline using Python.
- Data Processing (The Heavy Lifting): We processed over 20GB of raw data using
pandas. This involved merging race timing loops with high-frequency telemetry data. - Feature Engineering: We didn't just use the raw data. We engineered a custom metric called "Driver Aggression" by analyzing the Lateral-G forces from the telemetry files.
- Machine Learning: We trained seven track-specific Random Forest Regressors (
scikit-learn). - The Frontend: We built an interactive, low-latency dashboard using Streamlit, calibrated with specific pit-lane transit times for each track.
The Math behind the Model
Unlike standard tools that try to predict a raw lap time (which is noisy due to traffic), our model predicts the Lap Delta $$\Delta t$$
This isolates the pure physical degradation of the tire.
The core prediction function can be described as:
$$ \Delta t_{pred} = f(L_n, T_{track}, A_{driver}) $$
Where:
Wear ($$L_n$$): Cumulative laps on the current set.
Temp ($$T_{track}$$): Track surface temperature.
Aggression ($$A_{driver}$$): A derived metric from the telemetry sensors, specifically the mean absolute Lateral-G force:
$$ A_{driver} = \frac{1}{N} \sum_{i=1}^{N} |G_{lat}^{(i)}| $$
This allows the model to adapt: a driver pushing hard ($$High\ G$$) will degrade tires faster than a driver conserving rubber.
Challenges we ran into
This project was a massive data engineering challenge.
- The "Time Travel" Bug: When processing the 2.5GB telemetry files, we found that the ECU timestamps were often set to dates before the actual race (e.g., Thursday practice vs. Saturday race). We had to reverse-engineer the synchronization using the
meta_timeheaders to align telemetry with lap times. - Data Corruption: We discovered that the weather sensor data for Barber Motorsports Park was corrupt (reading
0.0°C). A standard model would have failed. We built a fault-tolerant system that detects this anomaly and automatically swaps to a simplified 2-feature model for that specific track. - Inconsistent Formats: Some telemetry files were in
LONGformat, while others (like Sebring R2) were nestedJSON. We wrote a polymorphic parser to handle both structures dynamically.
Accomplishments that we're proud of
- Successfully processing and merging 14 different races worth of data.
- Building a "Robust Mode" that prevents the app from crashing even when input data is missing or corrupt.
- Achieving a prediction error (MAE) of less than 0.5 seconds on the COTA dataset.
What's next for Digital Pit Wall
We plan to implement a GPS-based traffic predictor. By calculating the position of all cars on track, we could add a "Traffic Penalty" variable to our simulation, making the Undercut calculator even more precise in heavy traffic.
Built With
- data-science
- joblib
- machine-learning
- numpy
- pandas
- plotly
- python
- scikit-learn
- streamlit


Log in or sign up for Devpost to join the conversation.