-
-
Databricks app
Inspiration
What it does
How I built it
Inspiration
Season stats flatten football. A 3rd-and-short at your own 20 is a different game than a 3rd-and-short at the opponent's 30, but a box score treats them the same. I wanted to see where on the field Wisconsin runs, succeeds and breaks big plays, and let anyone question the data in plain English instead of writing SQL.
What it does
Dig Into the Badgers turns five seasons (2021-2025) of Wisconsin play-by-play, about 10,500 plays, into:
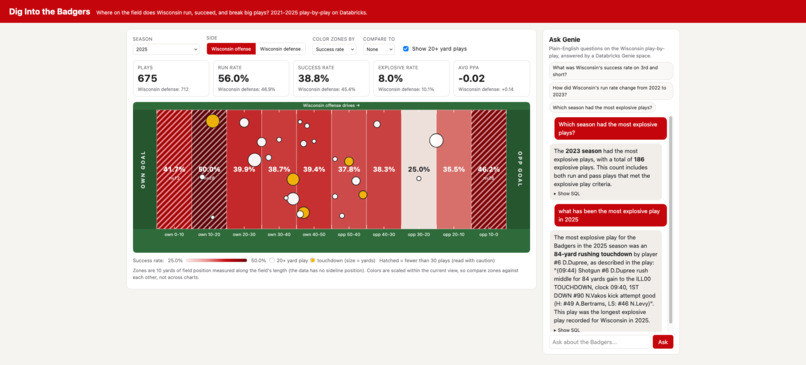
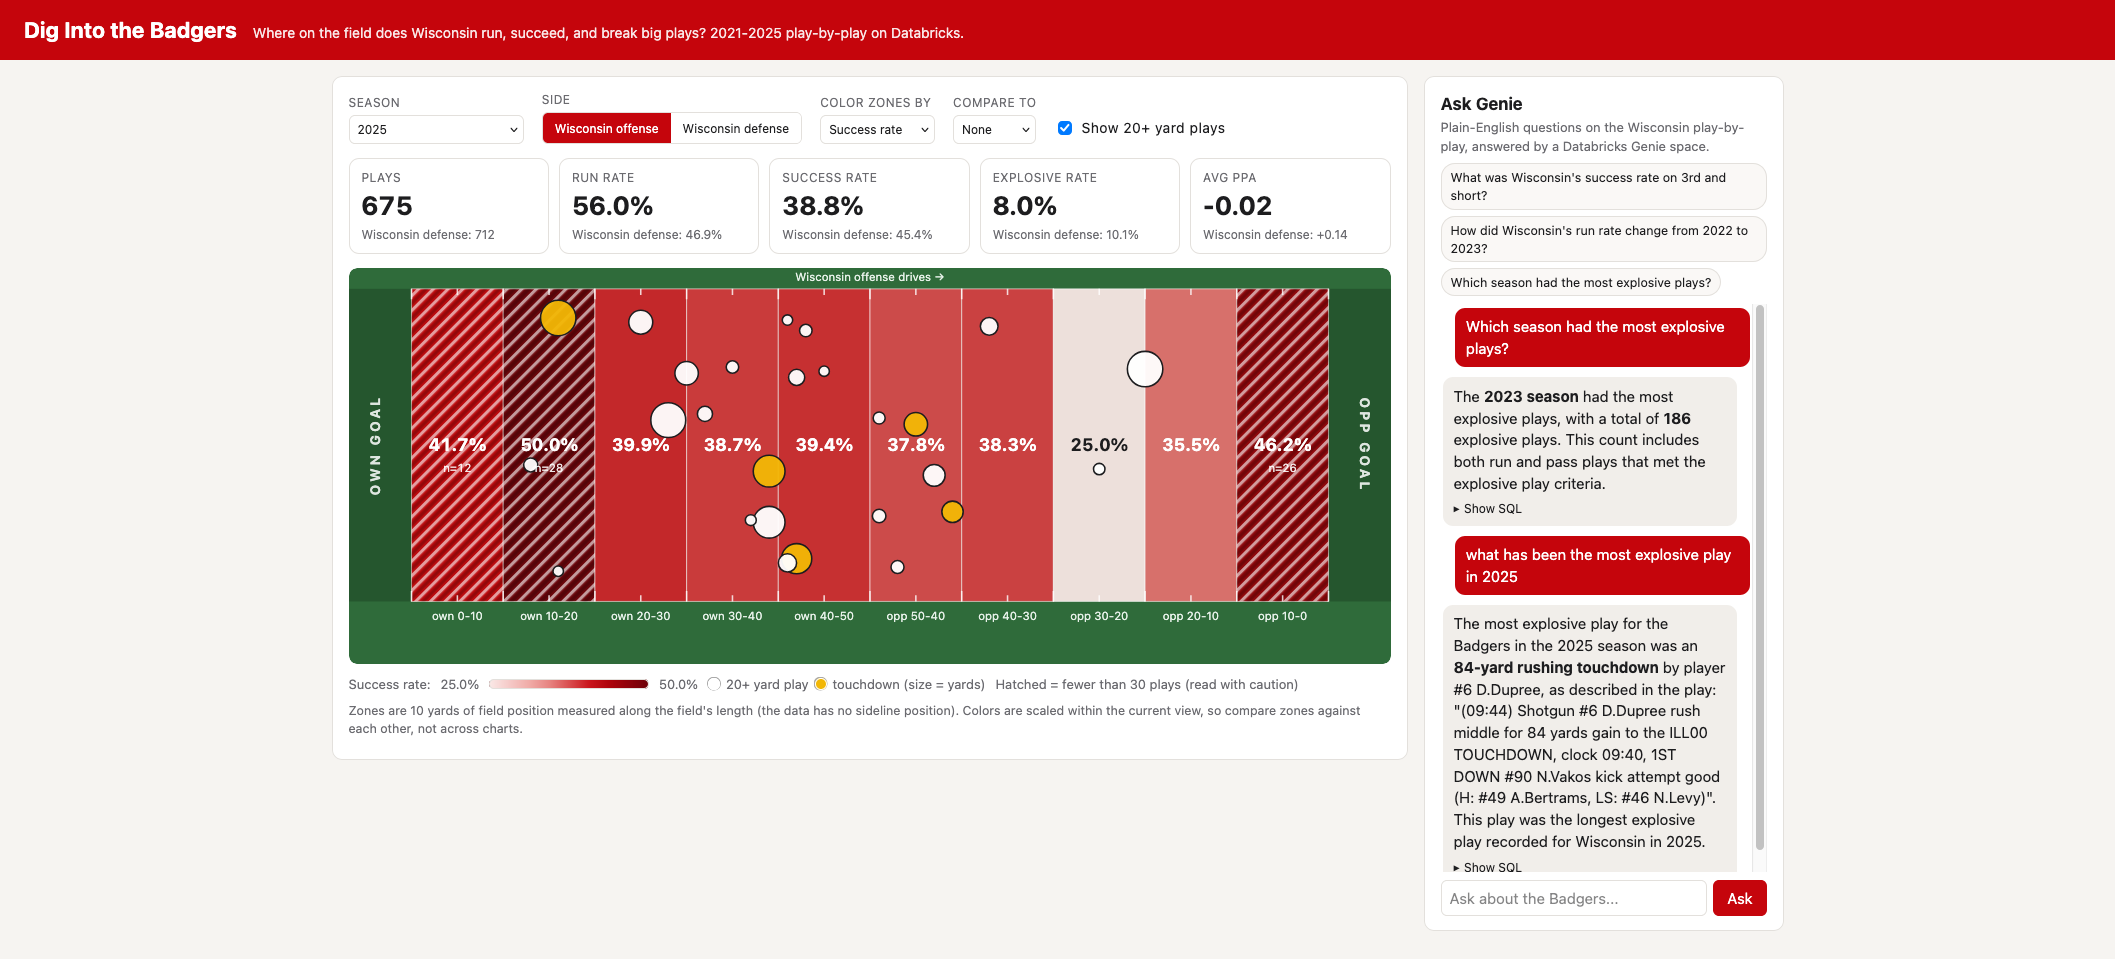
- A live Databricks App that draws the field in 10-yard zones, colored by run rate, success rate, explosive rate, plays or predicted points added. You can switch season, offense or defense, compare two seasons zone by zone, and plot the biggest 20+ yard plays on the field. Zones with fewer than 30 plays are hatched as low-sample.
- An "Ask Genie" panel backed by a Databricks Genie space. Ask "What was Wisconsin's success rate on 3rd and short?" and get the answer (62.8% on 239 plays) with the SQL behind it.
- An AI/BI dashboard with the season-level story.
How I built it
- Bronze: pulled play-by-play from the College Football Data (CFBD) API into a raw Unity Catalog table.
- Silver: cleaned it into one table with flags for run/pass, touchdowns, success (50% of yards needed on 1st down, 70% on 2nd, 100% on 3rd/4th), explosive plays (10+ yard runs, 20+ yard passes), short yardage and red zone.
- Gold: aggregated tables, including one by season, side and 10-yard field zone.
- Serving: a FastAPI app on Databricks Apps reads the gold table through a SQL warehouse and calls the Genie Conversations API. The frontend is a single static page with an SVG field. The Genie space has custom instructions, measures and benchmark questions I checked against hand-computed numbers.
The app's backend structure follows Databricks' reference community app; all the code is my own.
Challenges
- Trusting the numbers. I reconciled table counts against independent totals (for example, 846 offensive run/pass plays in 2021 and 137 red-zone plays) and spot-checked the big plays against game film. They matched.
- Small samples. Single-season zones can have a dozen plays, so I added hatching and play counts instead of letting a noisy percentage look like a finding.
- Missing location data. The data has yard line but no sideline position, so the field view only maps length. I labeled that limitation instead of faking the other dimension.
- Databricks permissions. My first deploy crashed on empty files, and then the app's service principal had no access to the schema. Learning how Unity Catalog grants work for an app identity was the biggest new thing for me.
What I learned
This was my first time on Databricks. I learned how a bronze, silver and gold pipeline fits together in Unity Catalog, how a Genie space is shaped by instructions and benchmarks, how Databricks Apps authenticate with a service principal, and that the number you show matters less than how clearly you show what it rests on.
What's next
Sideline location and formation data, which this dataset doesn't include, so we could see not only where plays happen but how they're run.
Data
Play-by-play from the College Football Data API.
Note on Github
Pivoted from dashboard to in app hosted by databricks. Github repo mostly hosts information on the college football data API
Built With
- databricks
- sql
