Inspiration
I'm interested in data analysis and new ways of exploring datasets. With recent national discussions about healthcare and subsequently the price of healthcare, I decided to explore what information is out there about this topic.
What it does
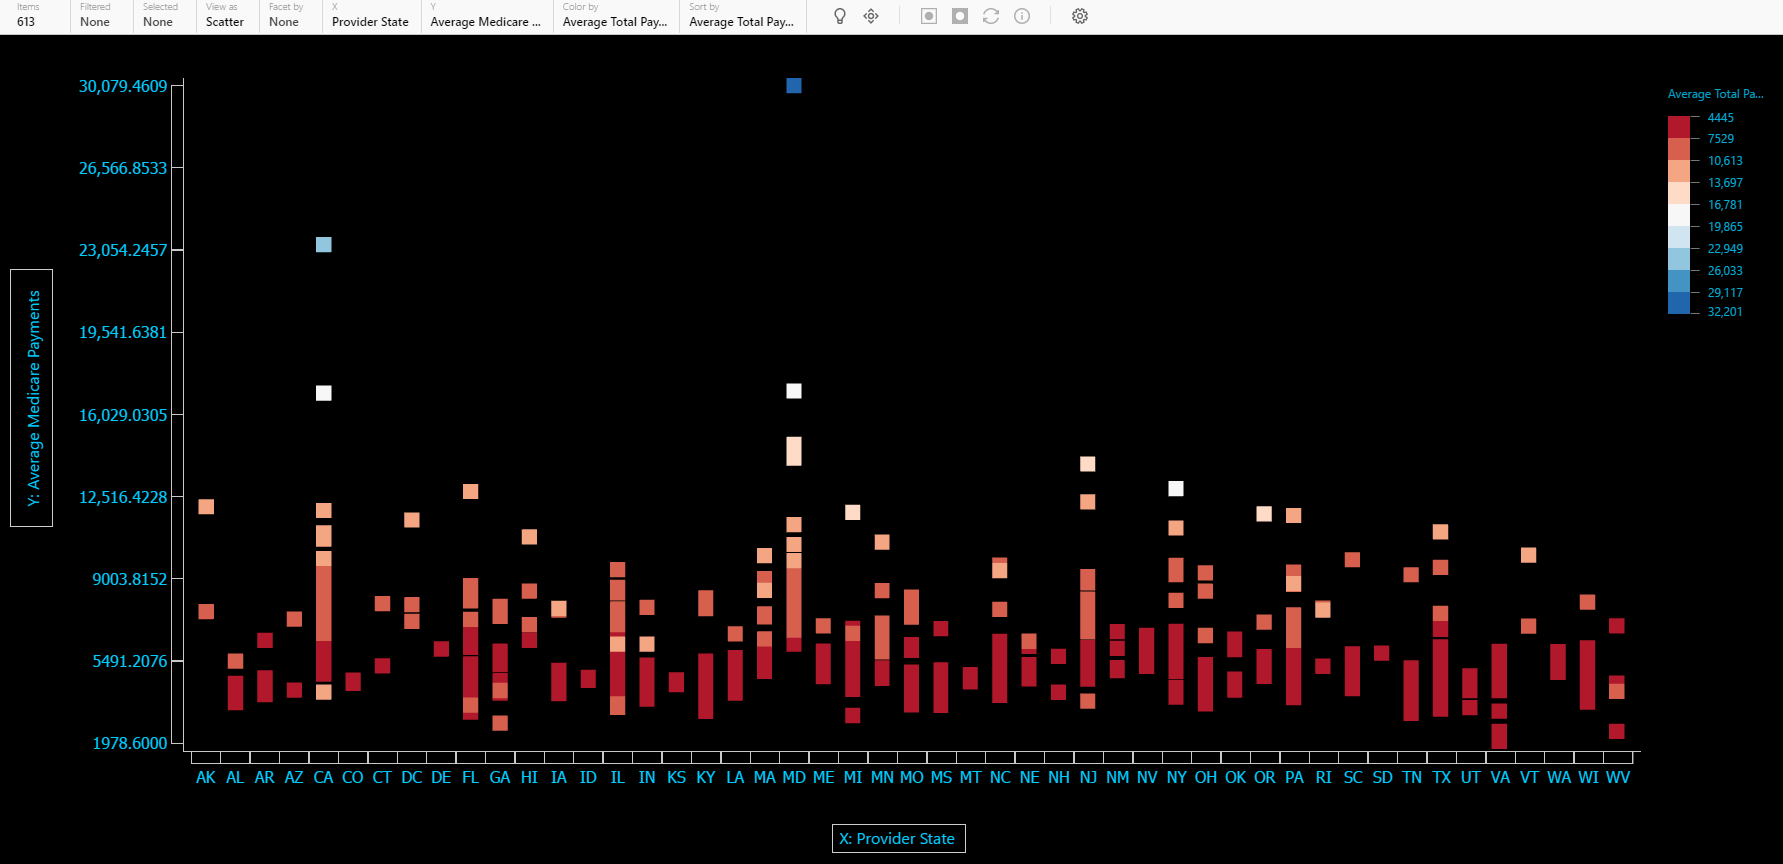
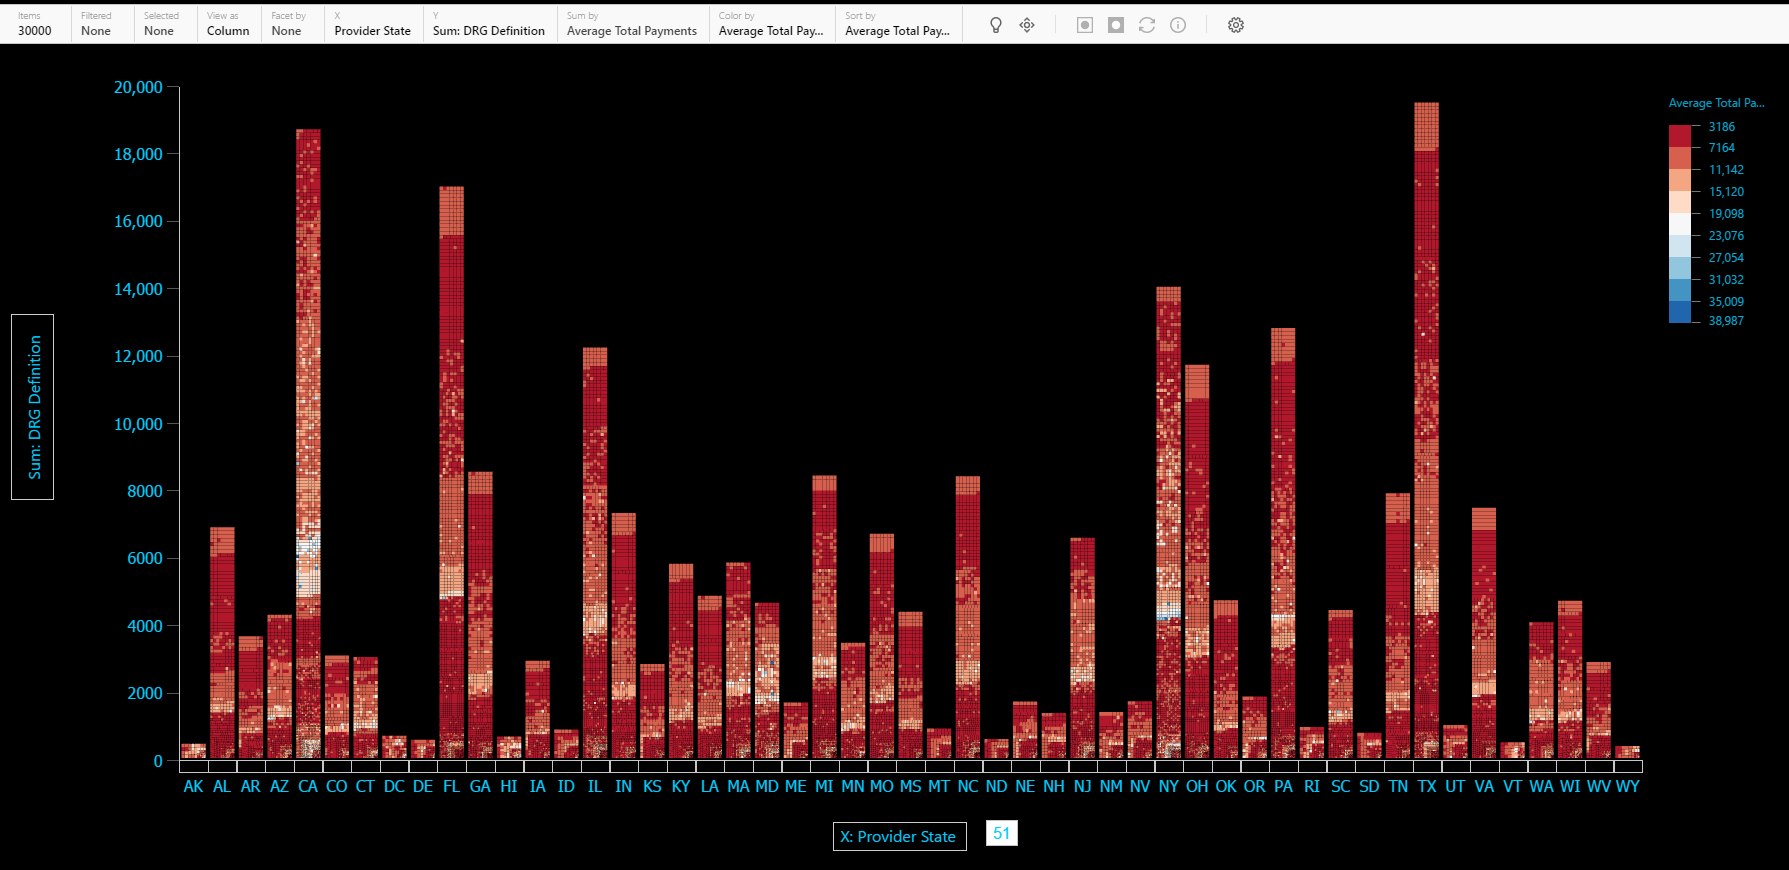
Using Microsoft Sanddance, I analyse the varying prices per medical provider (categorized by DRG) by location. Sanddance provides a nice animation feature which allows one to see "movement" in data.
How I built it
I downloaded data from data.gov (https://data.cms.gov/Medicare-Inpatient/Inpatient-Prospective-Payment-System-IPPS-Provider/97k6-zzx3) and imported it into Microsoft PowerBI for analysis. I created visualizations to capture a "snapshot" of the observed data.
Challenges I ran into
Finding nifty patterns and trends in data. Much of the time was spent sifting, then cleaning up data.
Accomplishments that I'm proud of
Nothing yet.
What I learned
I learned to better use Microsoft PowerBI and Sanddance in projects.
Built With
- data.gov
- microsoft-powerbi
- microsoft-sanddance


Log in or sign up for Devpost to join the conversation.