-
-

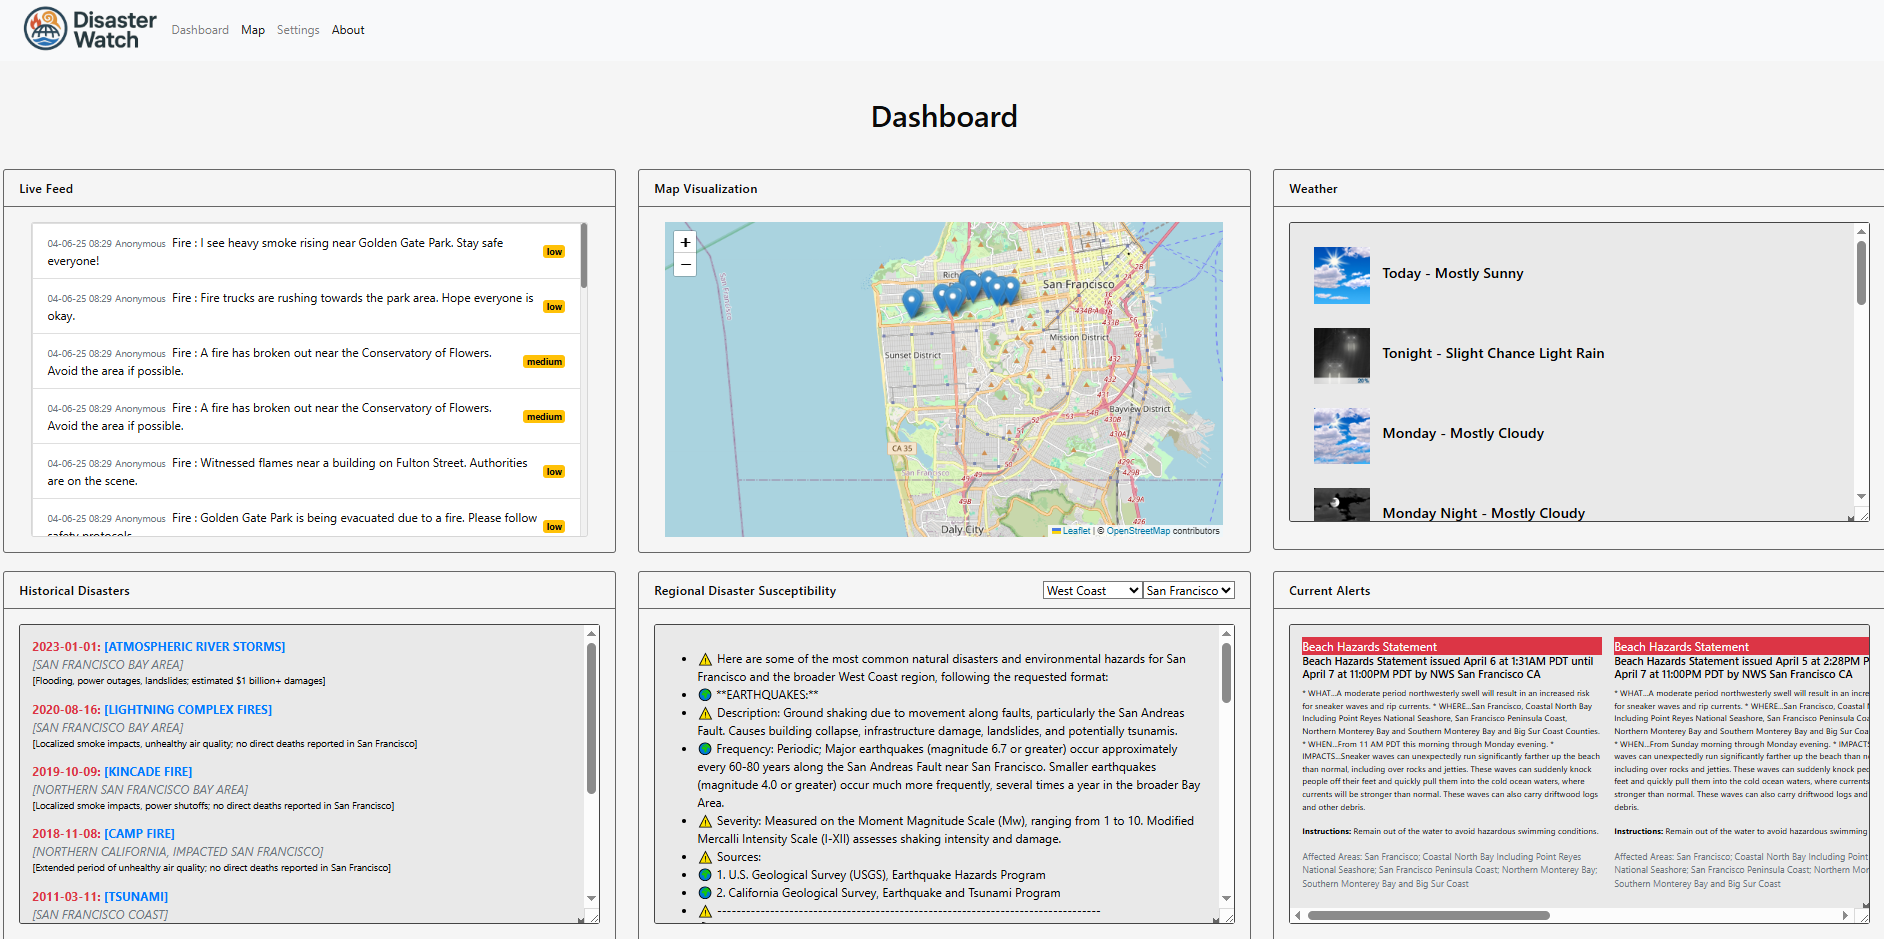
Dashboard
-

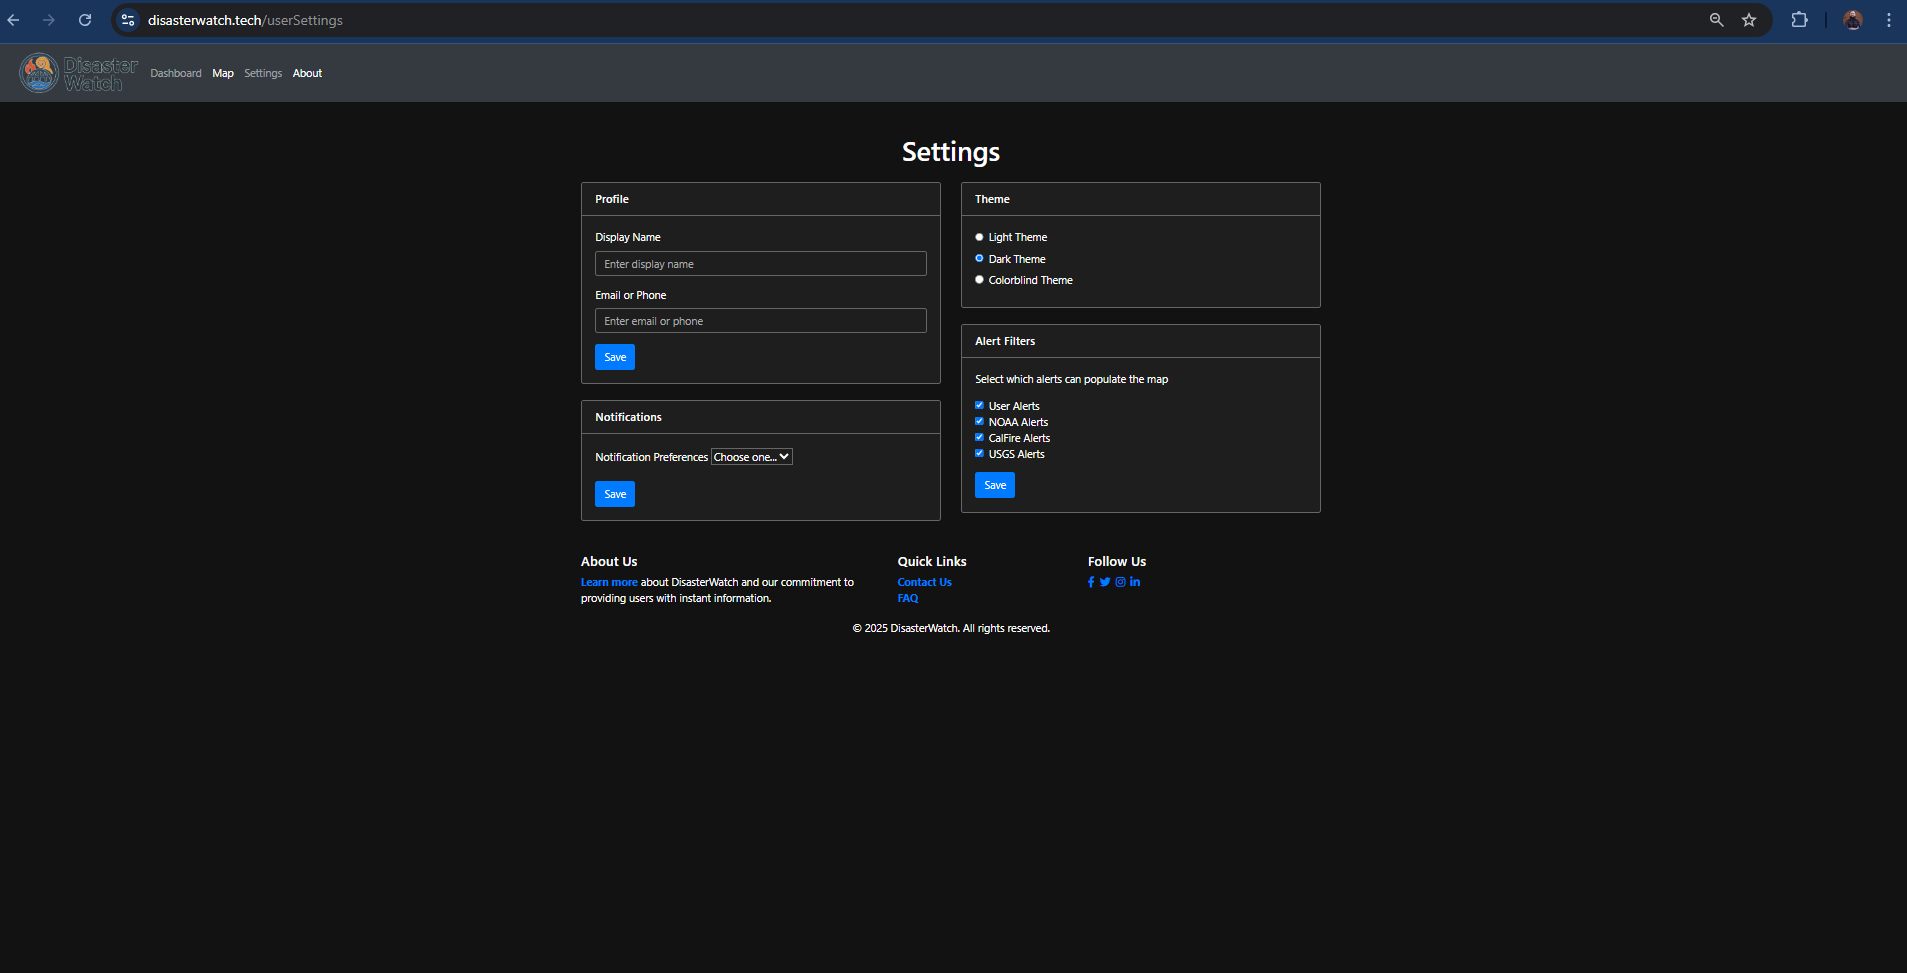
Settings (color blind)
-
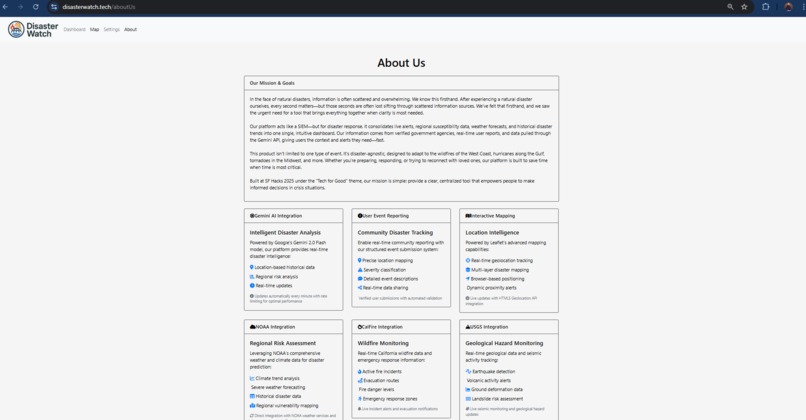
About Us
-
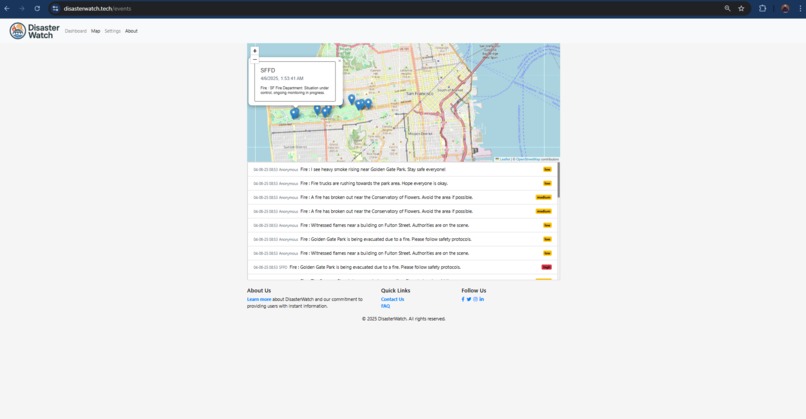
Map

Inspiration
During a disaster is can be hard to get reliable, centralized information. Alerts and updates are often split between multiple different government agencies, social media, and news outlets—making it confusing and time-consuming for people to stay informed. One of our teammates, Will, experienced this first-hand during the Santa Rosa wildfires and knows how disorienting that chaos can be.
We wanted to build something that bridges the information gap during emergencies. Our goal was to create a tool that visualizes disaster data clearly and immediately—something you could pull up in seconds to understand what's happening near you.
We were also inspired by:
Real-time, geo-targeted information during wildfires, floods, and earthquakes on apps like Firewatch and Watch Duty.

The rise of citizen journalism and community-sourced data in emergencies.

The success of fire alert Twitter bots and Google Crisis Maps, but with the desire to make something more interactive and locally aware.

The potential of visual storytelling through maps to quickly communicate danger zones, forecasts, and community updates.
Ultimately, we wanted to create a dashboard that doesn't just inform—it empowers people to make decisions faster and safer during a crisis.
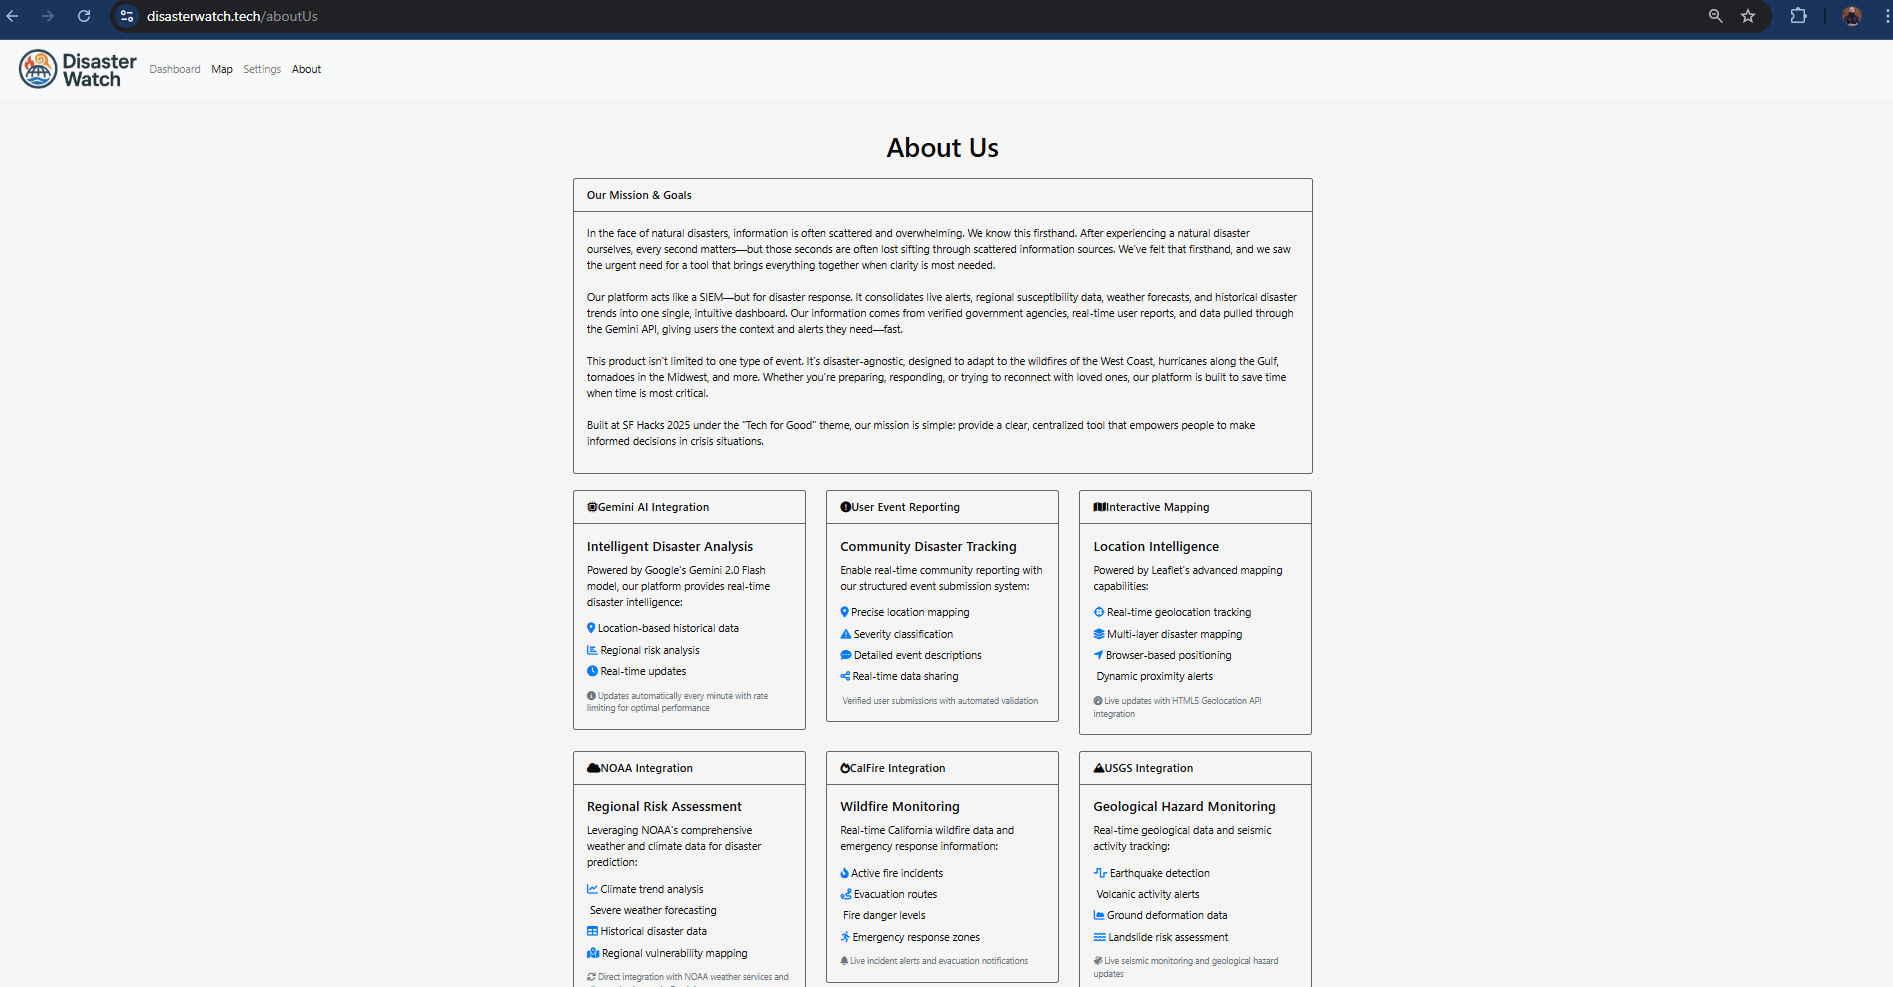
What it does
We built a dashboard with a map focused on the city of the user. It aggregates alert information from a database and converts it into pins on the map. It also adds shaded region to simulate a growing fire. There are other components in the dashboard that show historical disasters, susceptibility to certain disaster types in your area, and a weather forecast.
How we built it
Bootstrap for frontend, Express for backend, leaflet.js for map, Postgres for the database, hosted on Render, got our domain name ControlPanel.tech
Challenges we ran into
- Version control when multiple people work on one file, Talk about weather (Eric), originally we wanted to set up cloudflare on our project but we ultimately had to abandon the idea.
- Organizing tasks, and working together and apart while trying not to lose time.
- Relying on teammates that have more experience that kind of took on sole direction of certain components.
Accomplishments that we're proud of
"I'm really proud to have contributed to and shipped a project with such a large scope in such a short time period." - John "For me, hosting a new project online, and then registering a domain and altering the CNAME and A record to allow DNS to point to our purchased domain name of disasterwatch.tech, that was all new for me. Also, integrating Gemini's API's for multiple parts of our project, the formatting and prompting that needed to be tweaked to get the right output was new for me" - Will
What we learned
- Version control - keeping stuff up to date and being more coordinated when working on the same file.
- Be aware of CORS/Javascript issues when reading data from external files.
- We learned the importance to focus on creating a Minimal Viable Product (MVP) first, then add features if time allows. This was crucial given our time constraints. In the end we were able to add features towards the end, but only after we published an MVP.
What's next for Disaster Watch
We used simulated data for our alerts currently. Ideally , we would use API calls and scapers to get real time data, but obviously the feasibility of doing that is limited by the amount of disasters we feel on a day to day basic. We would also love to have a user base that contributes alerts on the map.

Log in or sign up for Devpost to join the conversation.