-
-
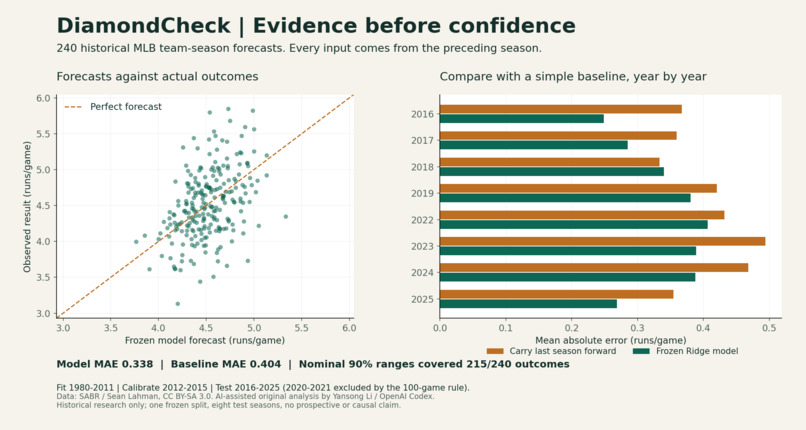
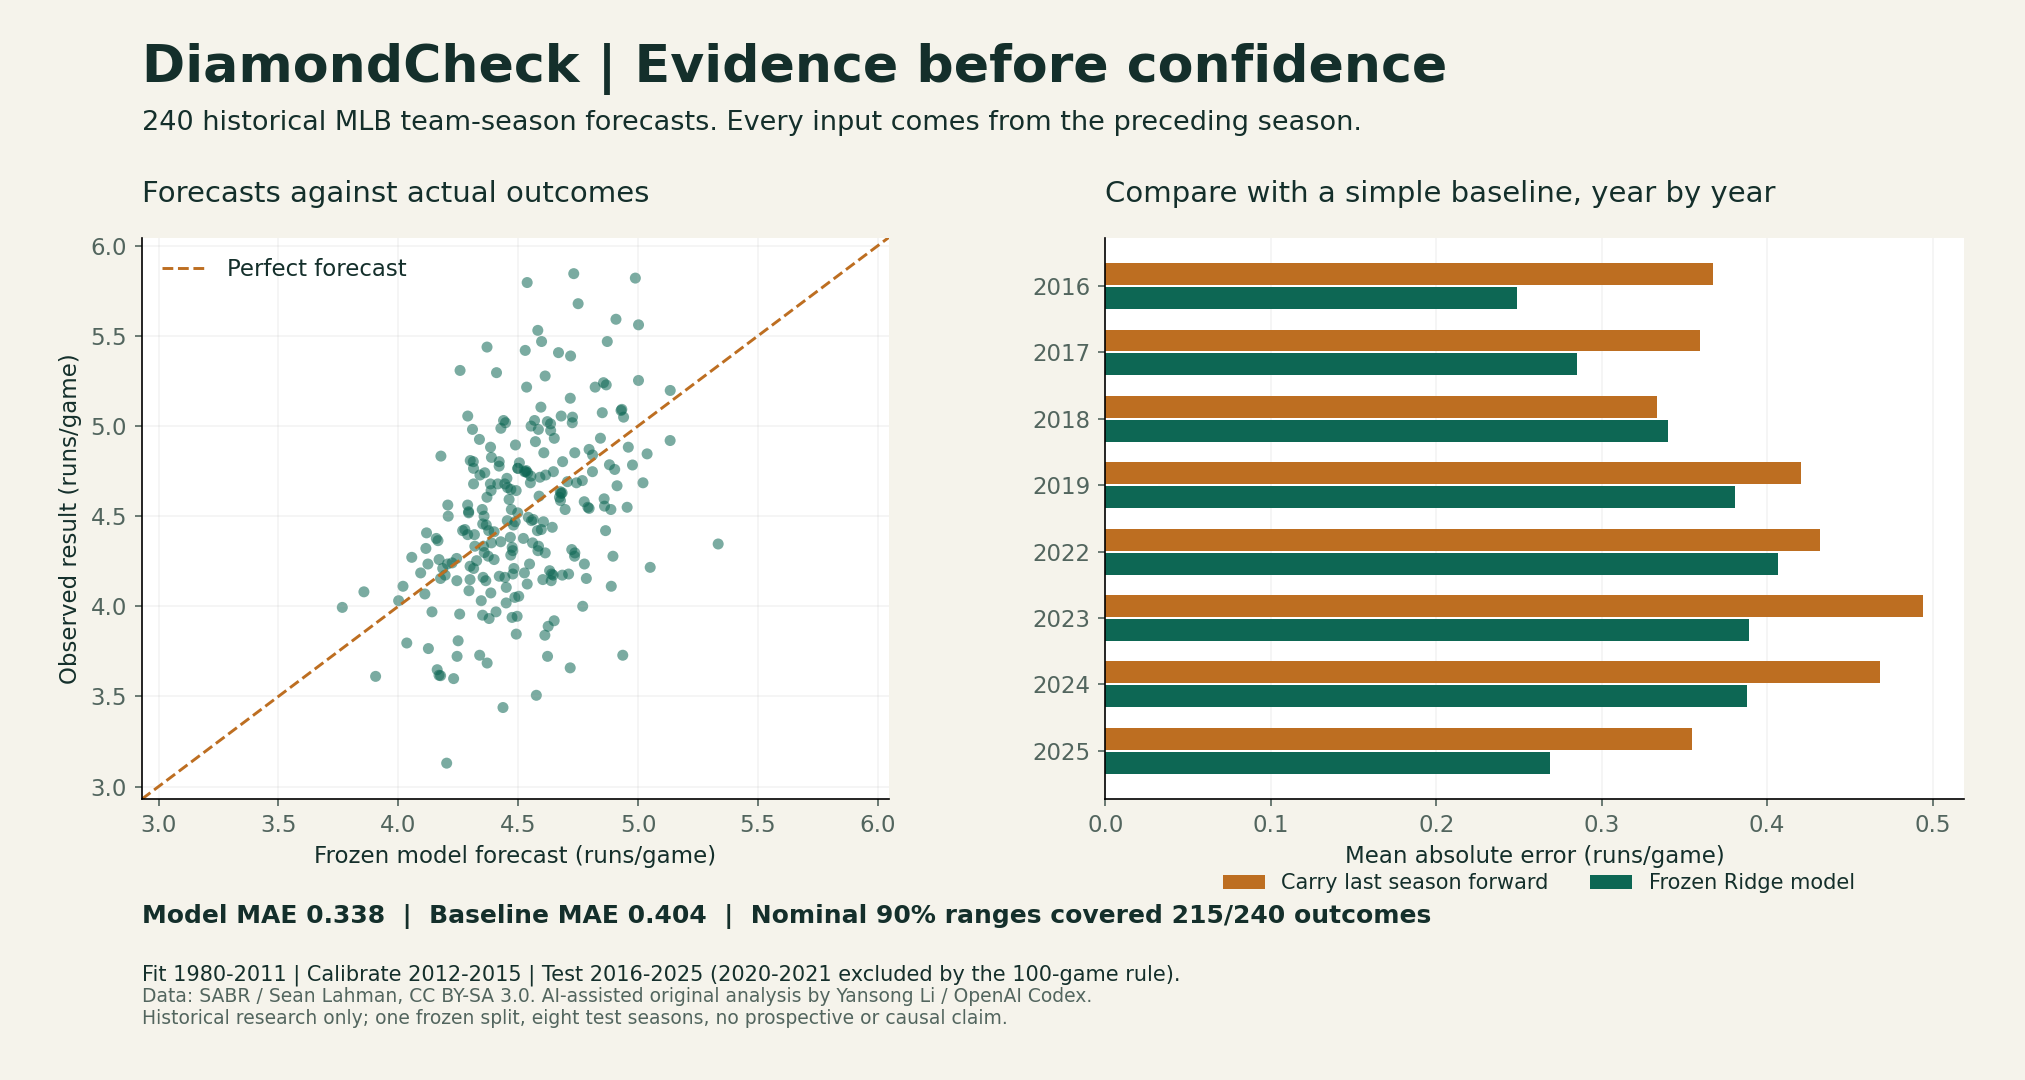
Historical holdout: 240 team-seasons; model MAE 0.3383 vs baseline 0.4036 runs/game. Nominal 90% range covered 215/240.
Inspiration
A plausible forecast is not enough: does it beat carrying last season forward? DiamondCheck makes this question inspectable for analysts reviewing MLB team scoring expectations. It combines a transparent baseline, historical evaluation, calibrated ranges and row-level evidence.
What it does
The verified Python prototype predicts next-season team runs per game from the immediately preceding season's statistics. It exports all predictions, coefficients, split rows and an evidence figure. A review command lets judges select a recorded season and franchise:
python review.py --year 2025 --team NYY
For that example, it displays a model forecast of 4.8562, a carry-forward baseline of 5.0309, a nominal 90% range of [4.1592, 5.5531], and the historical outcome of 5.2407 runs/game. The baseline wins this example, making a model failure visible rather than hiding it.
The optional standalone HTML report includes team/season selectors, a largest-miss table and CSV export. Its JavaScript passed syntax checks, but browser interaction checks were blocked by local-file navigation policy. The verified command-line prototype is the demonstrated core; the HTML interaction is not claimed as browser-verified. No live hosted application is provided.
How it was built
The data is the SABR/Sean Lahman team database through 2025, obtained through a pinned Mycelium mirror. The repository retains exact URLs, hashes, the unchanged official SABR README and license notices. Mirror CSV identity against the official Box CSV was not verified.
Franchise IDs join each target season to its exact preceding year. Both seasons require at least 100 games, so 2020 and 2021 are excluded; missing years are never bridged. Six features describe prior scoring, OBP, SLG, walks, strikeouts and league scoring.
A training-only scaler and Ridge(alpha=10) fit on 894 target-season rows from 1980-2011. Calibration uses 120 rows from 2012-2015. The frozen holdout contains 240 team-seasons across eight eligible years in 2016-2025. Features, splits, alpha and bootstrap seed were fixed before the first holdout evaluation, without parameter search.
Measured results
Historical holdout MAE is 0.3383 runs/game, versus 0.4036 for carrying last season forward: a 16.2% relative reduction on this split. Mean improvement is 0.0653 runs/game; a 95% bootstrap interval resampling whole seasons is [0.0371, 0.0911]. Grouping by season avoids pretending all team-season errors are independent.
The nominal 90% calibration range has radius 0.6969 runs/game and covers 215/240 outcomes (89.58%). These are retrospective measurements, not prospective guarantees.
Implementation challenges and validation
The automated build encountered source-data line-ending normalization when publishing to Git. Explicit binary-preservation attributes fixed the CSV hash mismatch; a fresh public clone then reproduced the metrics. An independent scalar audit reconstructs all 240 test and 120 calibration predictions directly from raw CSV values and exported coefficients, checking error metrics, radius and coverage.
Four additional checks passed: target-season runs do not enter that season's features, missing prior years are not bridged, source row order does not change results, and duplicate franchise-season records are rejected.
What the project demonstrates
The result supports a narrow conclusion: this small frozen model improves the selected historical baseline on one split. It does not establish live forecast skill, a causal effect or a professional decision benefit. The CLI example also shows why aggregate gains must not be confused with every prediction being better.
Only eight test seasons, revised historical records, era shifts and correlated teams limit the evidence. Roster changes, injuries and rule changes are omitted. This is not a player valuation, betting strategy or 2026 forecast.
What's next
Prospective evaluation, stronger licensed baselines and analyst usability feedback are proposed next steps, not completed work. The current practical use is baseline comparison and model review before committing to a more complex approach.
AI assistance, originality and credits
Created October 26, 2026 for Yansong Li. OpenAI Codex generated and revised the implementation, analysis, checks, report, presentation and submission prose. No personal development experience or workshop attendance is asserted. All baseball values come from the cited dataset; none are AI-generated. No paid API or external LLM inference was used.
The same October 26 project is used for the AQX Sports Analytics Data Bowl 4.0 and NextSpark Hacks submissions. It has never been entered in an earlier AQX Data Bowl.
Technologies: Python, NumPy, pandas, scikit-learn, Matplotlib, HTML, CSS and JavaScript. Original software: MIT. SABR/Sean Lahman source data and derived analysis/report: CC BY-SA 3.0; Mycelium mirror attribution and all notices are included.
Public source and setup: https://github.com/C12isme945/diamondcheck

Log in or sign up for Devpost to join the conversation.