-
-
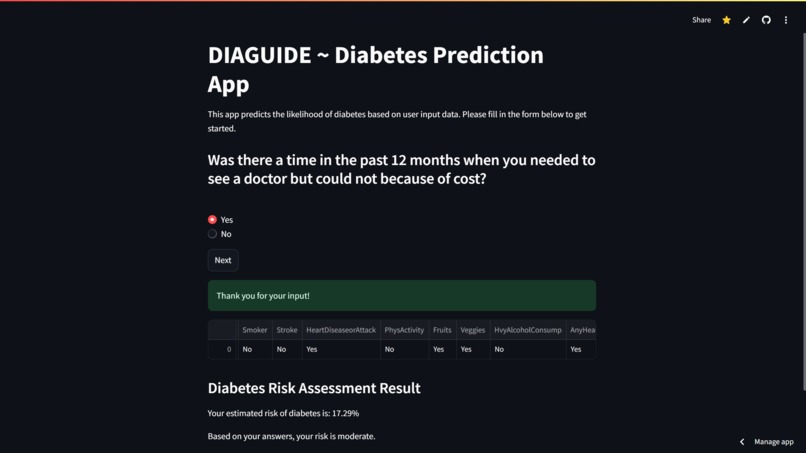
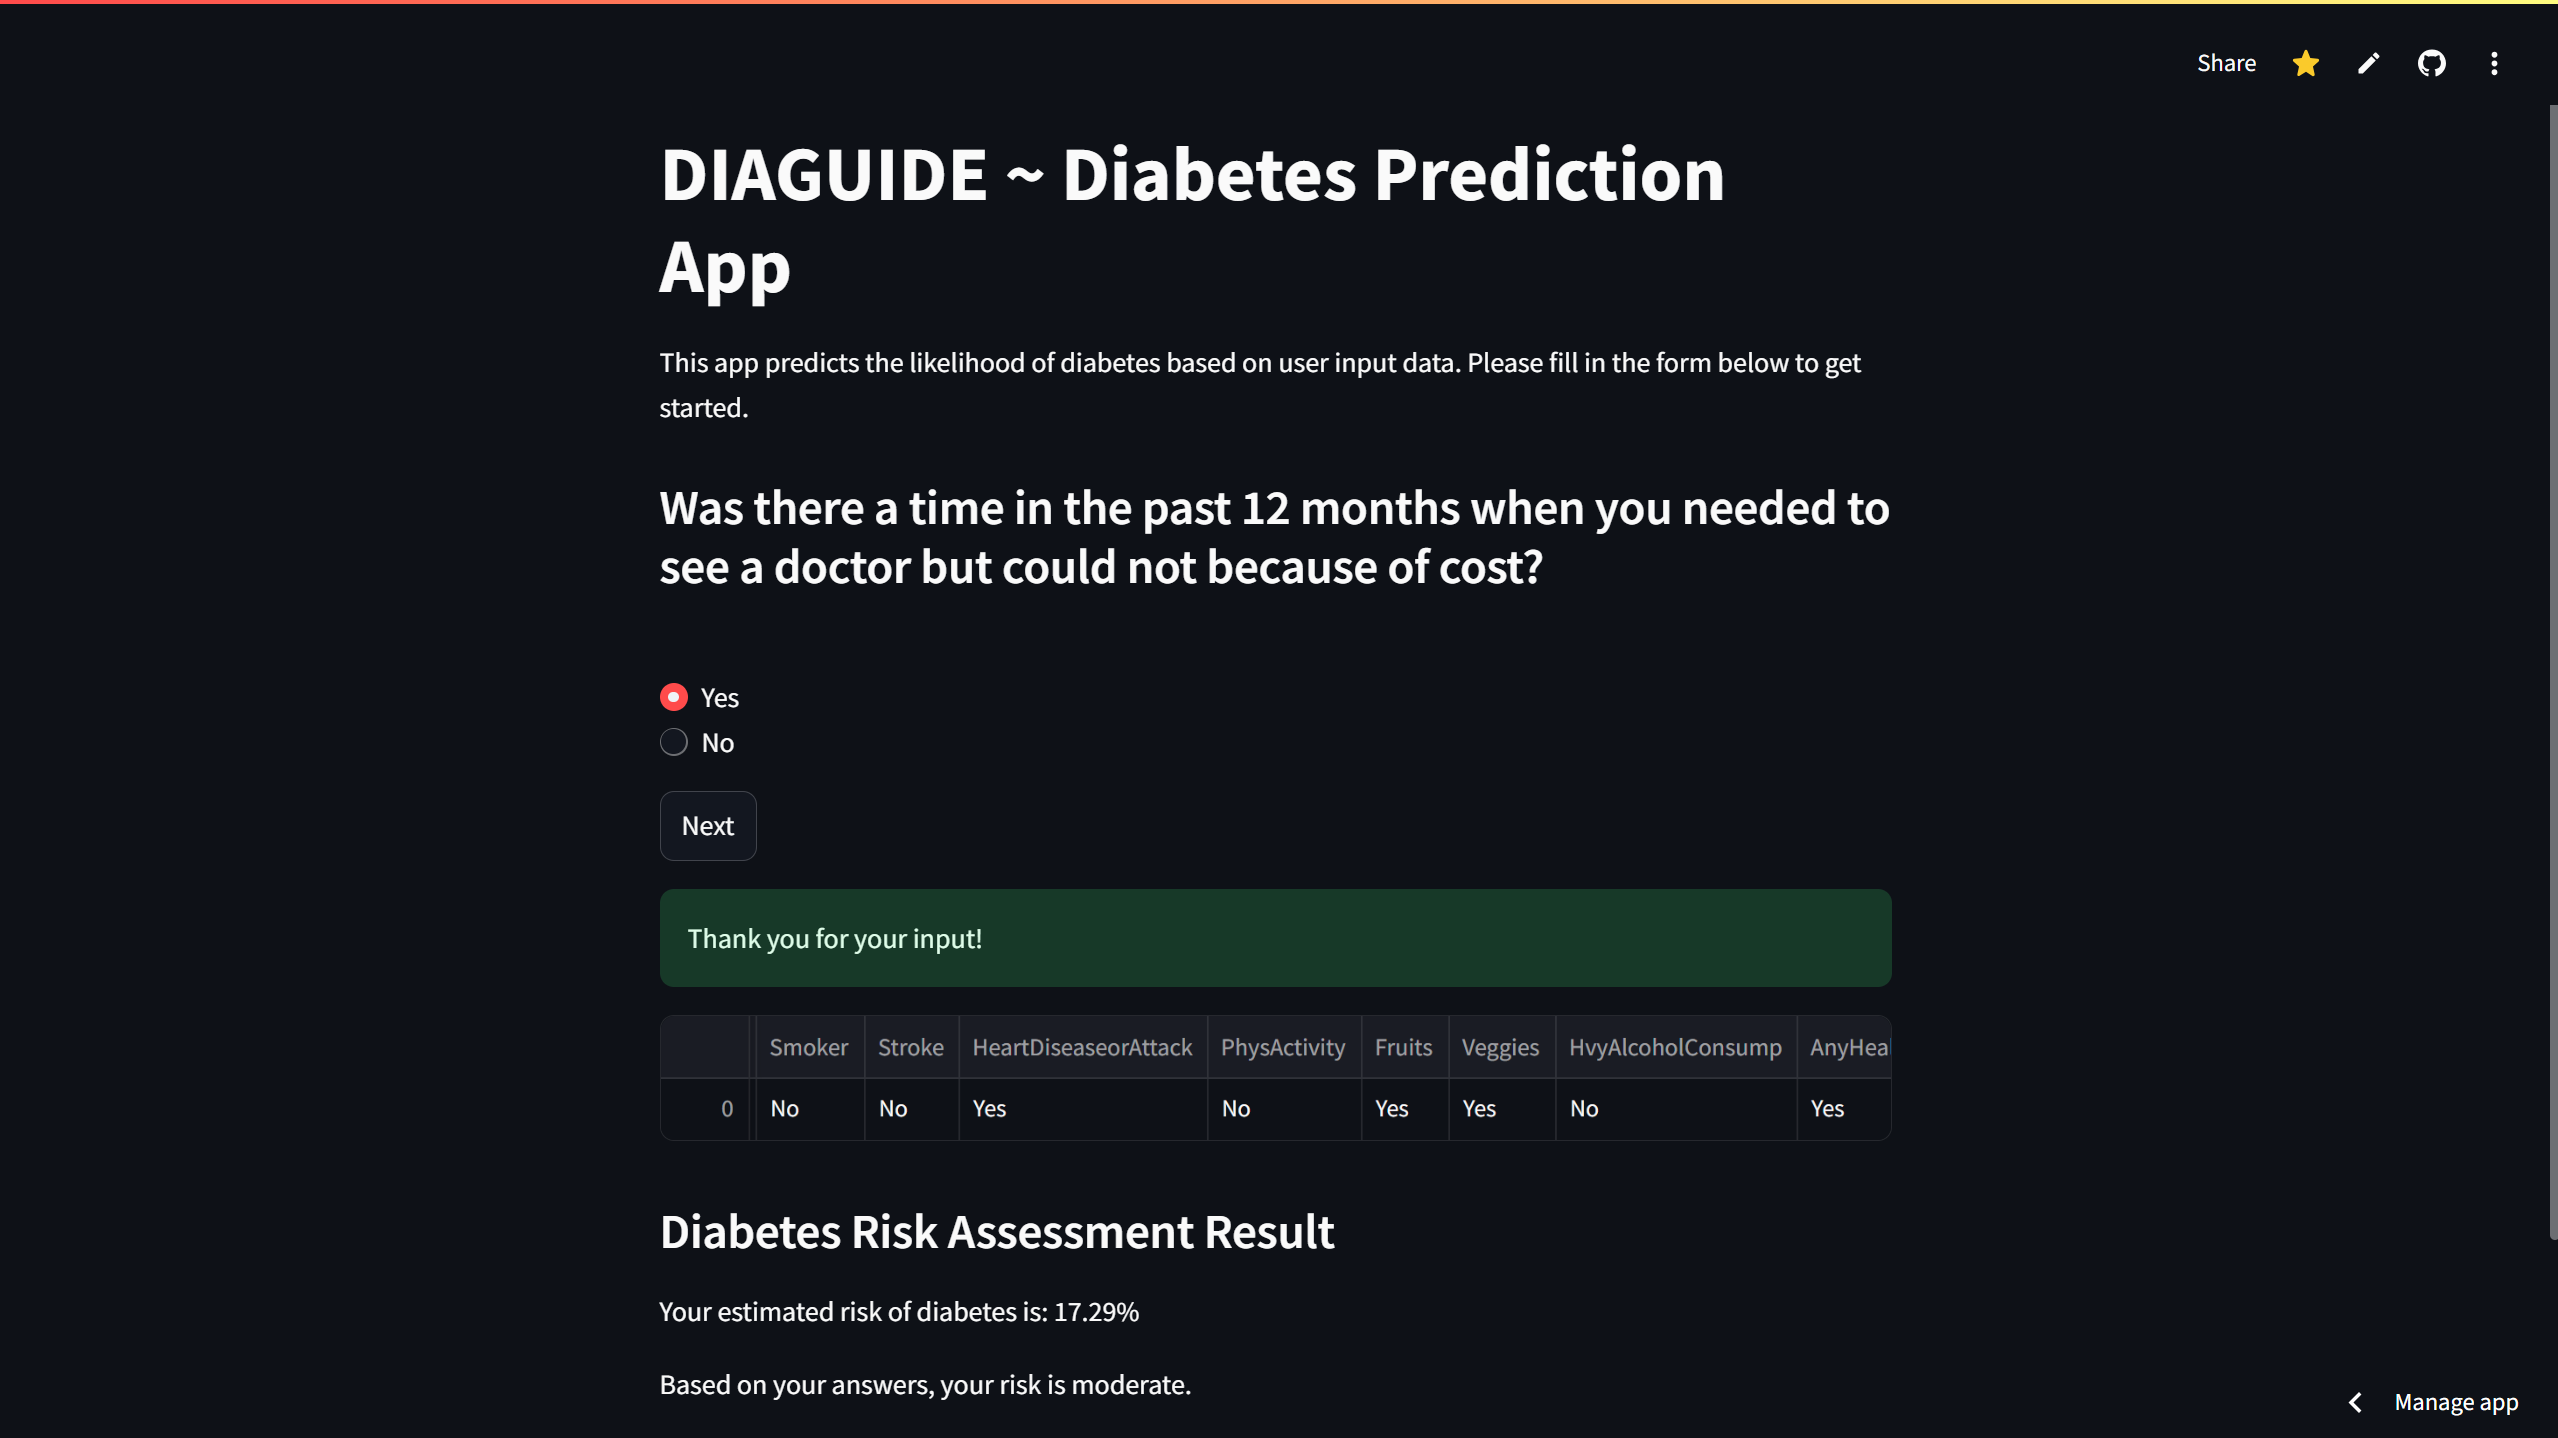
App Screenshot
-
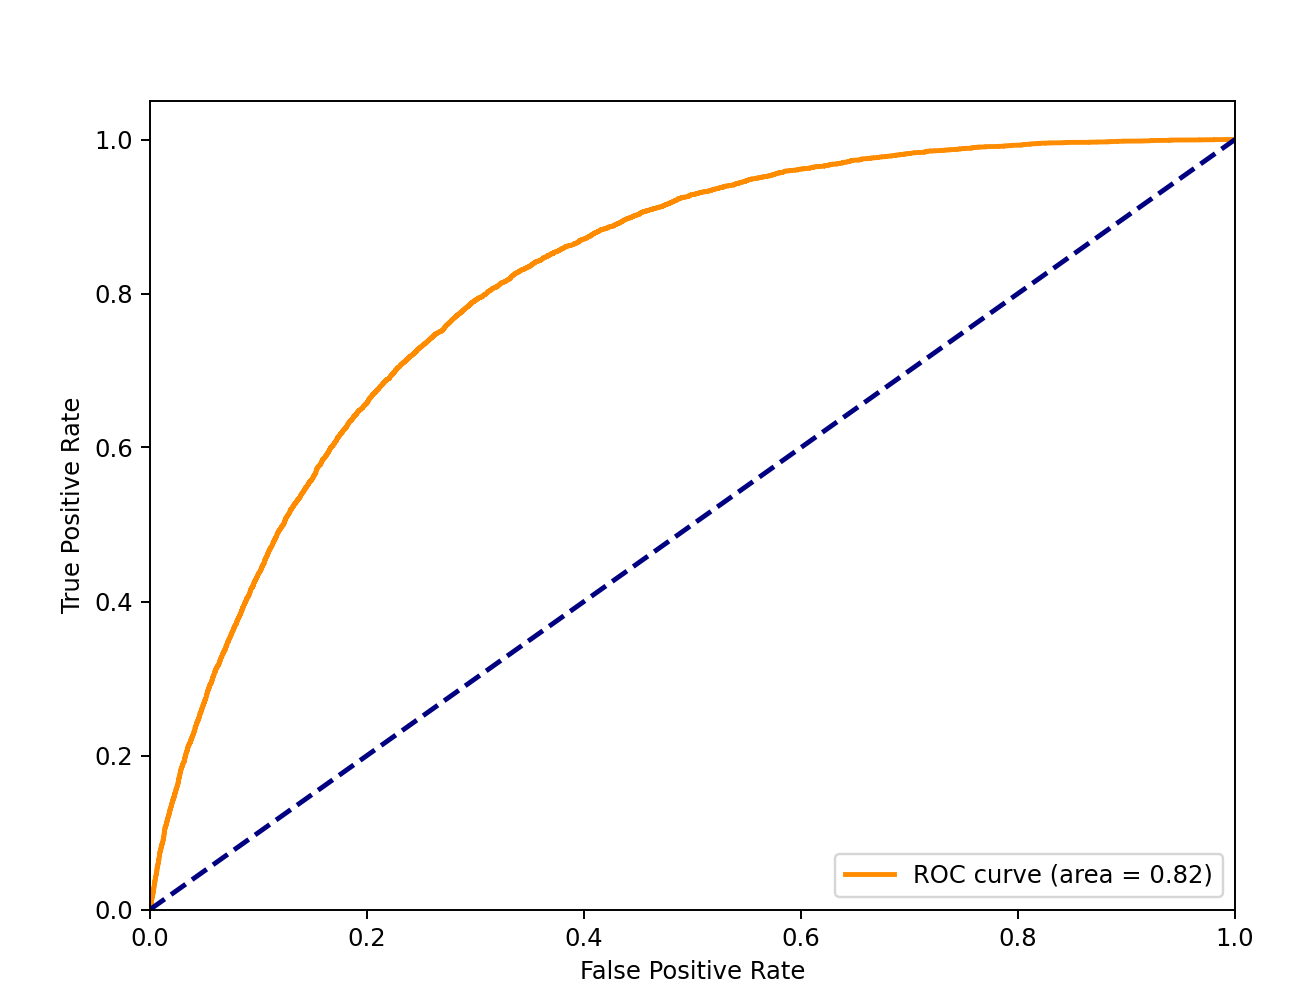
Logistic Regression (current) ROG graph
-

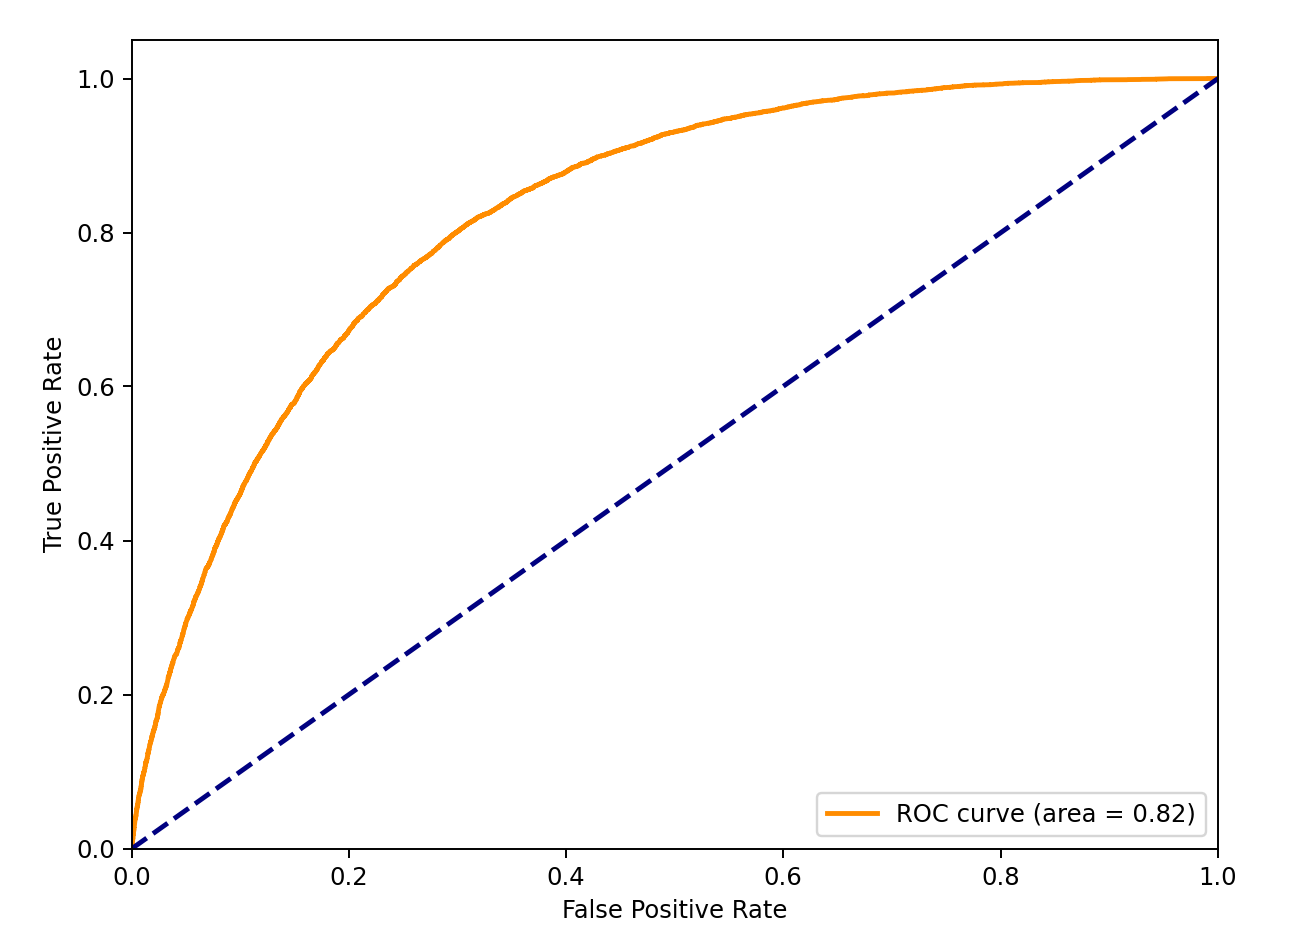
Gradient Boosting ROG graph
-
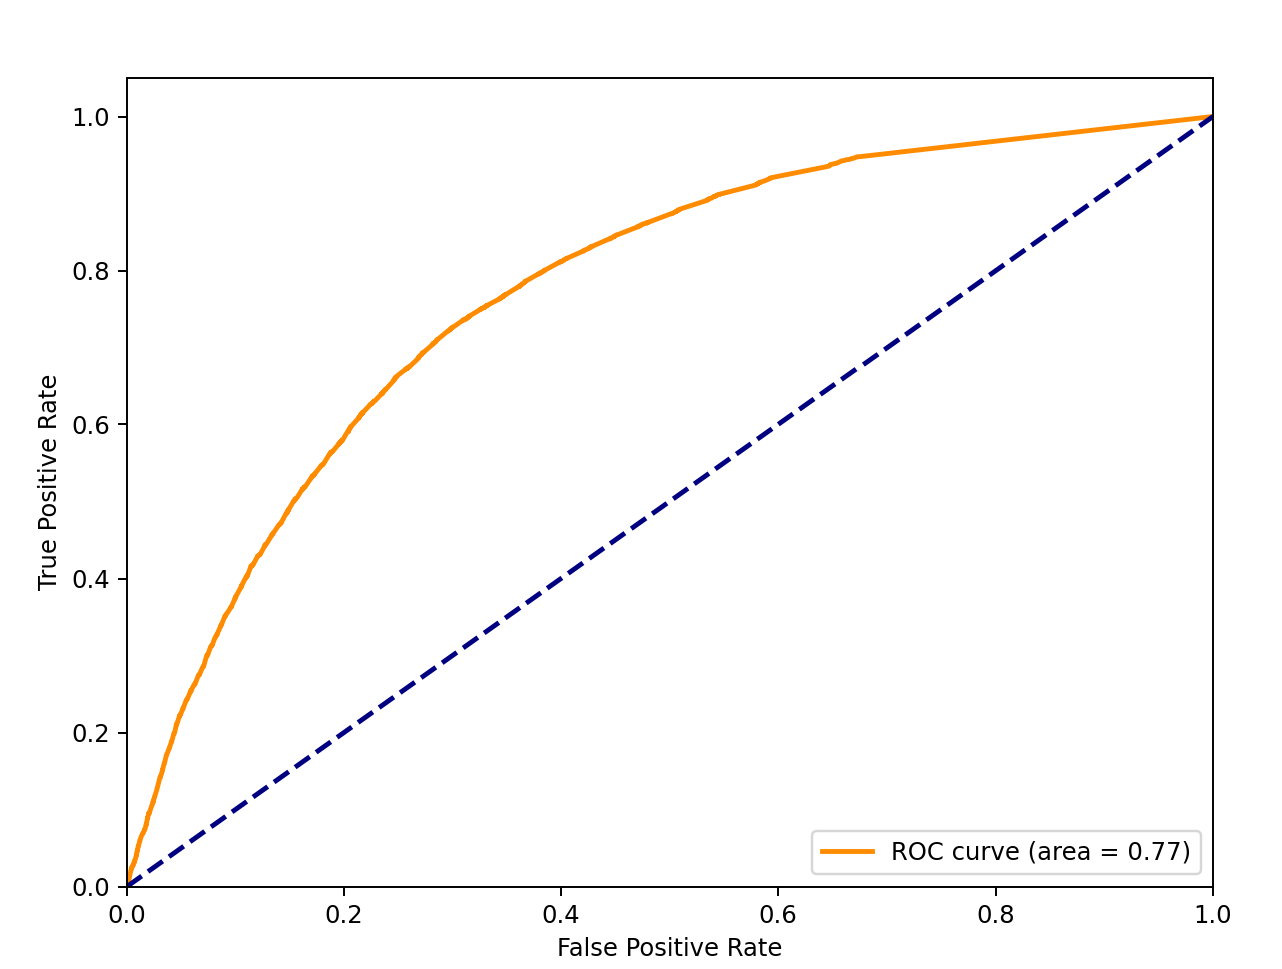
Random Forest ROG graph
Inspiration
Diabetes affects a significant portion of the USA, with an estimated prevalence of 11%. This condition might impact people's lifestyle, and understanding one's personal risk might be a powerful indicator of the habits related to diet and activity. It also helps with directing high-risk people to hospitals, resulting in lowering further damage.
What it does
- First, it asks the user to input certain information about themselves, such as age, physical health, etc.
- Then it feeds these parameters to a linear regression model that I built using historical diabetes data.
- Finally showcases the result at the end.
How we built it
- For the UI and the front-end, I used Streamlit, which is really easy to code in, and it allowed me to have enough time to improve the ML model.
- I didn't want it to be a regular questionnaire, so when the user clicks next in one question, the next question appears at the bottom, and when this new question is selected, the previous question disappears.
- The training data for the model is taken from the following link: https://www.kaggle.com/datasets/alexteboul/diabetes-health-indicators-dataset/data which is a historical dataset related to diabetes in different parameters.
- I used scikit-learn to train this model, and I actually tried to train 4 different models and compare their efficiencies: logistic-regression, random forest, gradient boosting, and SVM. However, SVM took too long to train, so I scraped it.
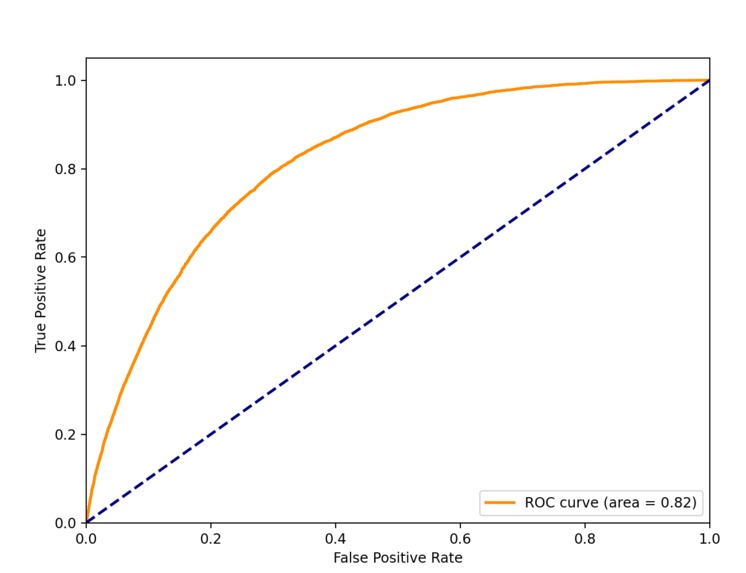
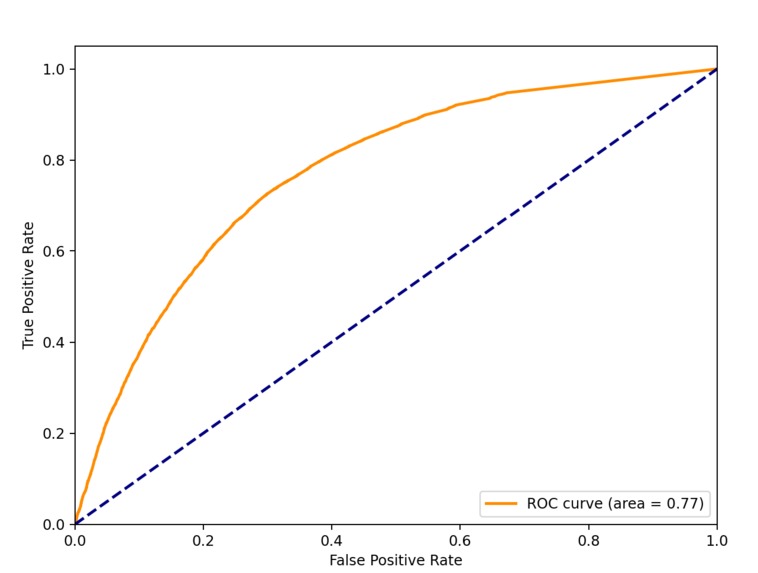
I also evaluated these models, so here are their ROC Curve values(1 = exact, 0.5 = same as randomly choosing):
- gradient-boosting: 0.82
- logistic-regression: 0.81
- random forest: 0.77
Despite the slightly better result of gradient-boosting, I chose logistic regression for the app because it is significantly faster.
Challenges we ran into
- Initially, it was a struggle to figure out the system to show questions one by one, but then with the use of functions and custom keys, I was able to resolve the issue.
- Another issue was with the speed of the web app. I initially used random forest as my model, but it significantly slowed down the web app and made it harder to answer questions, and even caused it to crash. However, after switching to logistic regression and experimenting with it, both the accuracy and the speed had increased.
- Uploading these files was a struggle due to large file sizes, but we were able to launch it thanks to Git LFS
Accomplishments that we're proud of
- I am proud of getting a ROC value of 0.81, while fixing my previous speed issues was a huge success.
- I am happy with being able to publish a fully functional web app that provides decent results to the user.
What we learned
- This is my first time using Streamlit to build a web app, and I learned a lot about how to create different properties and the basics of how they work. This was also my first time using Python for the front-end of a web app.
- I learned how to better evaluate different models and improved my knowledge of them.
What's next for DiaGuide
- I want to implement GridSearch on the models so that I get the best parameters to run with, and maybe even try other tools to train models for better results.
- I also want to implement a system that keeps track of user data in a SQL database, including a second questionnaire that asks users about their daily blood pressure and similar values, and warns them about significant changes over time.
- I am also planning to ask more questions to predict other commonly seen conditions and train more models with their data.
Built With
- pandas
- python
- scikit-learn
- streamlit


Log in or sign up for Devpost to join the conversation.