-
-

Sequence Diagrams
-
Gantt charts
-

Class diagrams
-

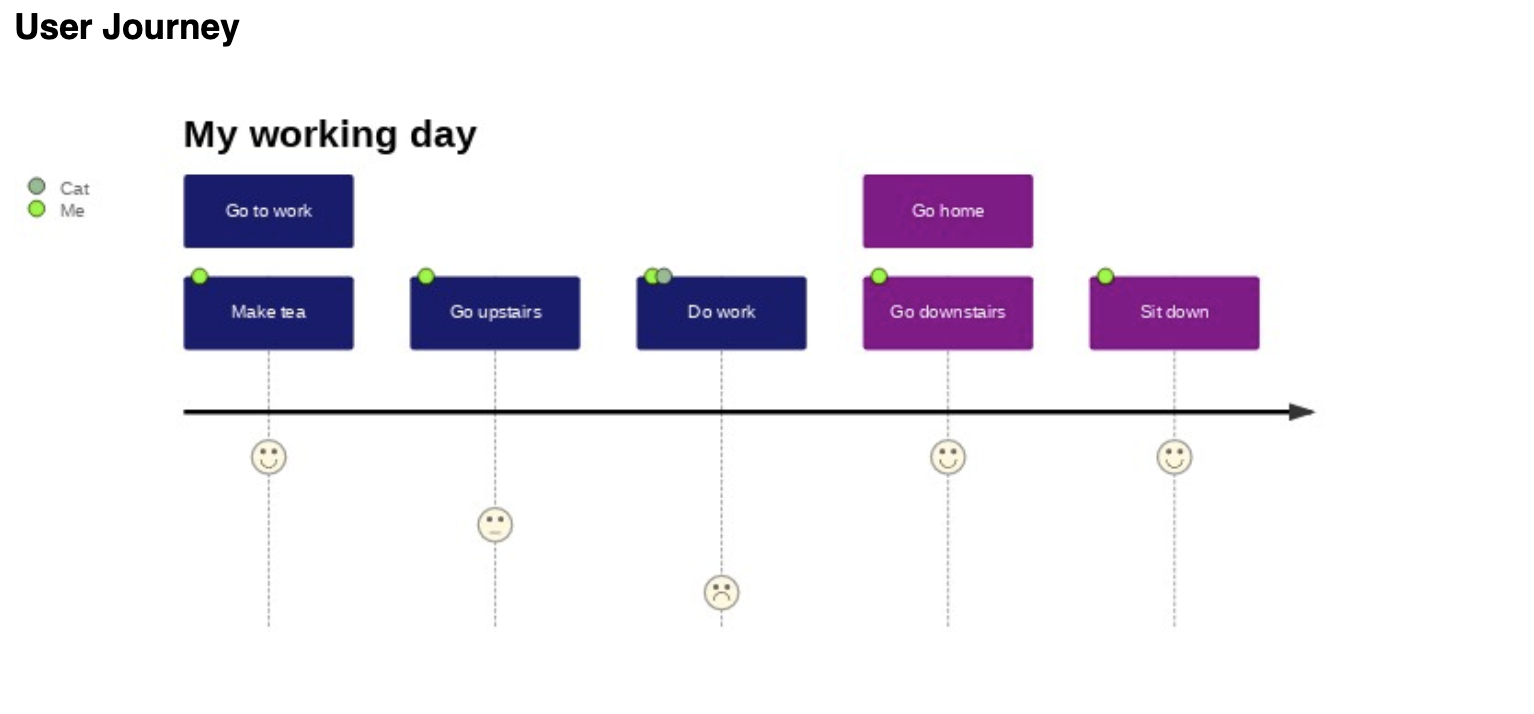
User Journeys
-
ER diagrams

Inspiration
Diagrams are an essential part of the Software development process, helping to communicate complex ideas visually.
However, it is not possible to create diagrams directly in Jira. This means you need to integrate third-party solutions, and you end up wasting time from changing between different software.
So, what if you quickly and easily create diagrams directly in your Jira Issue?
Well, that's what Diagrammer is for.
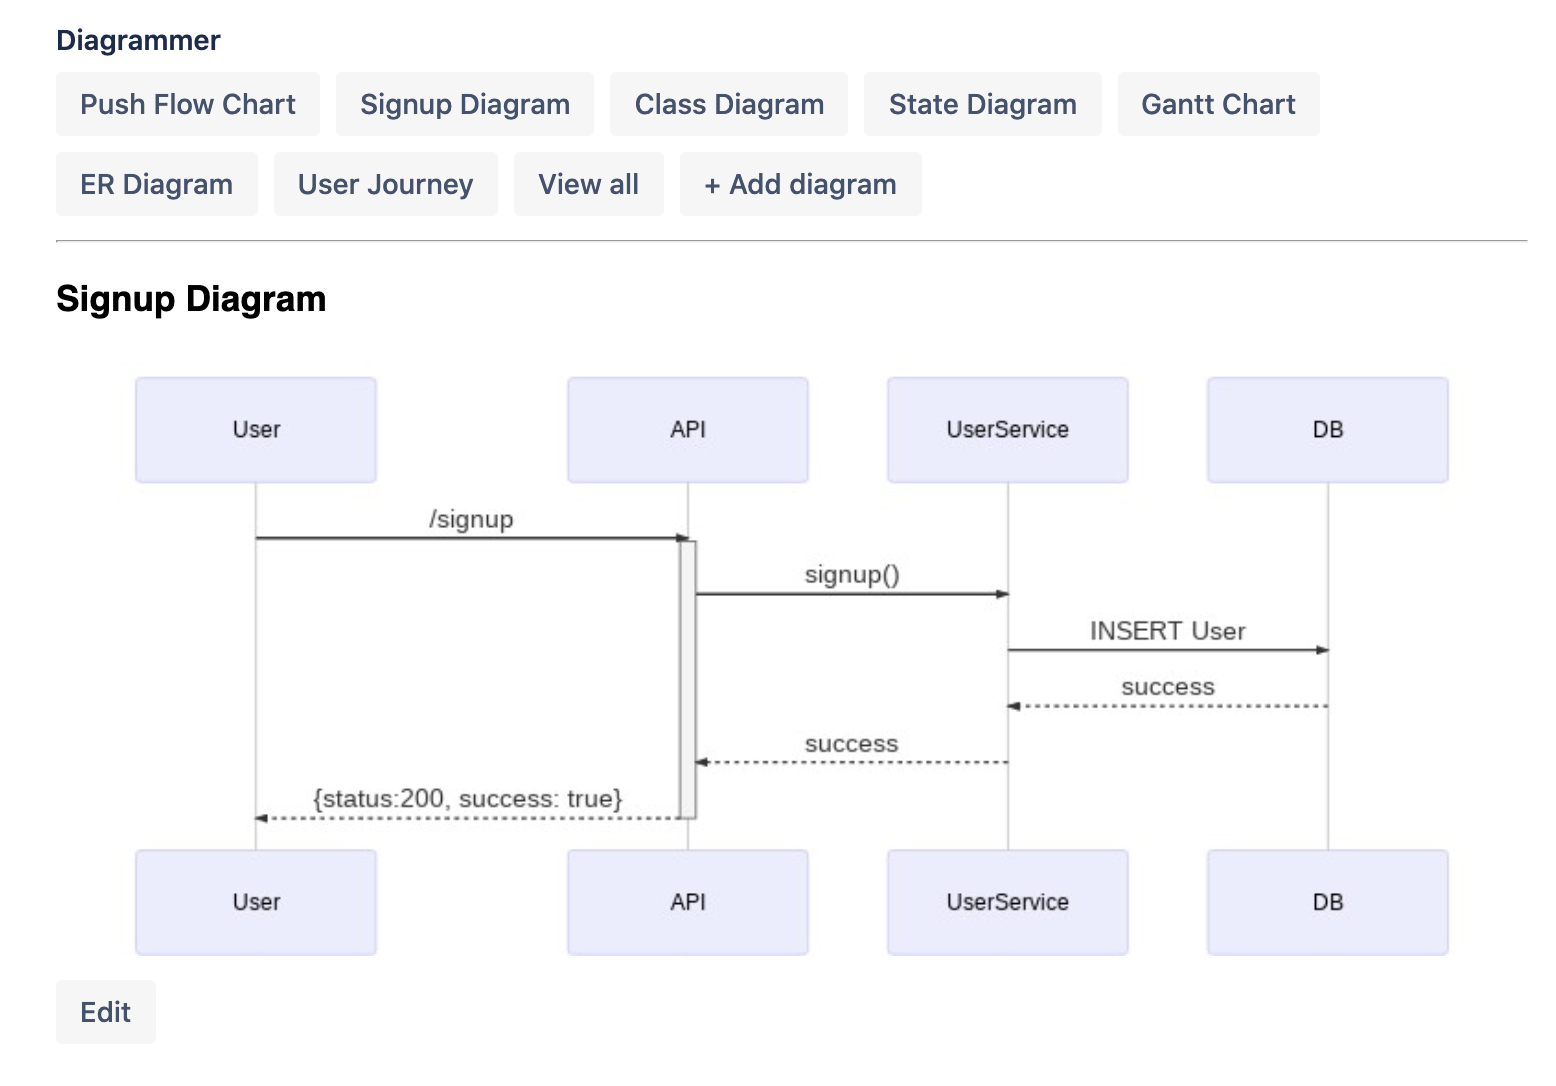
What it does
It allows you to create diagrams in your Jira Issue using a simple, yet powerful markup language, transforming raw text into beautiful diagrams.
Seven different types of diagrams and charts are available:
- Sequence Diagram
- Class Diagram
- State Diagram
- Entity Relationship Diagram
- Flow Chart
- Gantt Chart
- User Journey
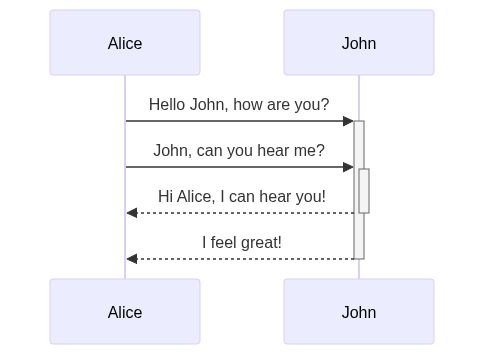
Sequence Diagram
sequenceDiagram
    Alice->>+John: Hello John, how are you?
    Alice->>+John: John, can you hear me?
    John-->>-Alice: Hi Alice, I can hear you!
    John-->>-Alice: I feel great!
Renders this:
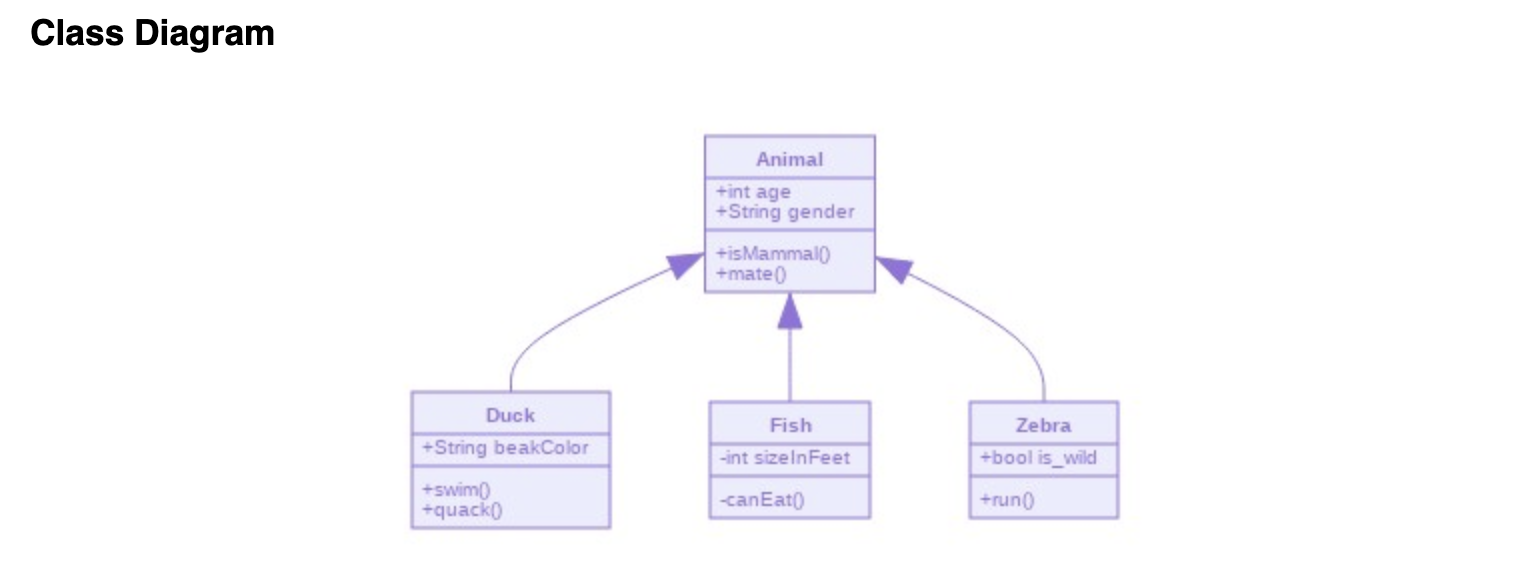
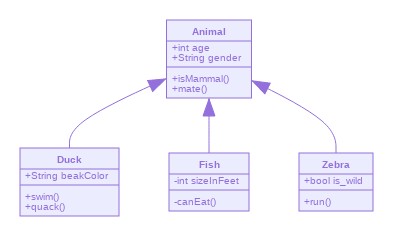
Class Diagram
classDiagram
    Animal <|-- Duck
    Animal <|-- Fish
    Animal <|-- Zebra
    Animal : +int age
    Animal : +String gender
    Animal: +isMammal()
    Animal: +mate()
    class Duck{
        +String beakColor
        +swim()
        +quack()
    }
    class Fish{
        -int sizeInFeet
        -canEat()
    }
    class Zebra{
        +bool is_wild
        +run()
    }
Renders this:
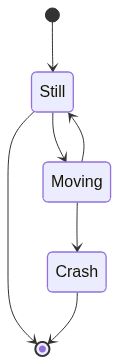
State Diagram
stateDiagram
    [*] --> Still
    Still --> [*]

    Still --> Moving
    Moving --> Still
    Moving --> Crash
    Crash --> [*]
Renders this:
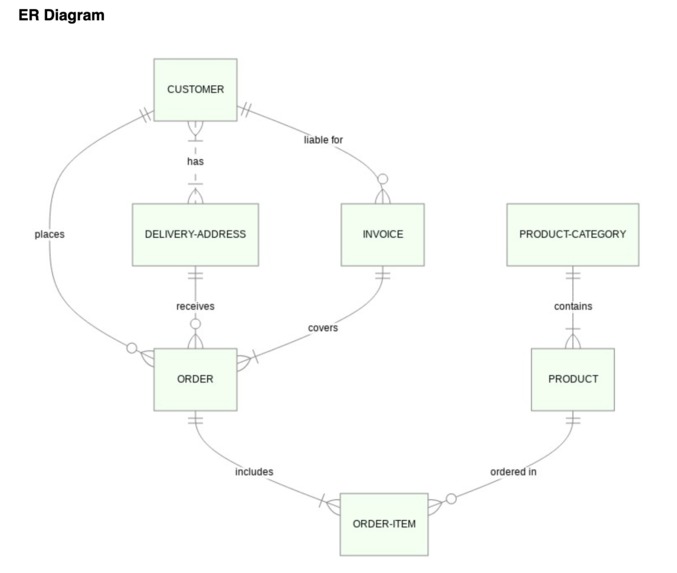
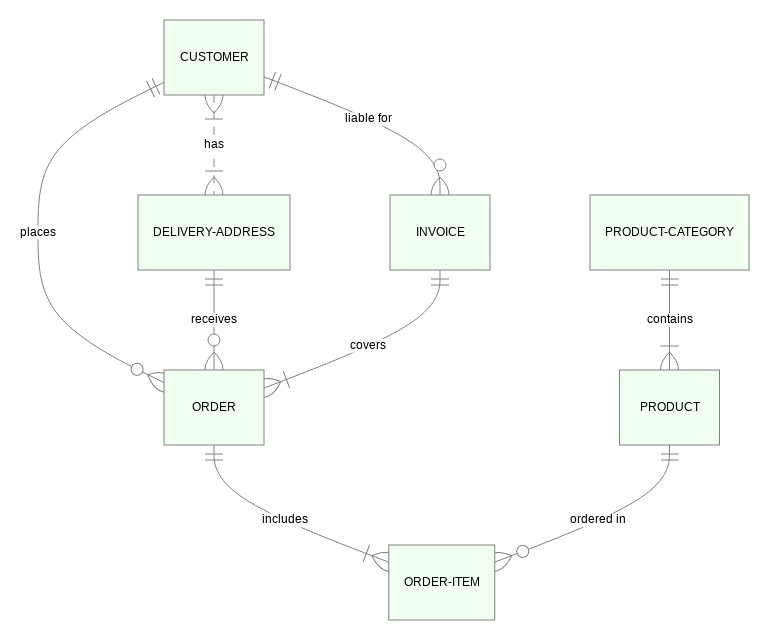
Entity Relationship Diagram
erDiagram
        CUSTOMER }|..|{ DELIVERY-ADDRESS : has
        CUSTOMER ||--o{ ORDER : places
        CUSTOMER ||--o{ INVOICE : "liable for"
        DELIVERY-ADDRESS ||--o{ ORDER : receives
        INVOICE ||--|{ ORDER : covers
        ORDER ||--|{ ORDER-ITEM : includes
        PRODUCT-CATEGORY ||--|{ PRODUCT : contains
        PRODUCT ||--o{ ORDER-ITEM : "ordered in"
Renders this:
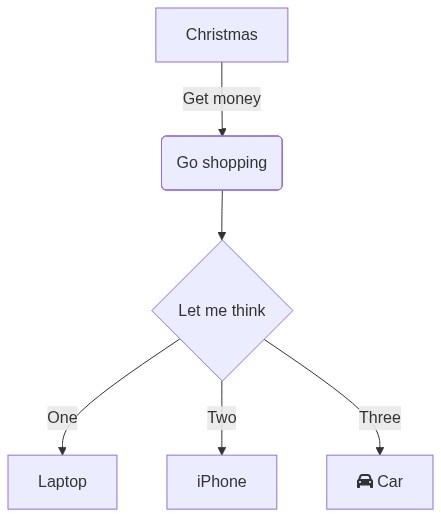
Flow Chart
graph TD
  A[Christmas] -->|Get money| B(Go shopping)
  B --> C{Let me think}
  C -->|One| D[Laptop]
  C -->|Two| E[iPhone]
  C -->|Three| F[fa:fa-car Car]
Renders this:
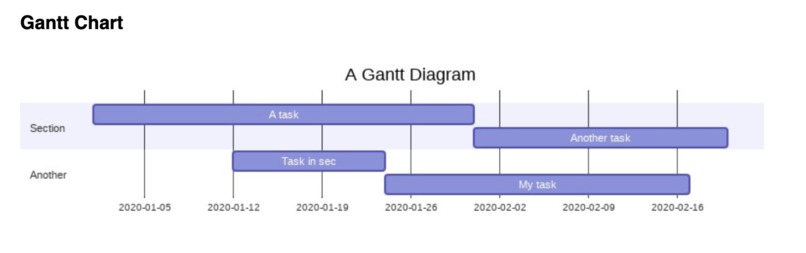
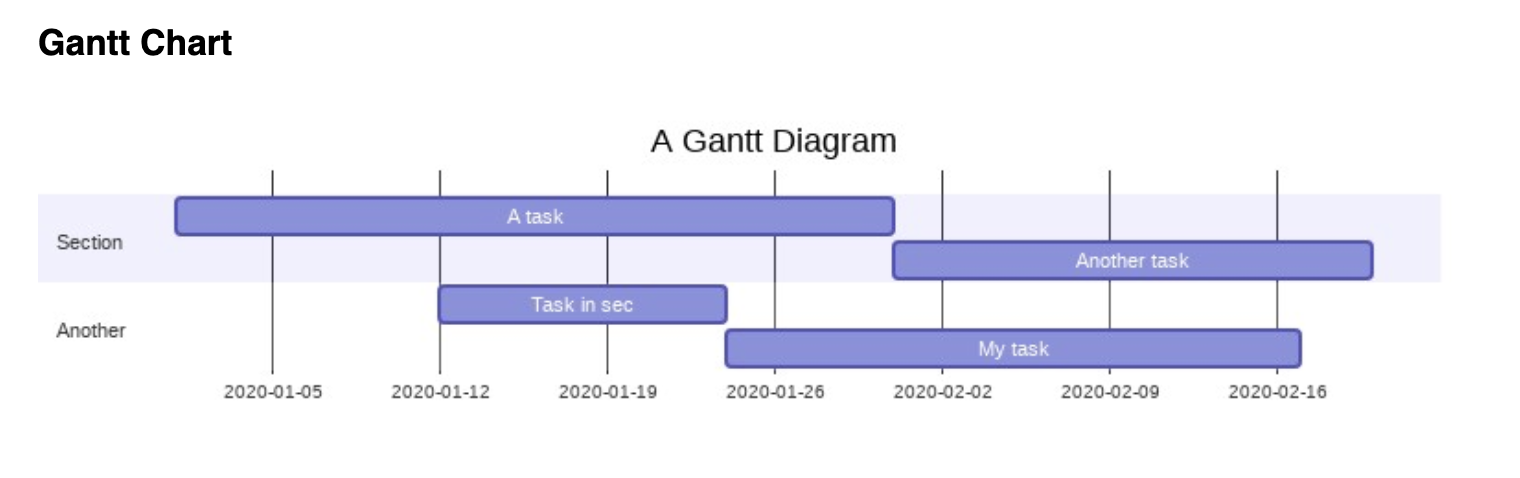
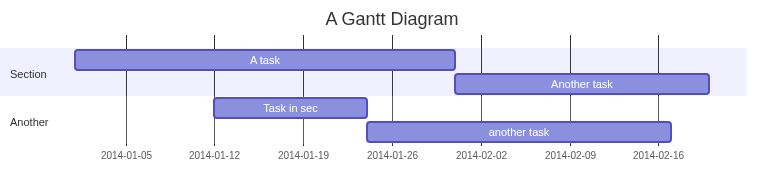
Gantt Chart
gantt
    title A Gantt Diagram
    dateFormat  YYYY-MM-DD
    section Section
    A task           :a1, 2014-01-01, 30d
    Another task     :after a1  , 20d
    section Another
    Task in sec      :2014-01-12  , 12d
    another task      : 24d
Renders this:
How I built it
I have used the amazing MermaidJS library to transform text into diagrams and charts.
Challenges I ran into
The biggest challenge was finding a way to create beautiful diagrams without being able to use HTML tags directly in Forge. After trying different approaches, the final solution was transforming the diagrams into images.
Accomplishments that I'm proud of
I'm really proud of the flexibility that it is possible to achieve with my app. It can be easily extended to include more diagrams, more customisations, and yet everything is very simple to use.
What I learned
It was a great experience to learn how to use Forge and other Atlassian products. The ecosystem is amazing and allows you to create amazing products by leveraging Atlassian solutions.
What's next for Prototyper
- Add more diagrams
- Allow to customise themes


Log in or sign up for Devpost to join the conversation.