-
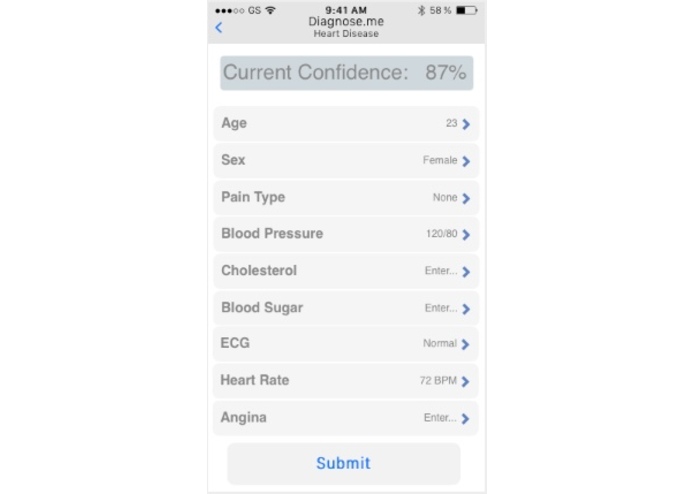
UI/UX demo
-

UI/UX demo
-
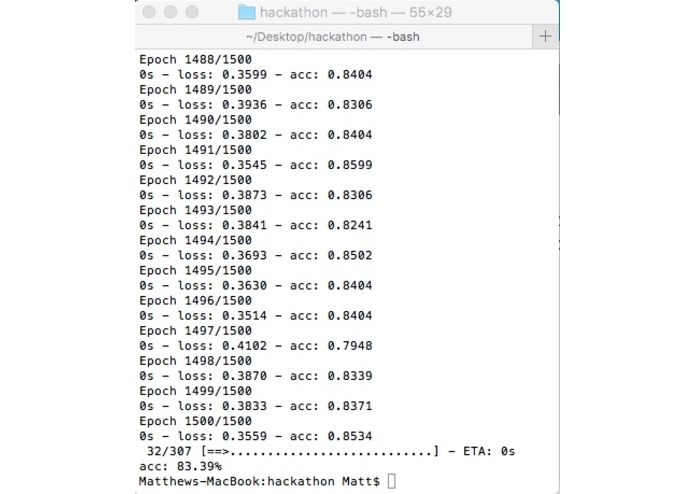
think.py sample output
-
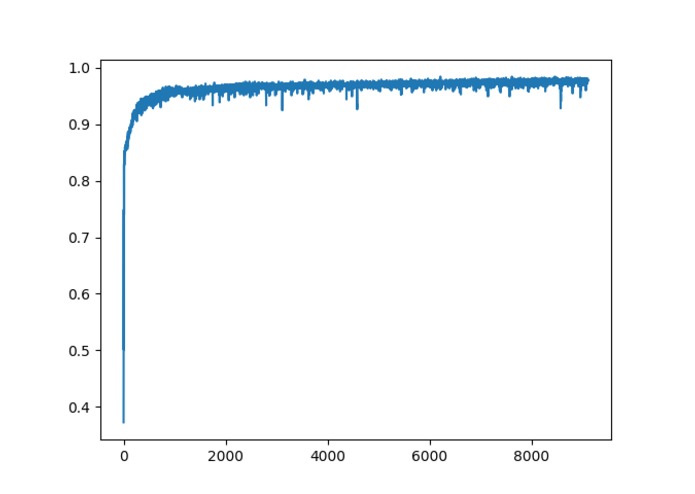
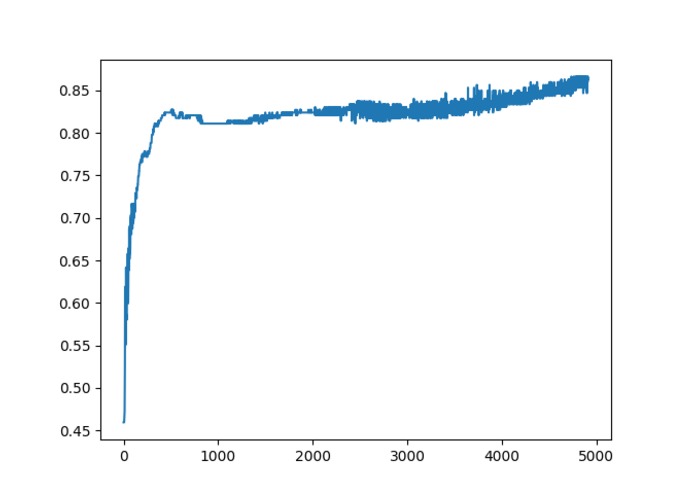
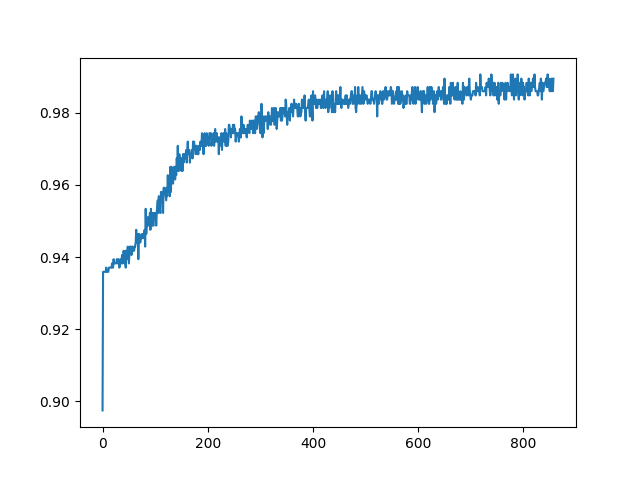
breast cancer data fed through neural network, graph is of accuracy of neural network over the number of inputs that were received.
-
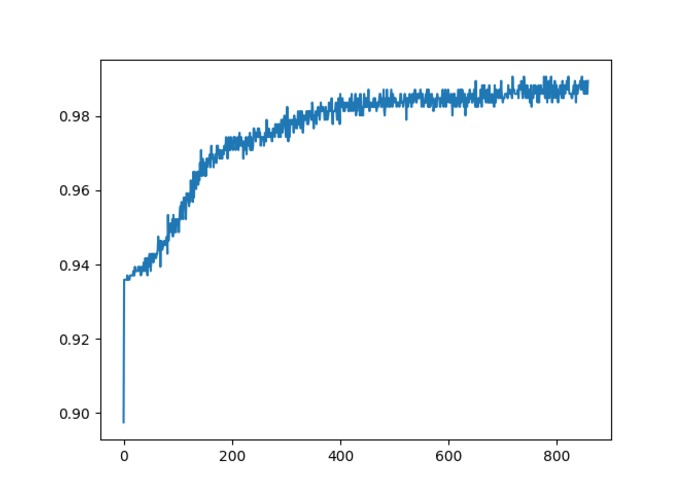
diabetes data fed through neural network, graph is of accuracy of neural network over the number of inputs that were received.
-
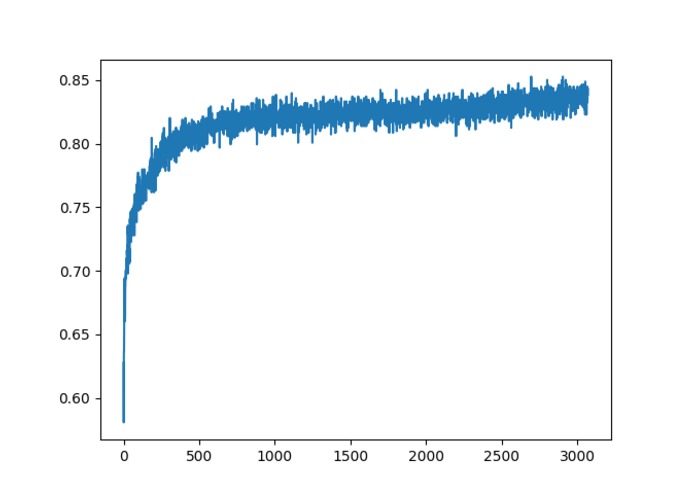
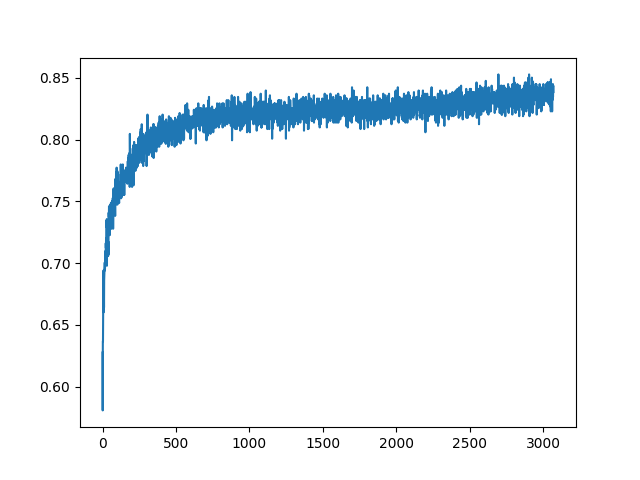
heart disease data fed through neural network, graph is of accuracy of neural network over the number of inputs that were received.
-
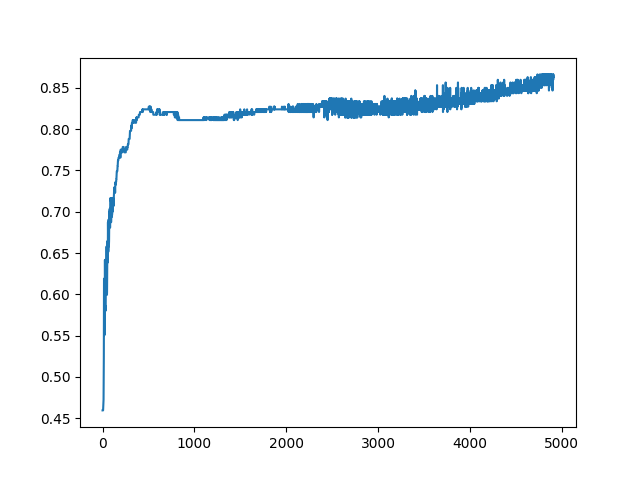
cervical cancer data fed through neural network, graph is of accuracy of neural network over the number of inputs that were received.


This is the main driver of the project. It's written in Python and calls on Tensor Flow for machine learning through a neural network. All data, code, and outputs are available at the link provided.
```from keras.models import Sequential from keras.layers import Dense import numpy import csv import matplotlib.pyplot as plt
fix random seed for reproducibility
numpy.random.seed(7)
load pima indians dataset
dataset = numpy.loadtxt("./data/new.data.csv", delimiter=",")
split into input (X) and output (Y) variables
X = dataset[:,0:13] Y = dataset[:,14]
create model
model = Sequential() model.add(Dense(17, input_dim=13, activation='relu')) model.add(Dense(13, activation='relu')) model.add(Dense(1, activation='sigmoid'))
Compile model
optimizer = Adam(lr=0.001, beta_1=0.9, beta_2=0.999, epsilon=1e-08, decay=0.0)
model.compile(loss='binary_crossentropy', optimizer=optimizer, metrics=['accuracy'])
epochs = [150]
batch_sizes = [10]
losses = ['mean_squared_error', 'mean_absolute_error', 'mean_absolute_percentage_error', 'mean_squared_logarithmic_error', 'squared_hinge', 'hinge', 'categorical_hinge', 'logcosh', #'categorical_crossentropy', #'sparse_categorical_crossentropy', 'binary_crossentropy', 'kullback_leibler_divergence', 'poisson', 'cosine_proximity']
optimizers = ['SGD', 'RMSprop', 'Adagrad', 'Adadelta', 'Adam', 'Adamax', 'Nadam'] #'TFOptimizer']
with open('./data/accuracy.csv','a') as f1: writer=csv.writer(f1, delimiter=',',lineterminator='\n',) writer.writerow(["Run Start"]) writer.writerow(['loss', 'optimizer', 'epoch', 'batch_size', 'accuracy'])
Iterator used to test accuracies of different losses and optimizers
for i in range(len(losses)):
for j in range(len(optimizers)):
for k in range(len(epochs)):
for l in range(len(batch_sizes)):
print(losses[i])
print(optimizers[j])
model.compile(loss=losses[i], optimizer=optimizers[j], metrics=['accuracy'])
results = model.fit(X, Y, epochs=epochs[k], batch_size=batch_sizes[l])
# evaluate the model
scores = model.evaluate(X, Y)
print("\n%s: %.2f%%" % (model.metrics_names[1], scores[1]*100))
with open('./data/accuracy.csv','a') as f1:
writer=csv.writer(f1, delimiter=',',lineterminator='\n',)
writer.writerow([losses[i], optimizers[j], epochs[k], batch_sizes[l], scores[1]*100])
model.compile(loss='binary_crossentropy', optimizer='Adam', metrics=['accuracy'])
results = model.fit(X, Y, epochs=1500, batch_size=50, verbose=2)
evaluate the model
scores = model.evaluate(X, Y) print("\n%s: %.2f%%" % (model.metrics_names[1], scores[1]*100))
calculate predictions
predictions = model.predict(X)
print(predictions)
round predictions
rounded = [round(x[0]) for x in predictions]
print(rounded)
with open('./data/output.csv','w') as f1: writer=csv.writer(f1, delimiter=',',lineterminator='\n',) for i in range(len(predictions)): writer.writerow([str(predictions[i]).replace('[','').replace(']',''), rounded[i]])
with open('./data/accuracy2.csv','w') as f1: writer=csv.writer(f1, delimiter=',',lineterminator='\n',) for i in range(len(results.history['acc'])): writer.writerow([results.history['acc'][i]])
plot the accuracy over epochs
plt.plot(results.history['acc'])
plt.show()```
Built With
- python
- tensor-flow


Log in or sign up for Devpost to join the conversation.