-

3D Data Visualization Dashboard with Real-time Engagement Tracking.
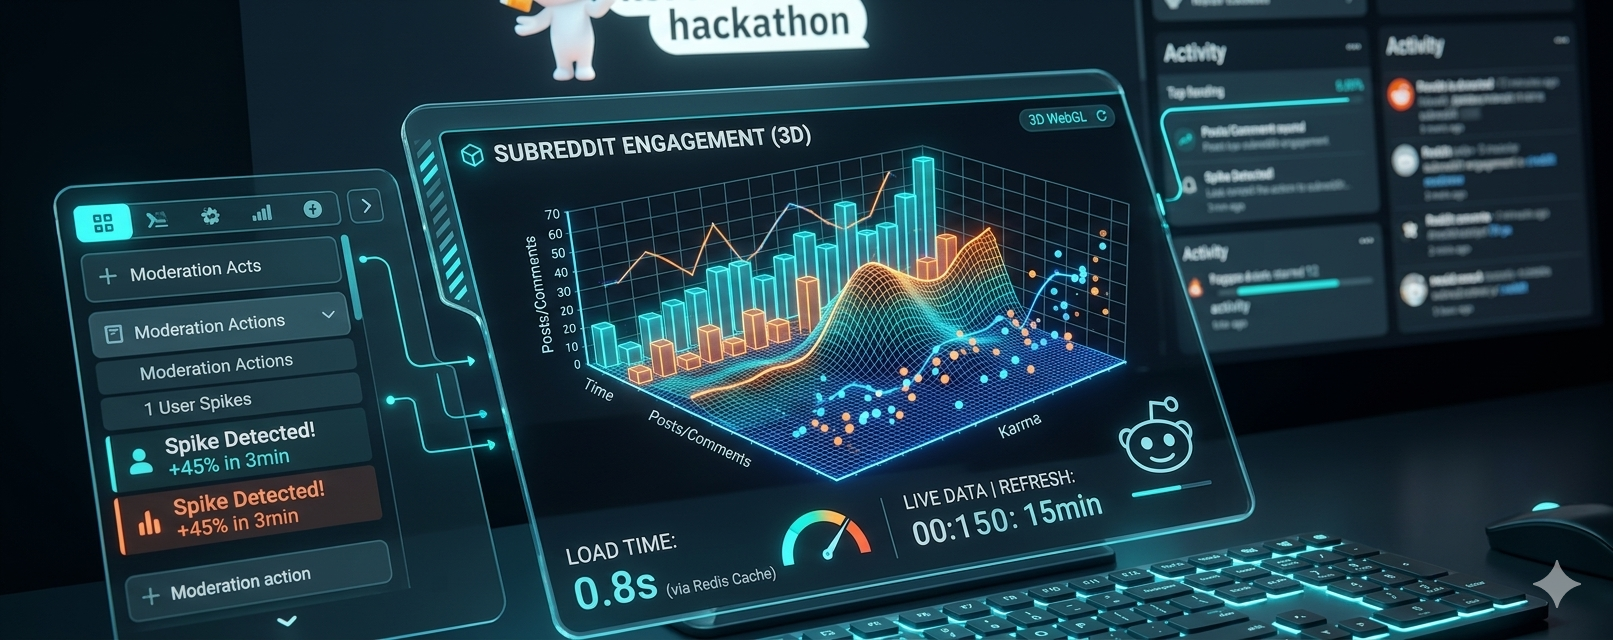
About the Project Inspiration As an application developer, I noticed that Reddit moderators often struggle to analyze large amounts of community data quickly. My goal was to transform dry numerical logs into an interactive and engaging visual experience.
How it was built The project was developed using the Devvit platform, focusing on three core technical pillars:
A custom WebGL-based engine designed to render community engagement data in a 3D perspective.
Integration of a Redis Caching layer to ensure sub-second loading times and efficient API usage.
Implementation of automated background schedulers to keep the dashboard updated every 15 minutes without manual intervention.
Challenges and Learning The primary challenge was ensuring that 3D graphics performed smoothly within the constraints of Reddit's environment. This process provided valuable insights into performance optimization for embedded web applications.
Accomplishments The result is a fast, intuitive, and high-performance dashboard that provides moderators with an immediate comprehensive overview of their community’s activity.

Log in or sign up for Devpost to join the conversation.