-
-
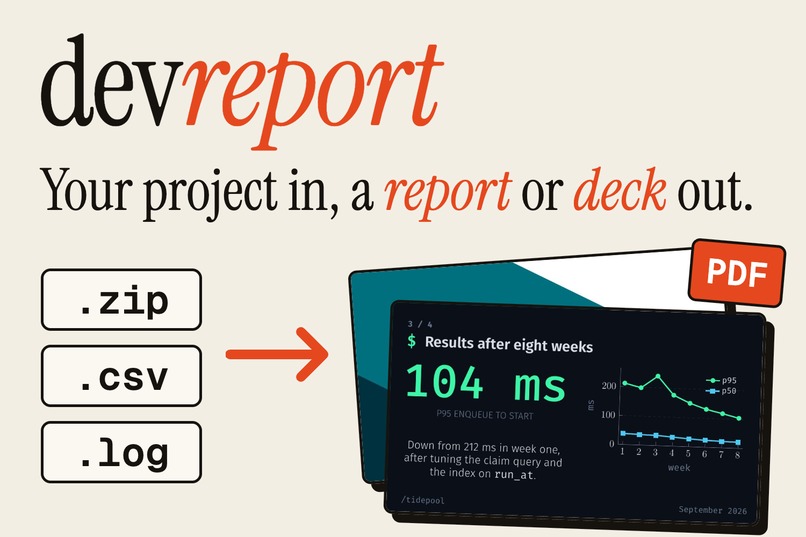
devreport ; the best way to generate ppt/reports
-
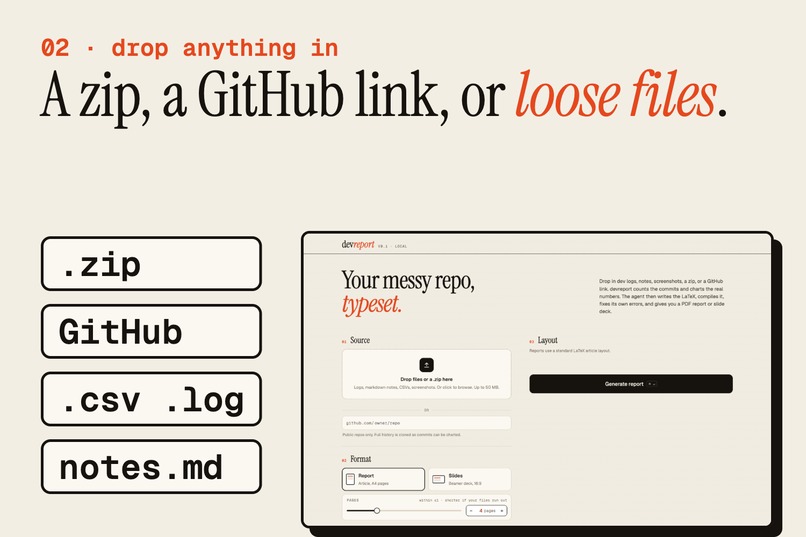
We convert anything to a report/ppt
-
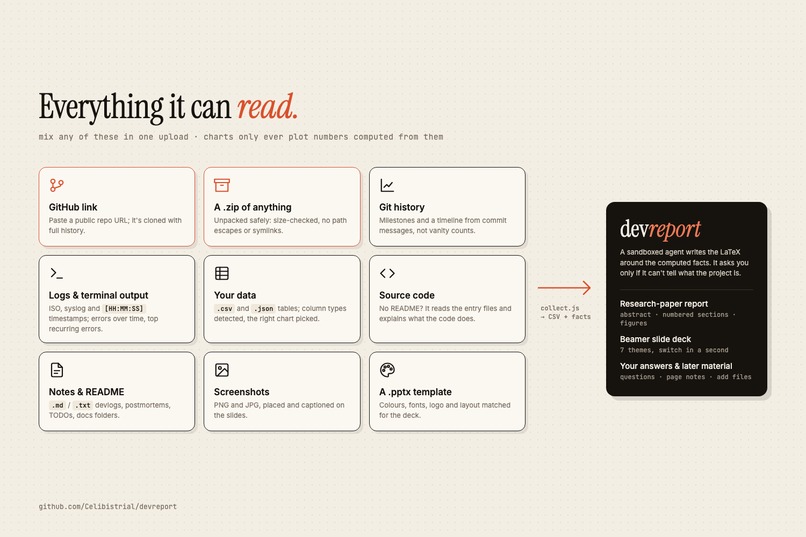
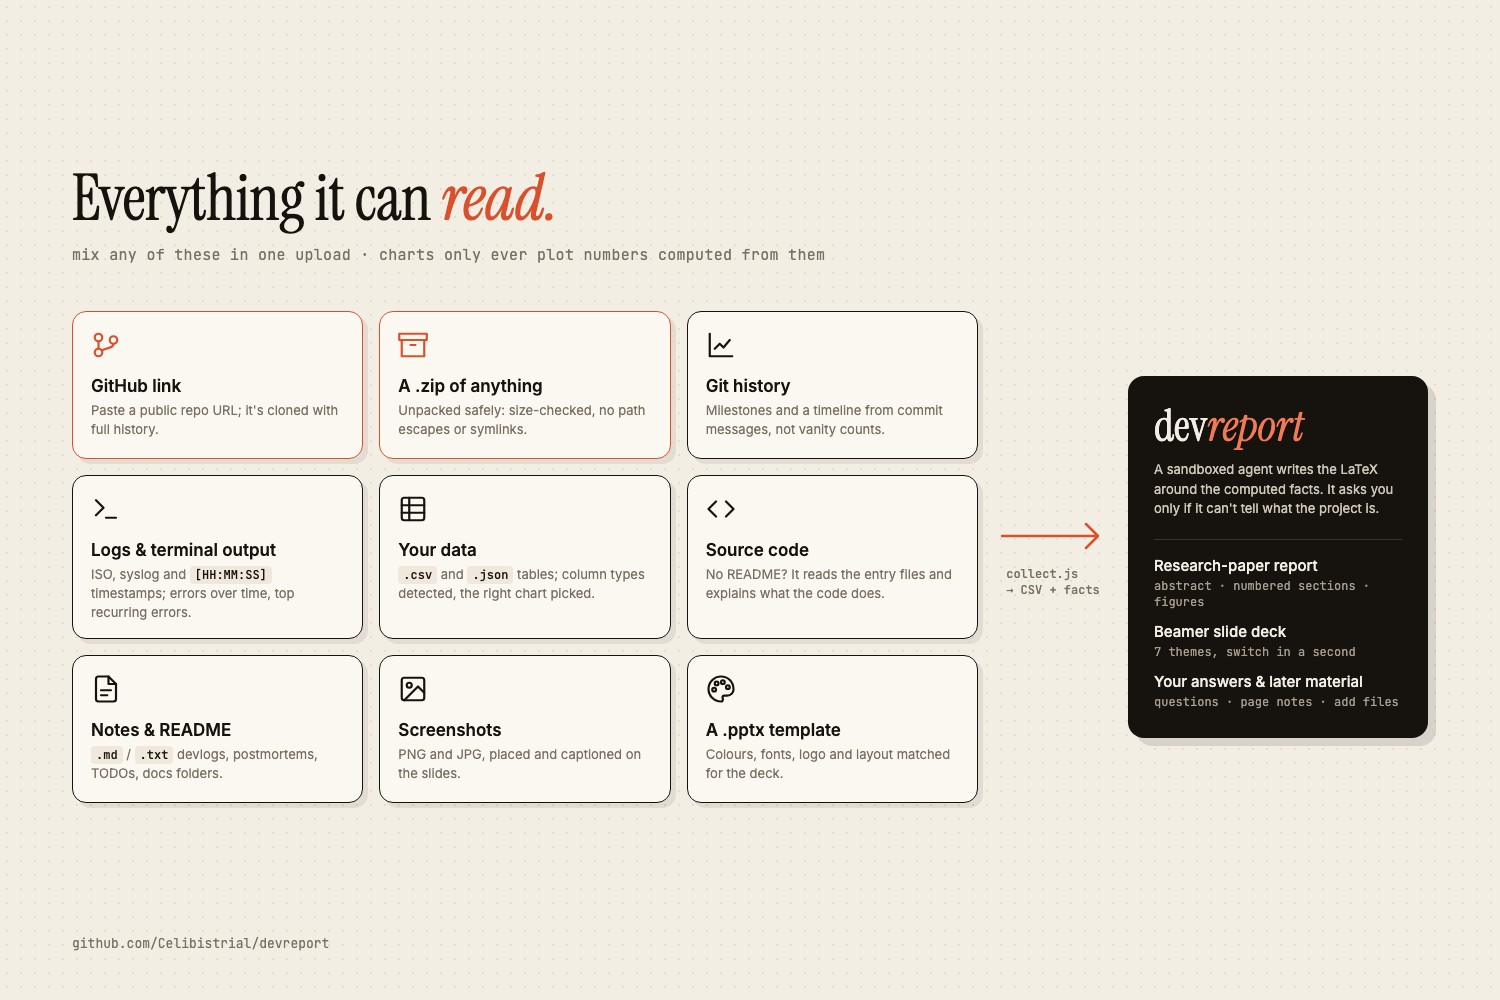
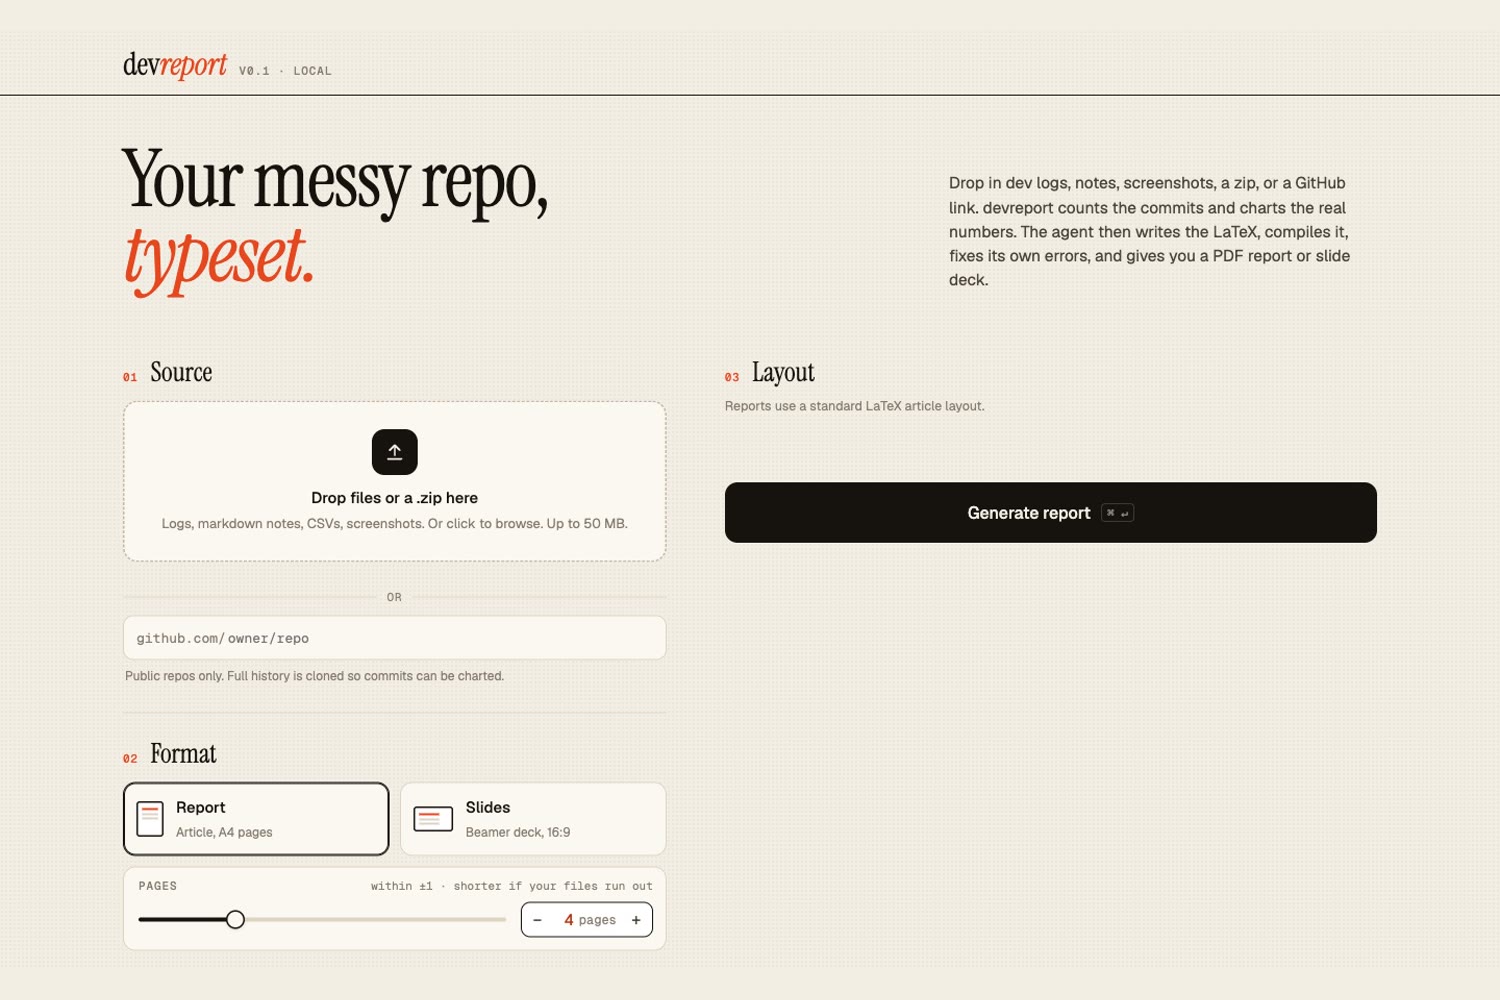
By anything we do mean ANYTHING , git links , git commits , markdown files , csv files , logs ... you name it and we accept it as an input
-
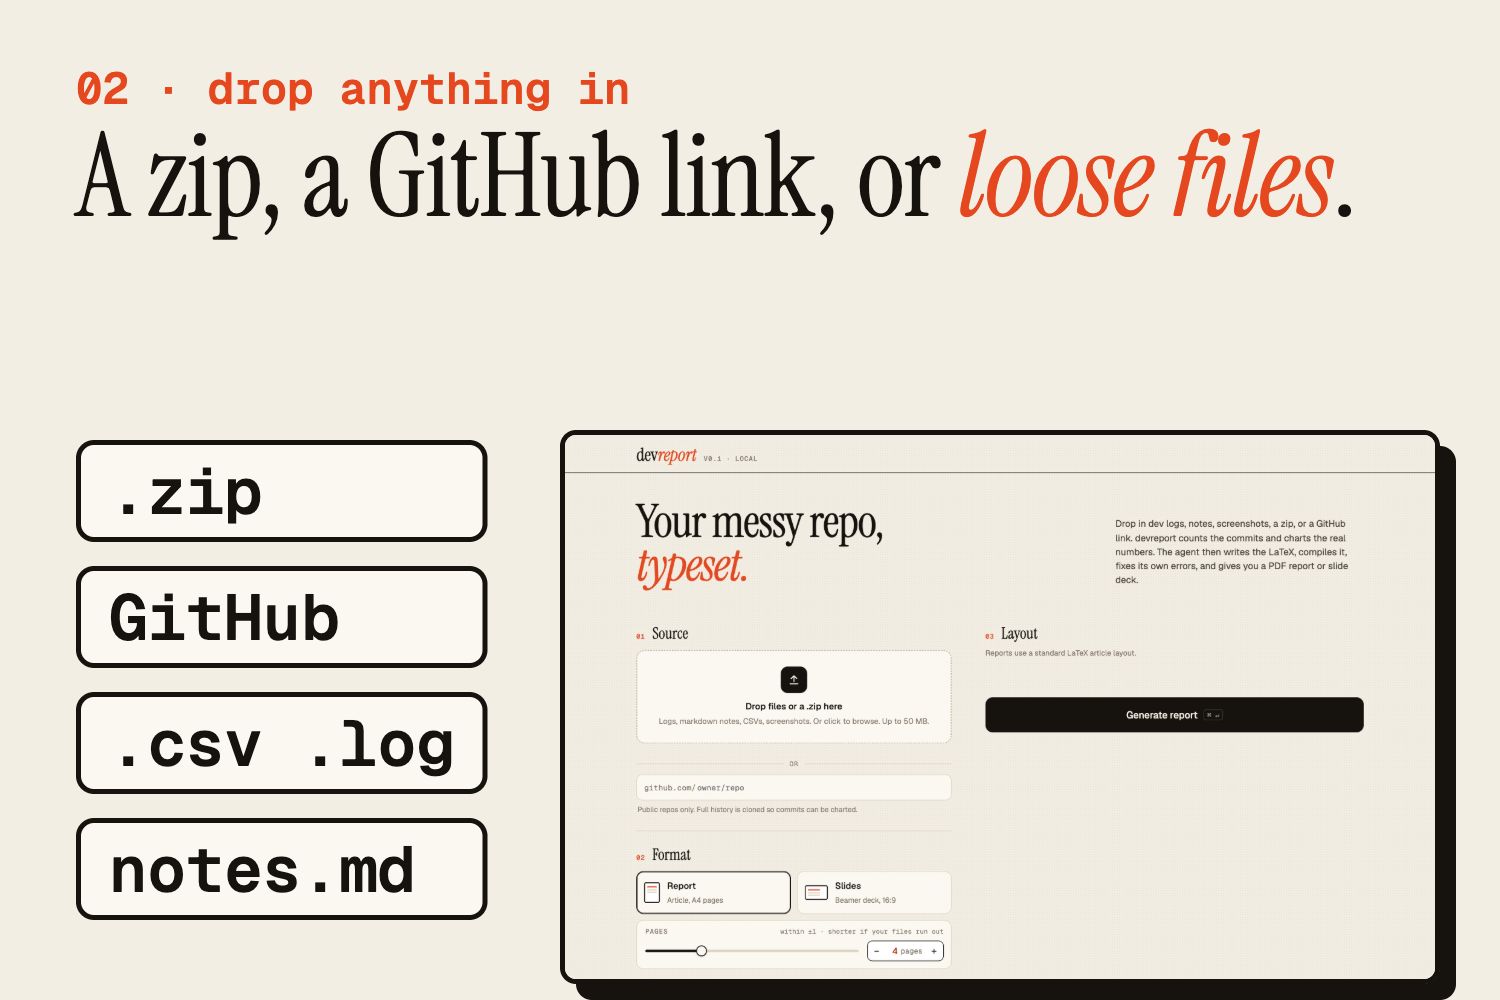
Just drag your folder / zip in and choose the theme to make a ppt, graphs etc will be made on their own
-
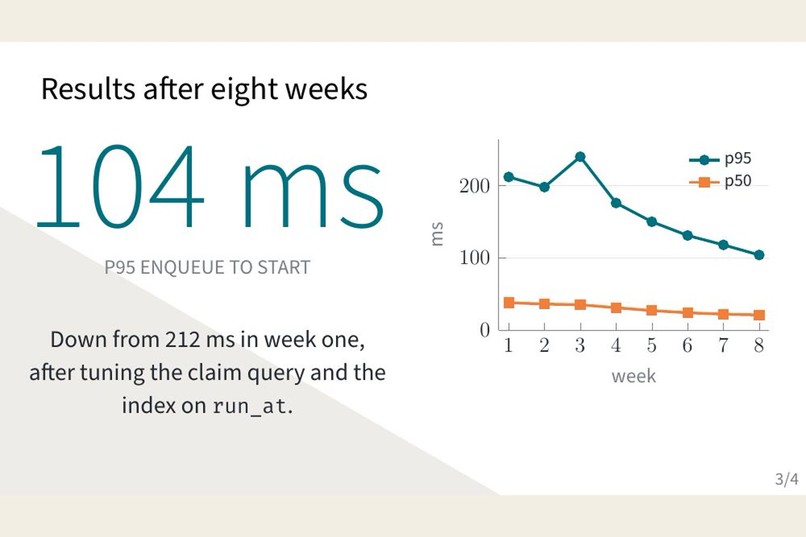
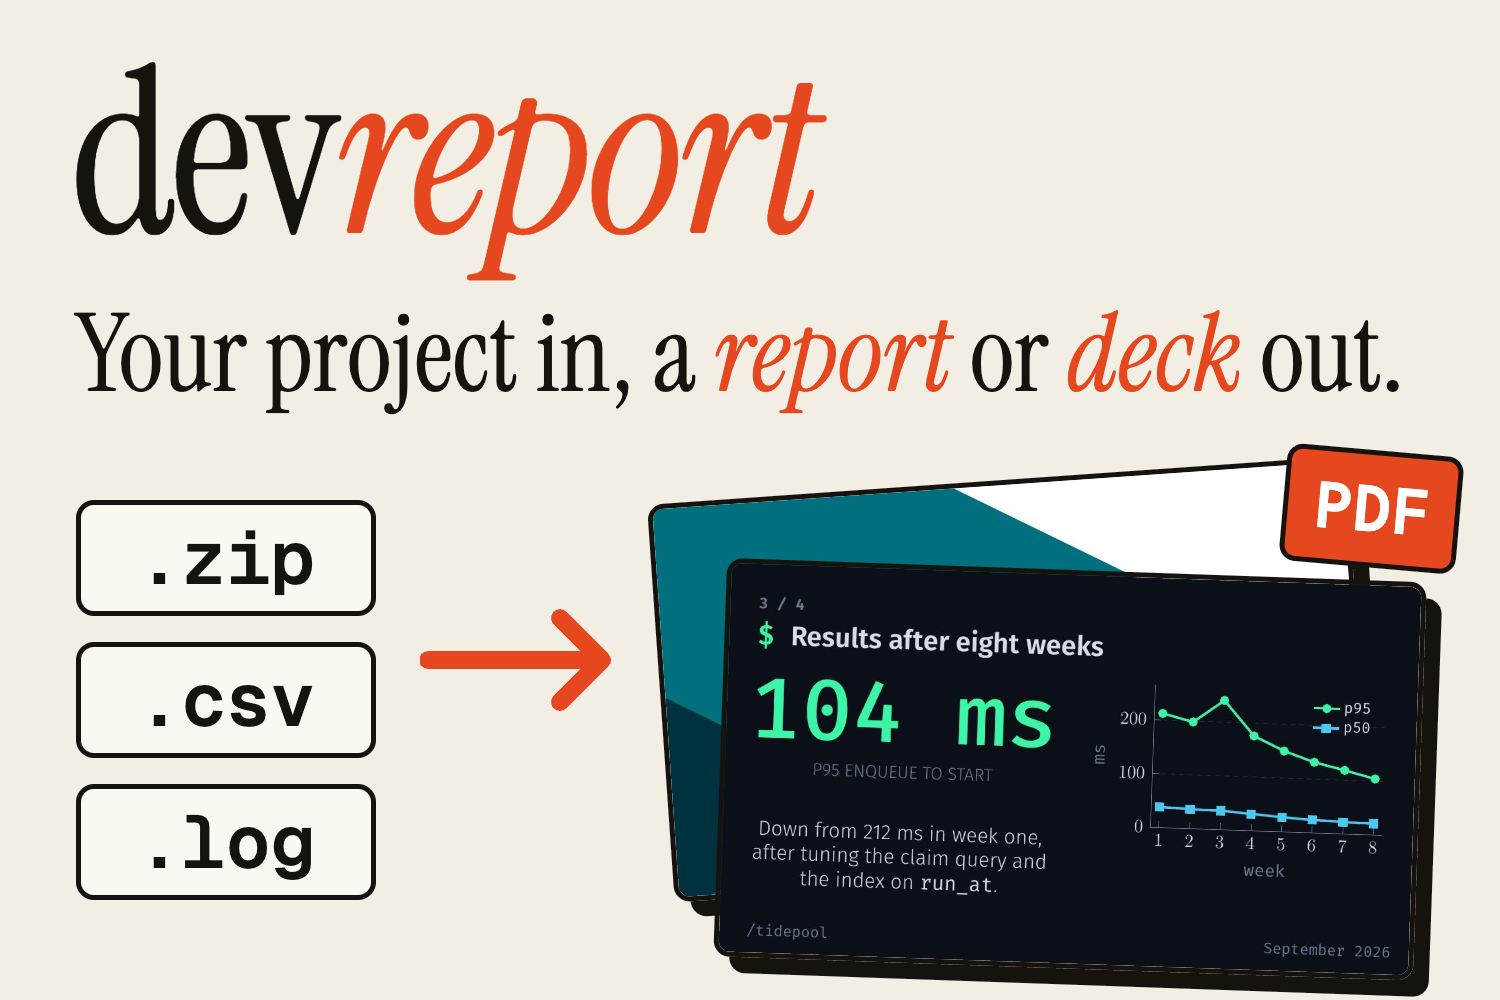
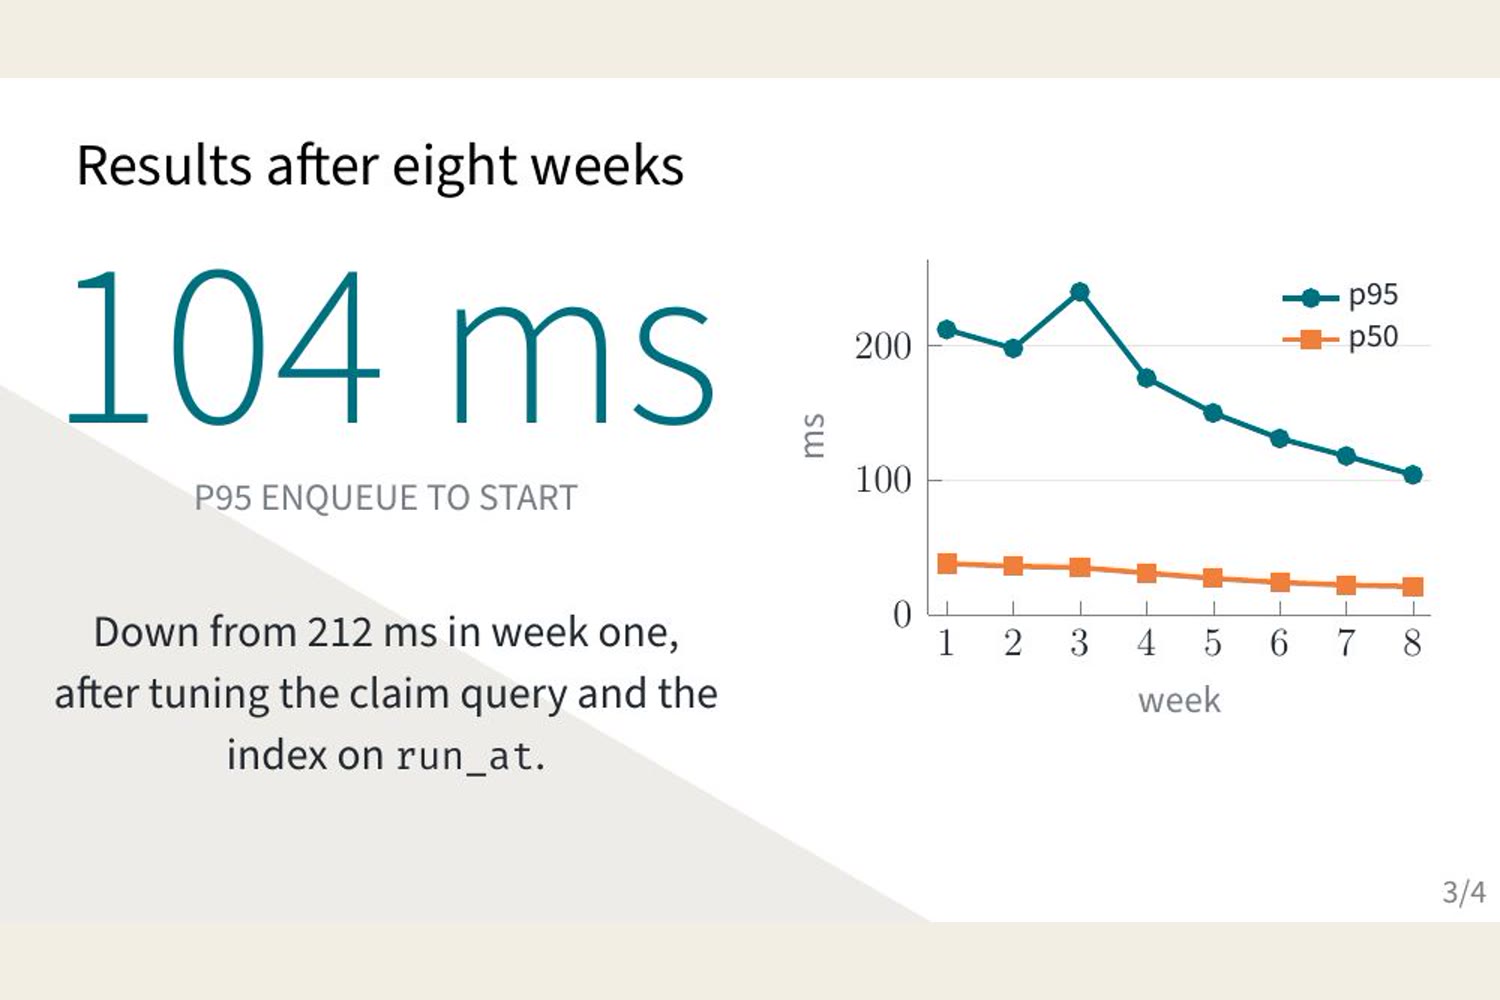
Here is an example of a slide generated
-
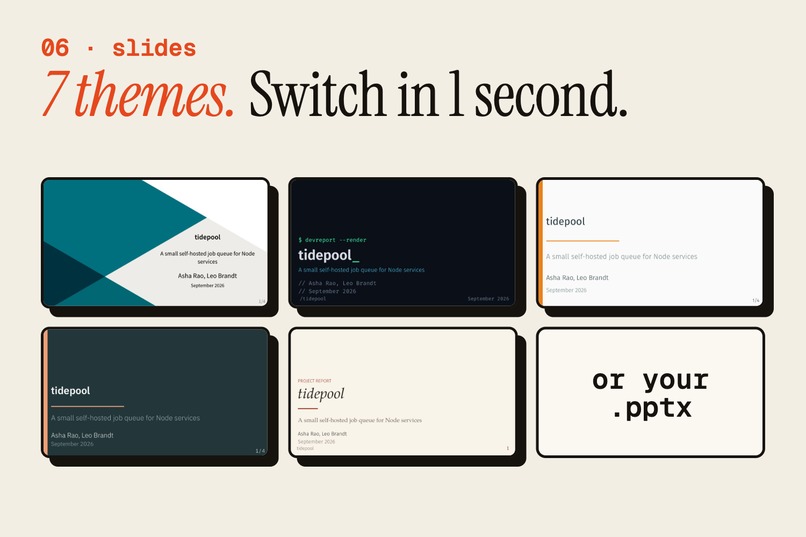
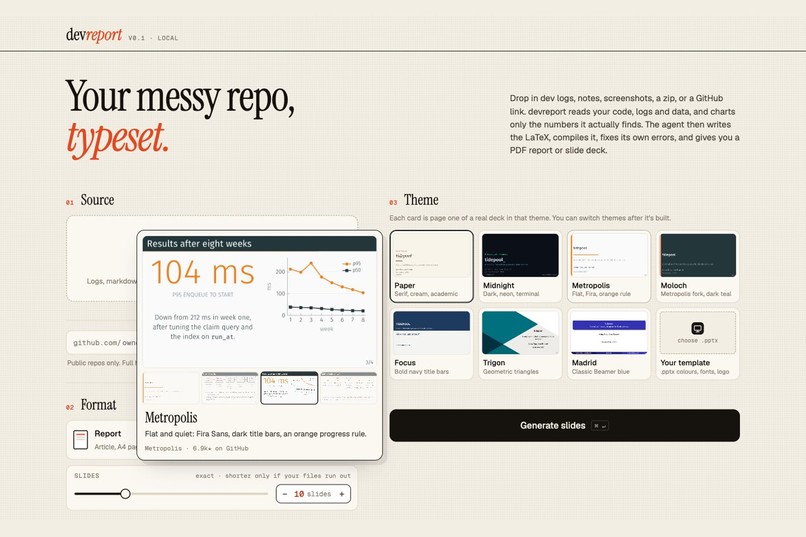
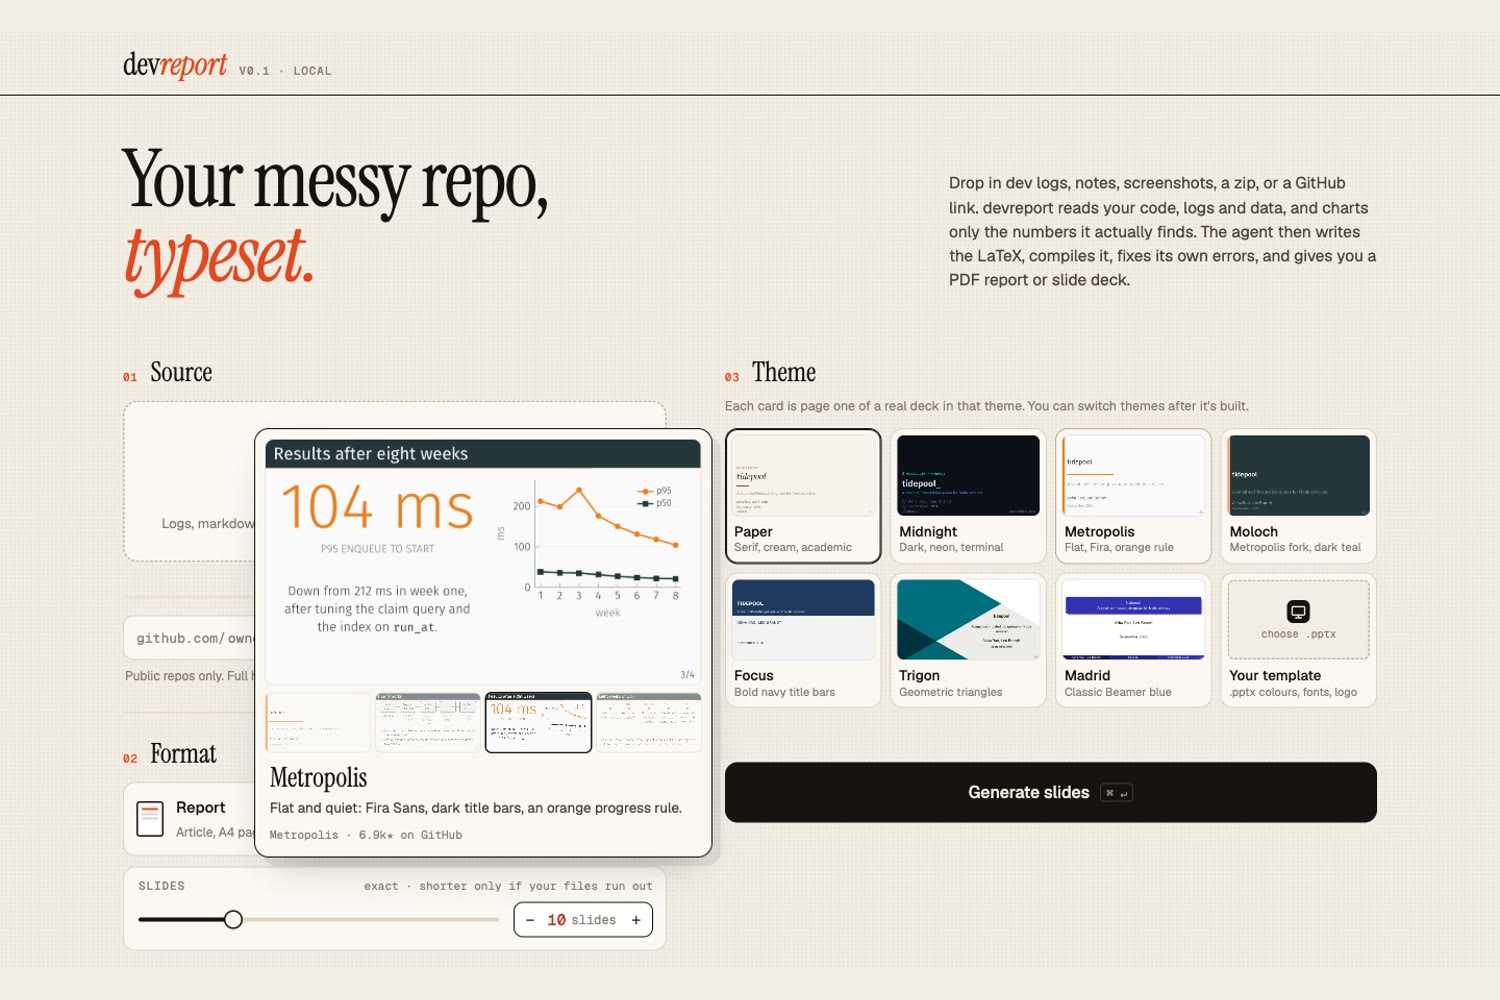
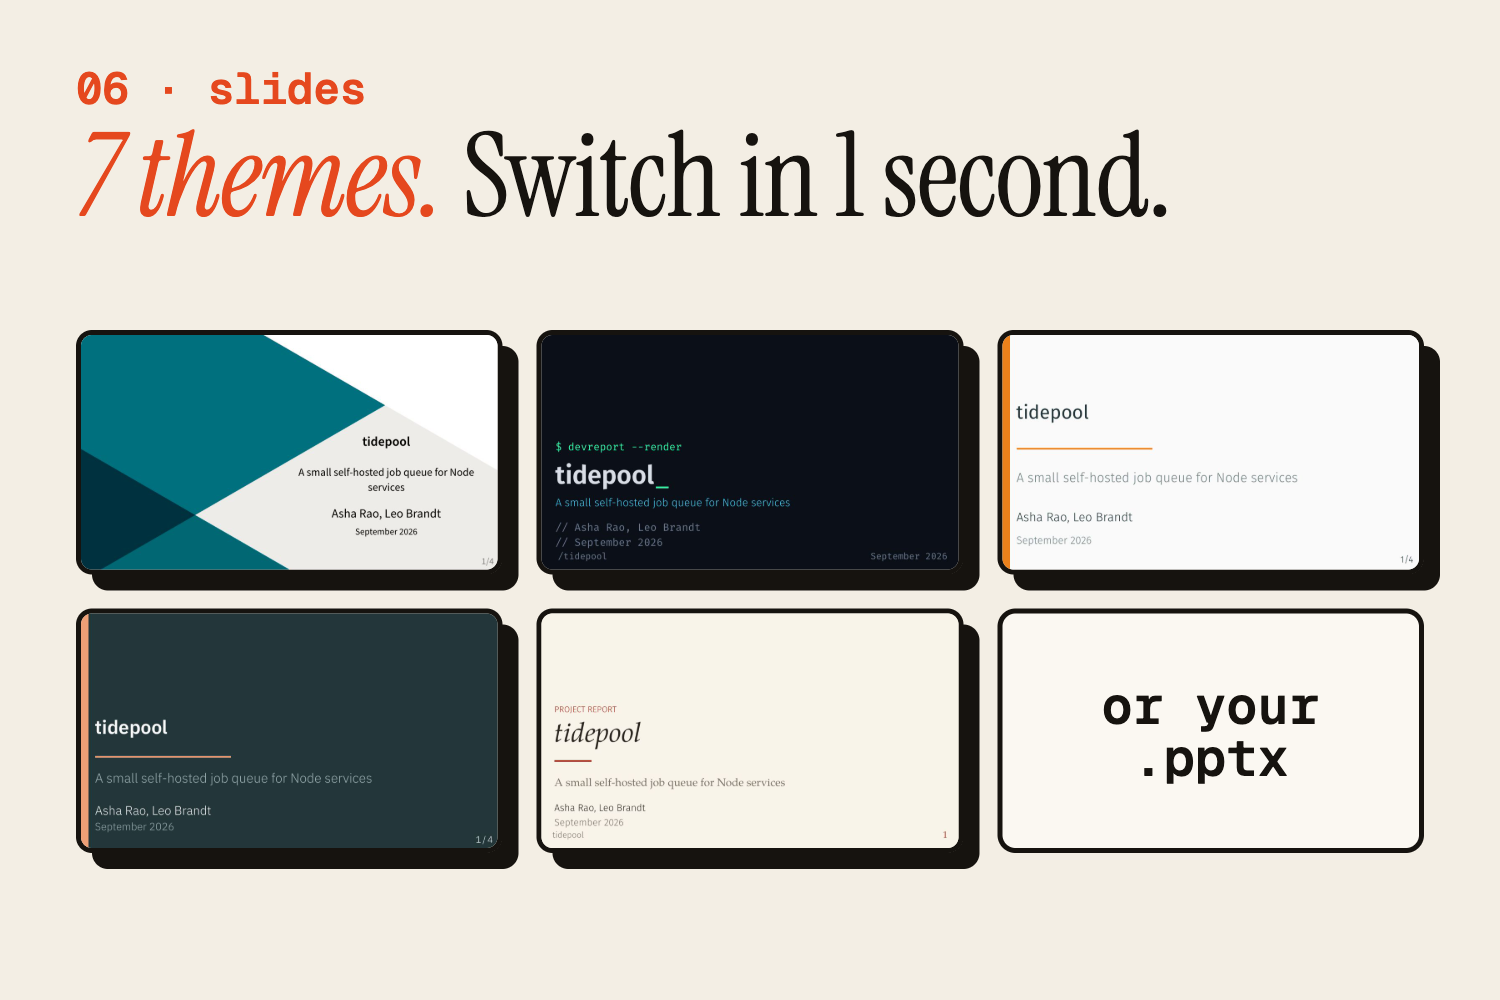
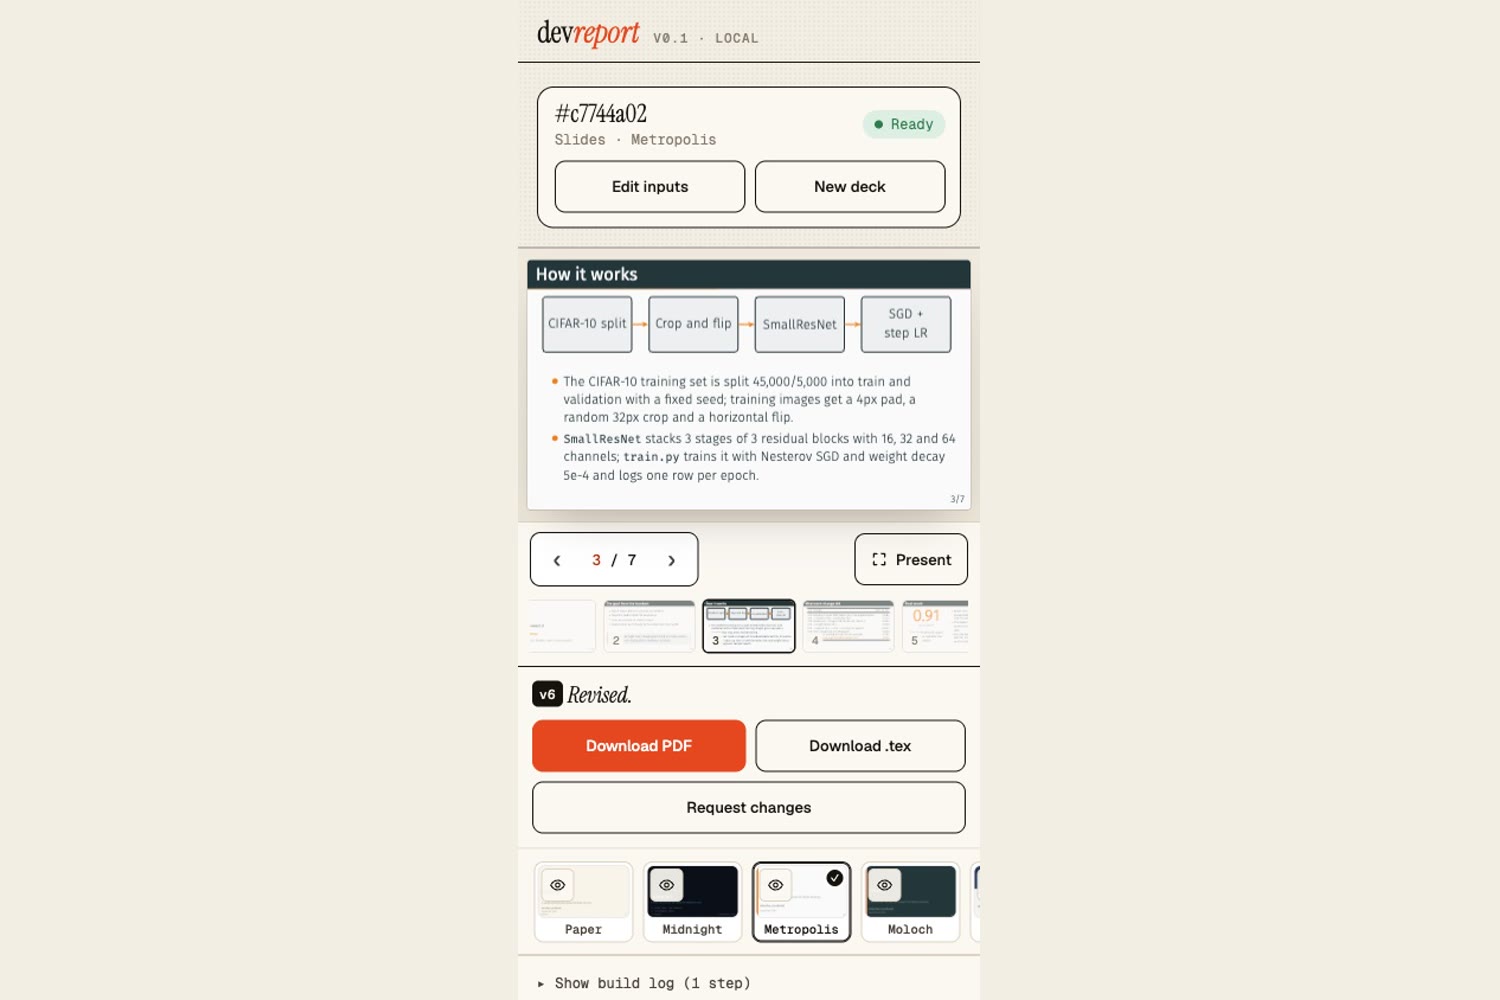
Multiple themes supported , you can add your own too very easily
-
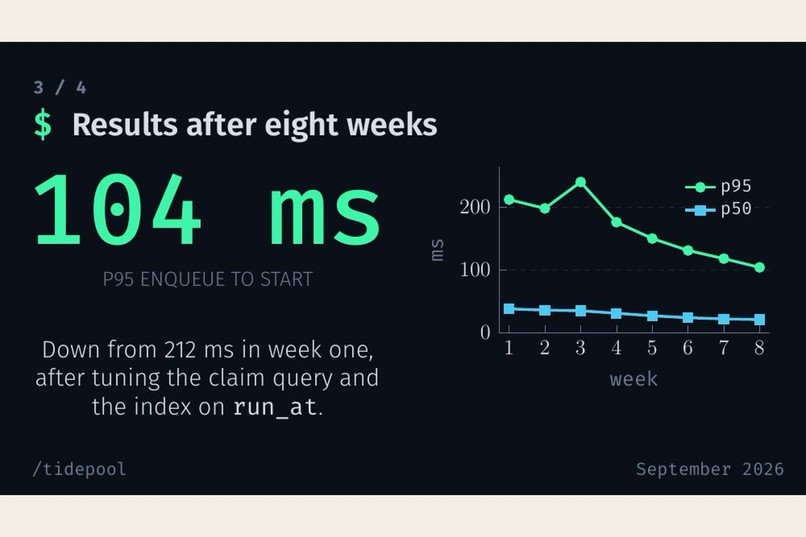
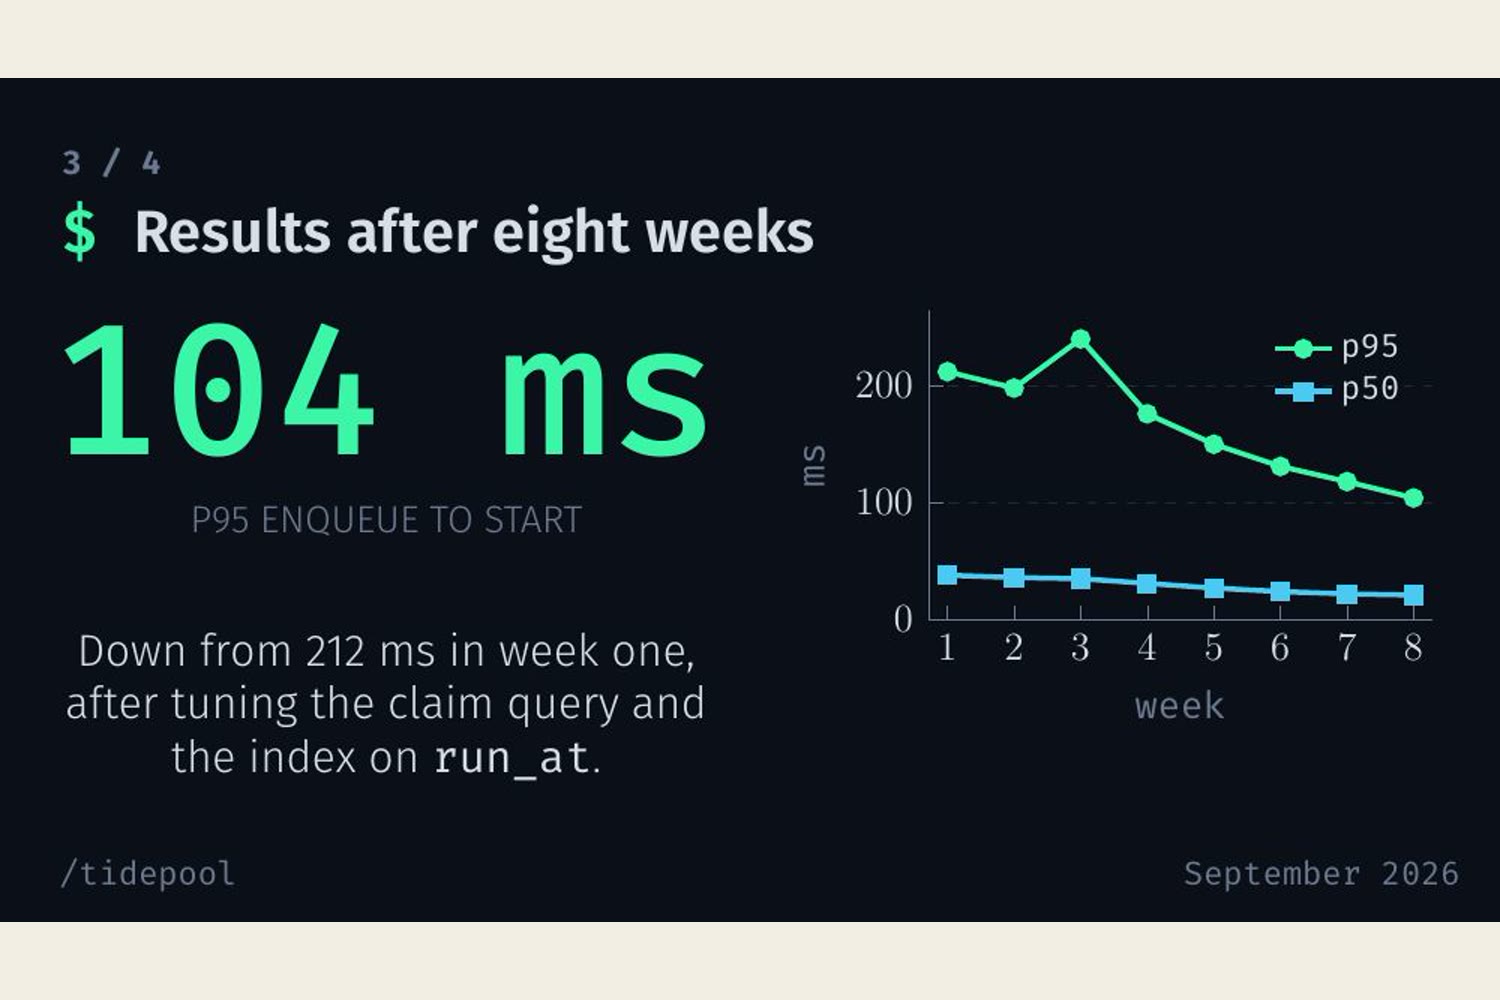
Another example of a slide generated
-
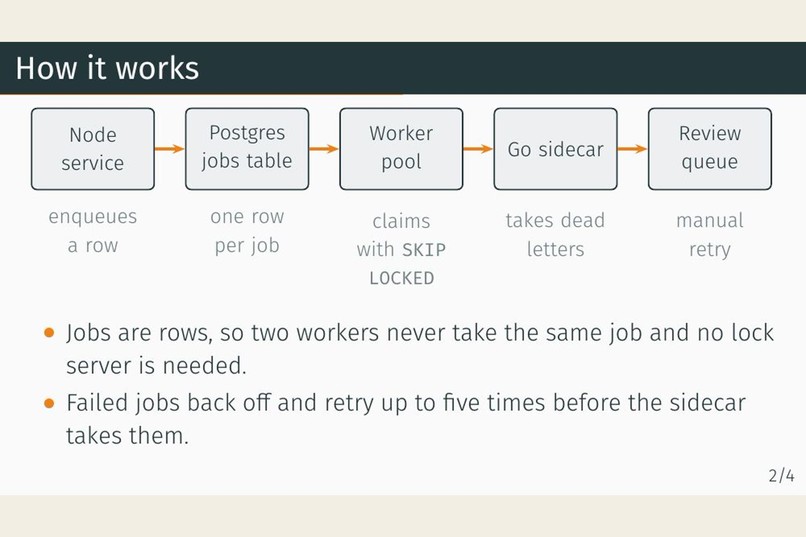
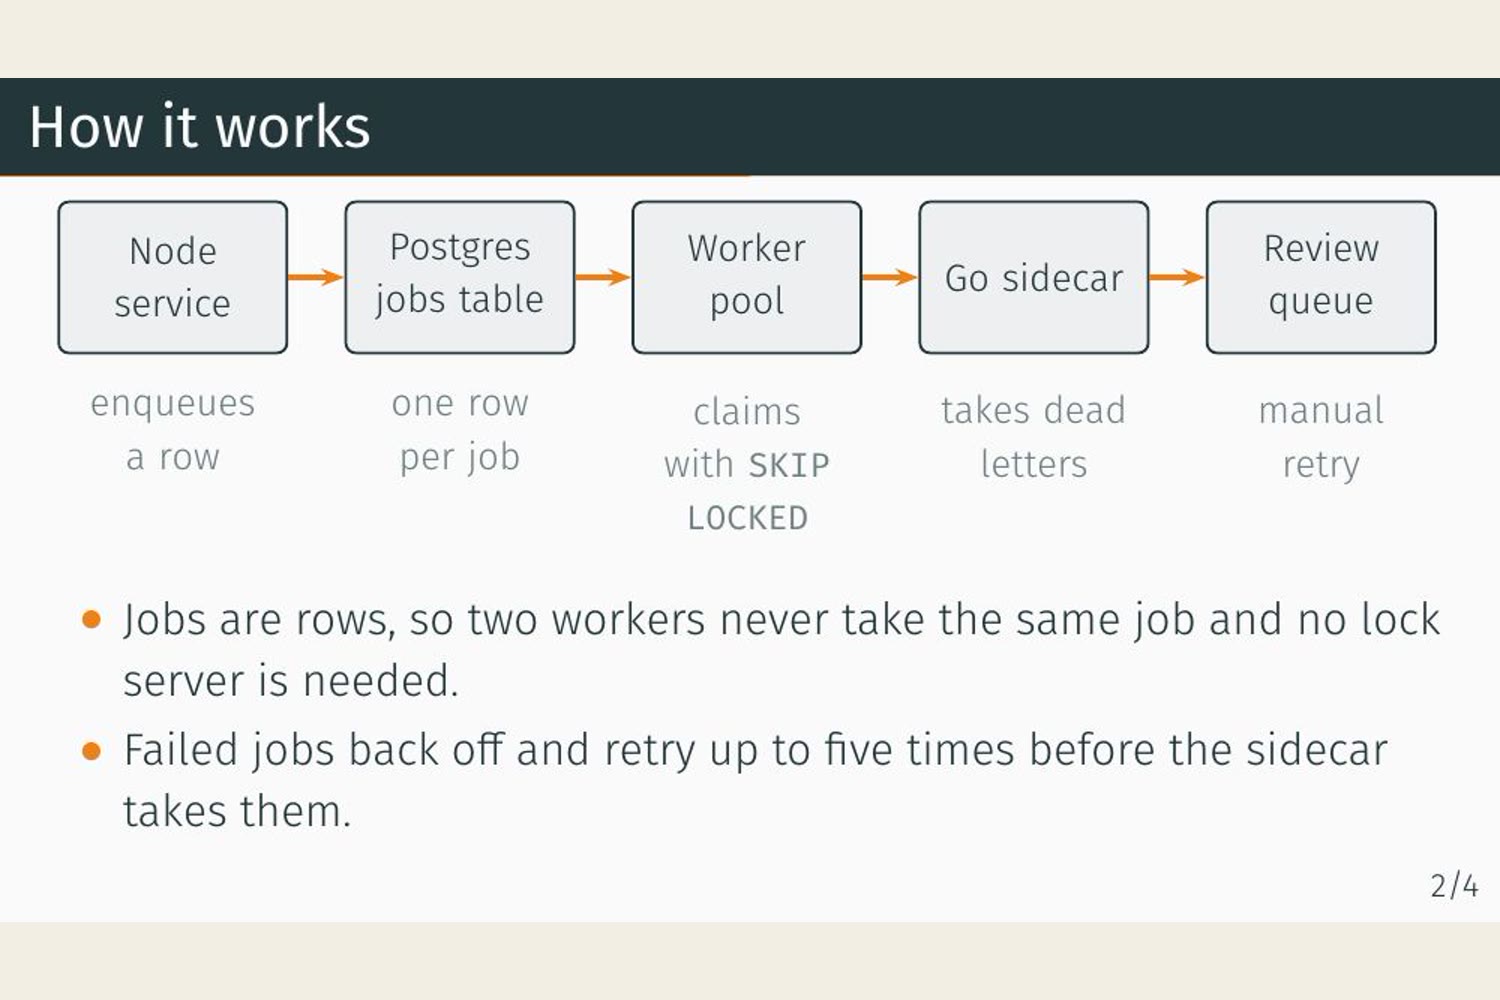
The visual you see up there was automatically generated by devreport without any human prompting
-

We also make reports! (because only making ppts would be boring)
-
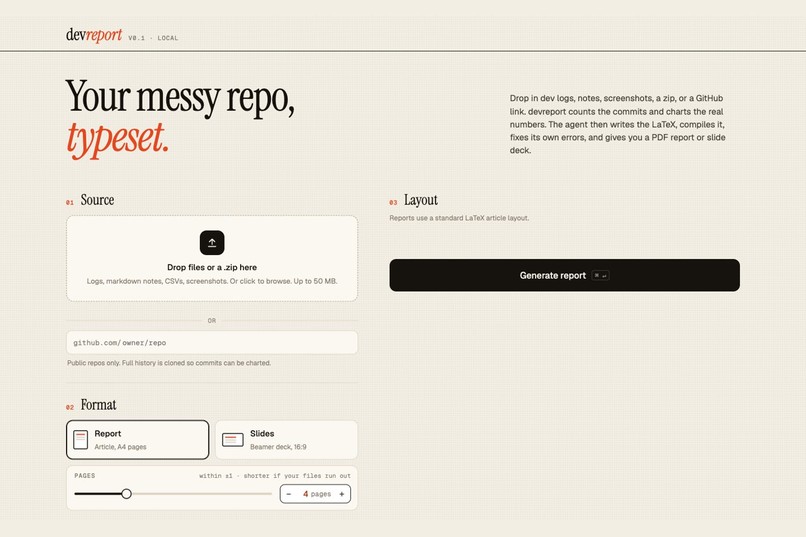
Just as with PPT , simply provide a git repo or drop a zip
-
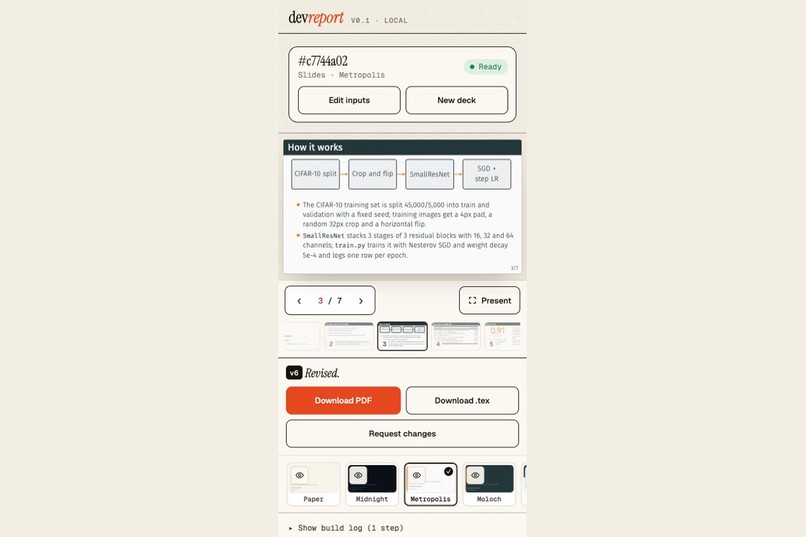
We have optimized devreport to work on any device , irrespective of the screen space (we don't discriminate :))
-
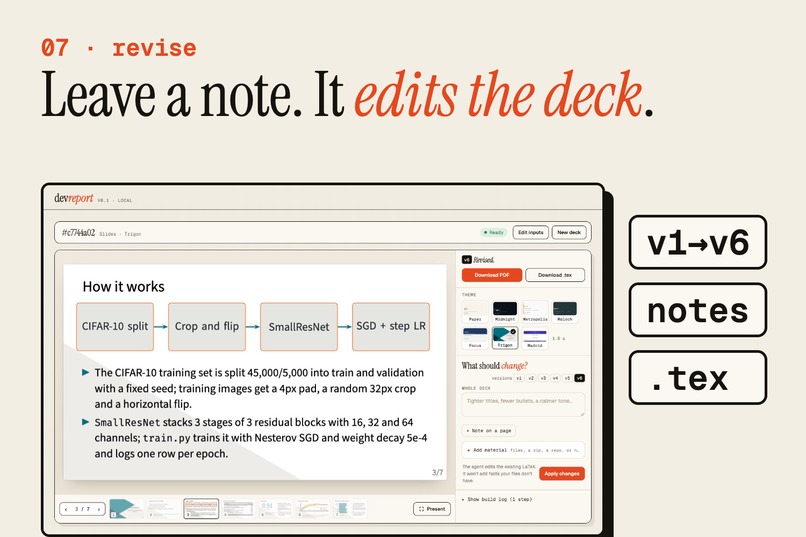
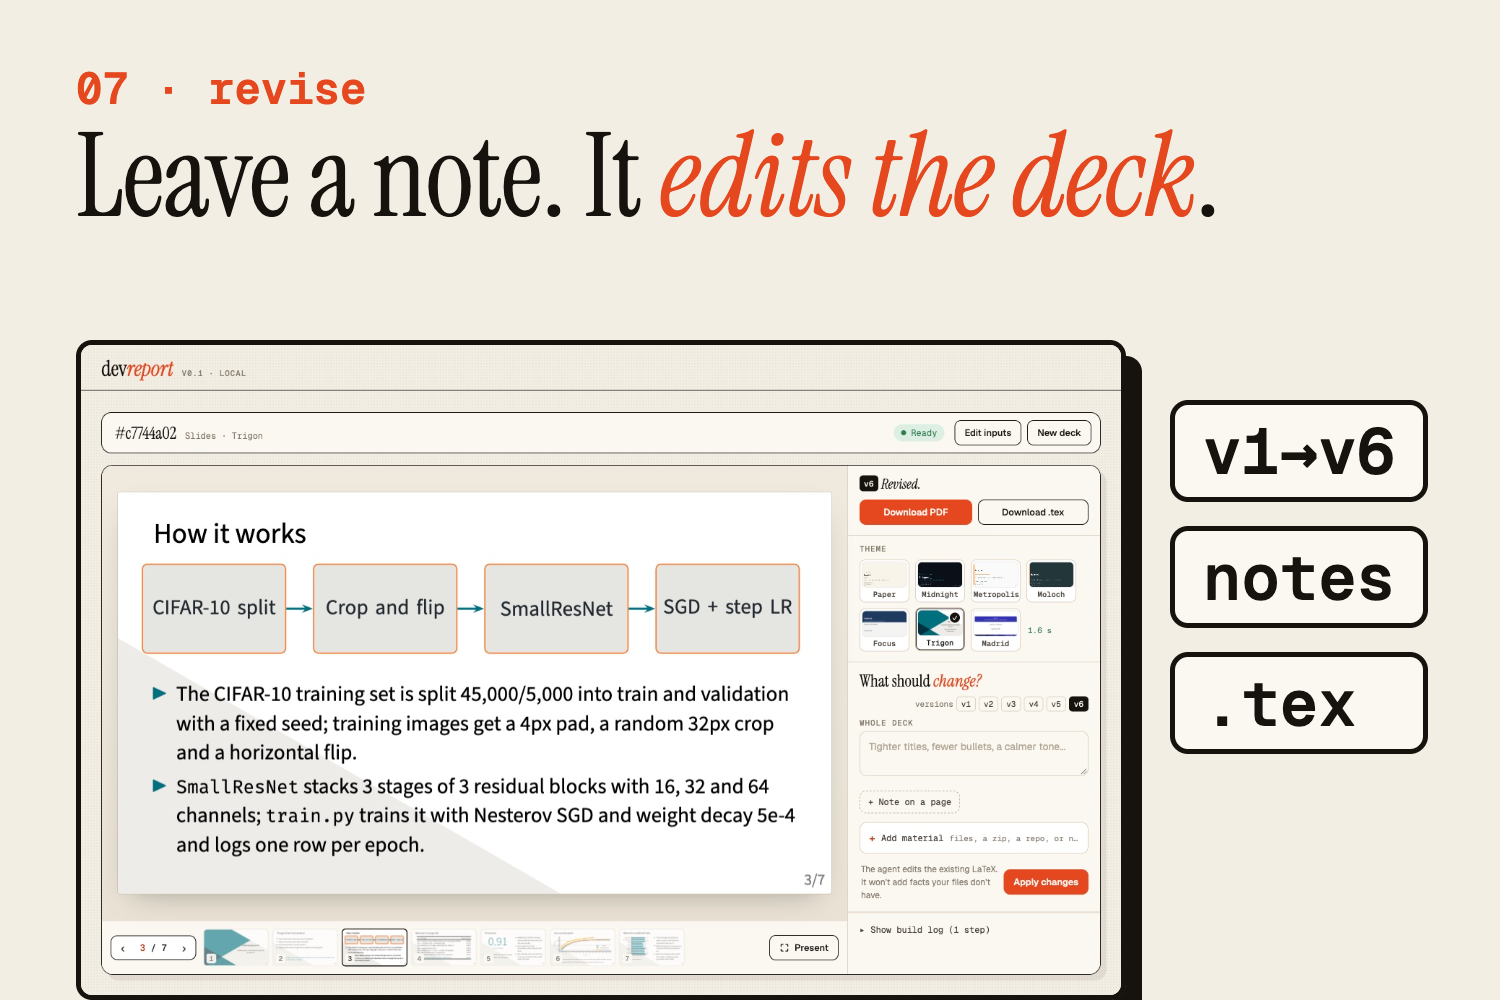
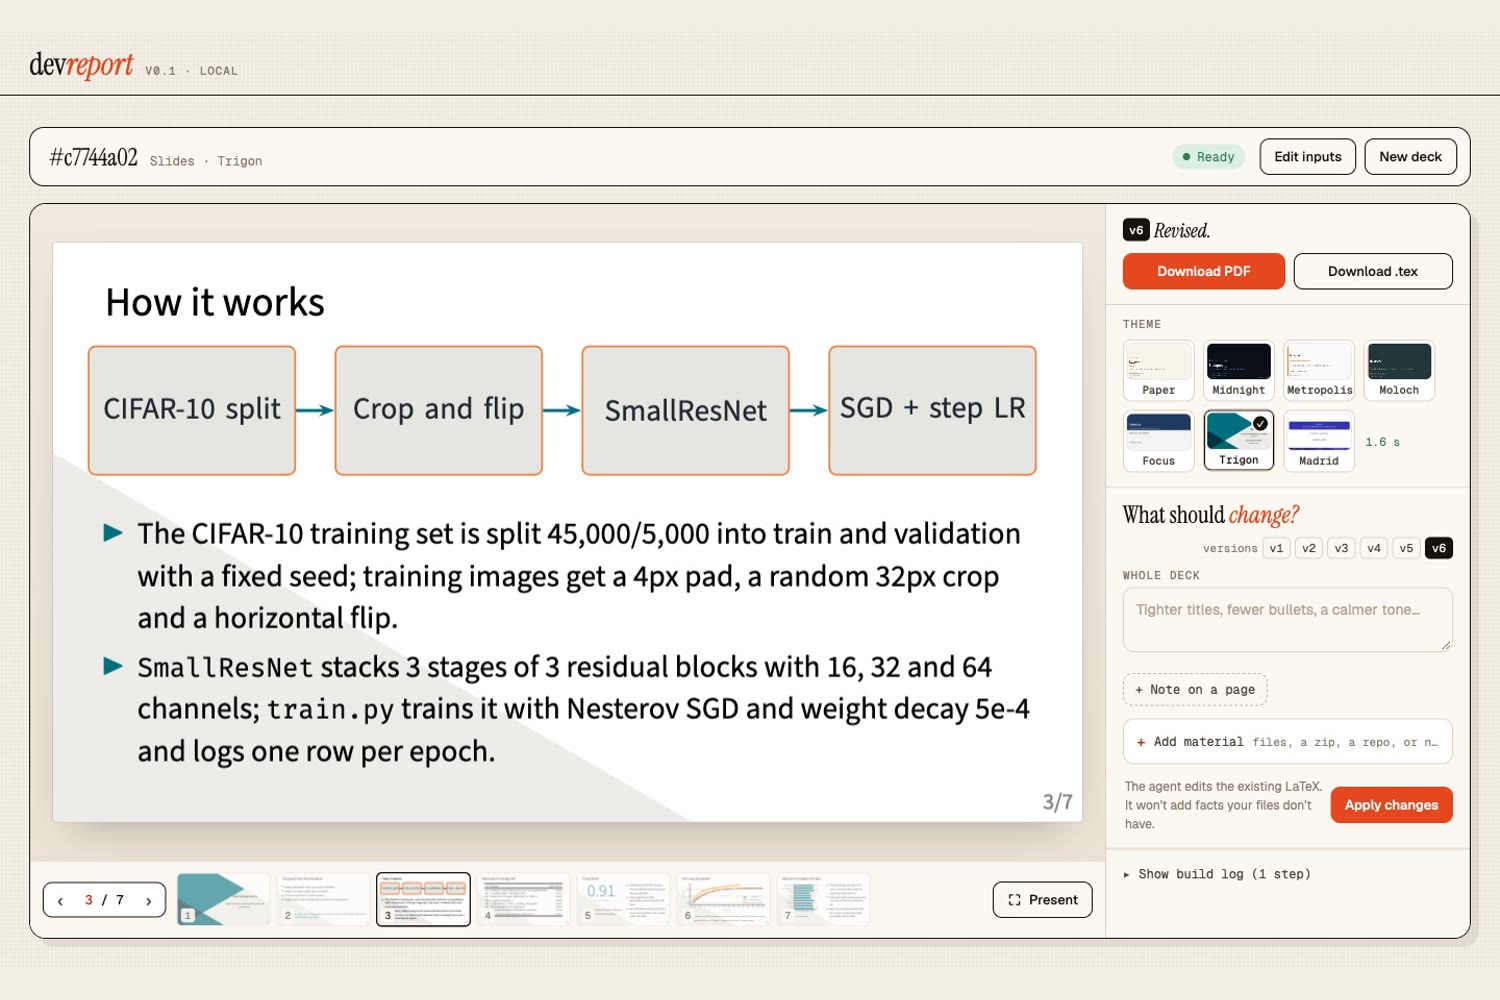
Support for easy modifications ( just click on the page and type what you want changed)
-
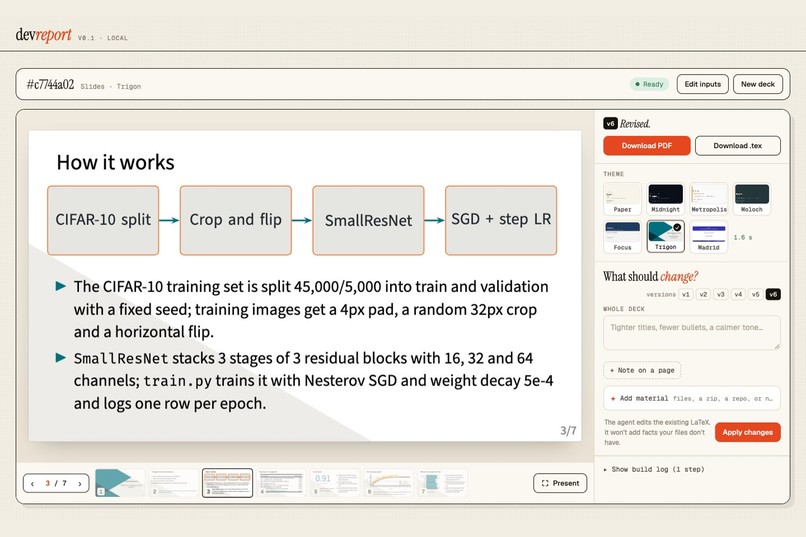
How the site looks in the modification page

devreport
Turn a messy project folder into a LaTeX report or slide deck whose charts can't make up your results.
- Live demo: the real UI with a replayed build, so you can click through it without a key
- Demo video
- Code on GitHub
- Samples: report · deck in Trigon · deck in Moloch · deck in Midnight
Inspiration
Every hackathon and course project ends the same way. The code works, and then someone has to turn a git history, some terminal logs, a notes file, a few screenshots and maybe a CSV of results into a report or a deck. I like building. I don't like spending the evening after a deadline digging numbers out of logs and pasting them into a template.
AI slide tools will do the write-up for you, but they also make up the numbers. A results section with invented results is worse than no report at all. I wanted a tool that does the write-up and only says what the files back up.
What it does
You drop in a zip, loose files or a GitHub link, then pick Report or Slides, a length, and a theme if it's slides. devreport parses everything with ordinary tested code. It pulls milestones from the git history, groups repeated errors in logs, works out the column types in your own CSV or JSON, and reads your notes, screenshots and, when there's no README, the source code. If it still can't tell what the project is or who it's for, it asks up to three questions. Most repos with a README get none.
An agent then writes the LaTeX and compiles it with tectonic, fixing its own errors while a short progress log updates. The PDF opens in a custom viewer. From there you can switch between 7 slide themes in a little over a second (try it on the live demo), leave a note on one slide, ask for changes, or add more files later. Each revision edits the same document and keeps the old versions.
Reports use a standard research-paper layout with an abstract, numbered sections and numbered figures. Slides can also copy the look of an uploaded .pptx template.
How I built it
devreport is a pipeline with one rule: the model writes words, and code produces everything else. The language model sits in the middle of the pipeline, and deterministic code runs on both sides of it.
upload / .zip / GitHub link
  → server.js     safe intake into jobs/<id>/input/
  → collect.js    git history, logs, tables, notes, images → data/*.csv + facts.json
  → agent         reads facts.json and key files, writes main.tex with 4 sandboxed tools
  → tectonic      compiles; the agent reads the errors, fixes, recompiles
  → main.pdf      pdf.js viewer, theme switcher, revisions
A deterministic collector
collect.js is about 450 lines of dependency-free Node, and node:test covers it. It turns whatever you upload into data/*.csv and a single facts.json, with the same output every time for the same input.
- Git history. It runs
git log --numstatand picks at most eight milestones: the first commit, tagged commits, then the largest feature commits spread over equal time windows. Lockfiles,dist/,vendor/,node_modules/and minified files are excluded, and commits that only touched them are dropped. - Logs. It detects ISO, syslog and
[HH:MM:SS]timestamps and ERROR/WARN/INFO levels. Repeated errors are grouped by replacing numbers, hex strings and IDs with placeholders, so two database timeouts with different durations count as one pattern. - Your data. For CSV and JSON tables it infers each column's type (date, number or category) and picks a chart from that. A date and a number give a line chart, a category and a number give a bar chart, and an all-numeric table whose first column strictly increases (like an epoch) gives one line chart per metric group.
- Code. When there's no README, it finds likely entry points from manifests (
main,bin,scripts,pyproject) and entry-like file names.
Typesetting is fully deterministic
The PDF comes from LaTeX, compiled by tectonic. LaTeX is completely deterministic: the same main.tex and the same CSVs always produce the same pages. That property is what makes the honesty guarantee work. Every chart is a pgfplots figure of the form \addplot table{data/x.csv}, and every stat comes from facts.json. The model chooses which charts to show and writes the axis code from tested snippets, but it never types a data point. A wrong chart would need a bug in tested code, not a hallucination.
A sandbox made of tools
The agent gets exactly four tools: read_file, write_file, edit_file and compile. It has no shell. Every path goes through one check in agent.js. That check resolves the real path, refuses anything outside the job folder, refuses any path that goes through a symlink (including dangling ones, found with lstat), and blocks writes to job.json, facts.json, data/ and input/, so the agent can't edit its own evidence.
The same pipeline runs on two engines. The cli engine runs Claude Code headless with only Read, Write(./**), Edit(./**), Bash(tectonic:*) and Skill allowed. The ai engine is my own agent loop on the Vercel AI SDK. It works with OpenRouter, OpenAI, Anthropic, Google, Groq or a local model through Ollama, has an 80-step budget and nudges, and saves the conversation so a run that stopped to ask questions resumes in the same session.
The agent follows a written playbook (SKILL.md) and tested chart snippets (charts.md). When a compile fails inside one of the layout macros, the compile tool returns the error together with the correct usage from charts.md, which fixes most argument mistakes on the next try.
Seven themes, one main.tex
main.tex never names a theme. It loads its look with one line, \input{theme.tex}. Each theme is a small adapter .sty over a shared core, devreport-core.sty, which defines the same colours, chart styles, stat tiles and layout macros (flow diagrams, timelines, big numbers, two columns) for every theme. The adapters wrap Metropolis, Moloch, Focus, Trigon and Madrid, plus two themes of my own, Paper and Midnight. Each theme owns its type scale, so the agent writes \drTitle or \drStat and never a raw font size.
Switching theme rewrites theme.tex and recompiles in 1.2 to 1.3 seconds without calling the model. Compiled themes are cached under a hash of main.tex, so switching back is instant and a revision invalidates the cache.
pptx.js reads an uploaded PowerPoint template's XML and extracts its colours, fonts, placeholder layout boxes, media and thumbnail. That becomes a custom theme on the same core.
A standard-library server
server.js uses only the Node standard library. Uploads are capped at 50 MB. Before extracting a zip it sums the unpacked size from unzip -l and refuses anything over 200 MB, rejects entries that resolve outside input/, and deletes symlinks afterwards. GitHub links are normalised, matched against a strict pattern and cloned with execFile (no shell), GIT_TERMINAL_PROMPT=0 and a timeout. On untrusted repos only git log runs, so no hooks fire.
Progress streams to the browser over server-sent events. The server sends one raw step per agent action, and the UI folds them into one line per phase. Every event is replayed on connect, so a reload or a dropped connection rebuilds the same feed.
The interface
The whole UI is a single index.html with no build step: drop zone, live feed, a pdf.js viewer with slide thumbnails and a present mode, page notes, version history and the theme switcher. For a quick start there's a Docker image with tectonic and a warmed TeX cache, so docker compose up --build is the whole setup.
Challenges I ran into
The model kept charting vanity metrics
The first decks were full of commit counts and lines of code. The prompt told the agent to use every chart, and the collector always produced git charts, so the agent did exactly what it was told. I reworded the prompt several times and nothing changed. The fix was in the data: I stopped offering commit counts and lines of code as charts at all.
Slides were a third empty
Early slides used a small default font and left about a third of each page blank. Telling the model to "fill the slide" didn't help, because it had no way to see how full a slide was. I gave each theme a larger, fixed set of type sizes, banned hand-set font sizes in the playbook, and wrote scripts/fill.py to measure how much of each slide's body the content fills. On the same 10-slide deck, slides now average between 71% and 85% full depending on the theme. Each theme's title bar and footline are different, so the script's measurements have to be redone whenever a theme's frame changes.
Seven themes, one document
Getting one main.tex to look right in seven themes took more work than any single theme. The themes put titles, footers and margins in different places, so a slide that fits in Midnight can overflow in Madrid. The fix was the shared core: every theme defines the same macros with its own sizes, and every chart snippet in charts.md is tested in every theme and in the report layout.
The sandbox leaked
Sandboxing took a few tries. A plain Write permission in Claude Code let the agent write to ../escape.txt, outside the job folder. I only found that by testing it. I switched to Write(./**), and in my own loop every path goes through one tested check that also catches symlinks. The compile tool takes no shell arguments at all.
Untrusted input everywhere
Everything a user uploads is hostile until proven otherwise: zips can be bombs or escape their folder, repos can carry hooks, and even the model's own questions.json is built from untrusted files. Each of those needed its own check, and the server keeps only well-formed, short questions before it shows them.
Pausing and resuming an agent
When the agent can't tell what a project is, it has to stop, ask, and pick up where it left off. That meant saving the session, resuming it with the user's answers (--resume on Claude Code, a saved message history in my own loop), and making sure a skip works as well as an answer.
Live progress that doesn't break
Server-sent event streams dropped without warning on idle connections, and a reload lost the whole feed. I added a ping every 15 seconds, made the server replay every event on connect, and made the UI skip the events it already showed. Reattaching after a reload works the same way.
Keeping small models on track
Smaller open models stopped early, repeated the same call, or got stuck on compile errors. Each failure turned into a guard: nudges when the model stops without a PDF, a step budget, compile errors that include the correct macro usage, and tool errors that say exactly what went wrong.
Accomplishments that I'm proud of
Every chart and stat comes from computed data, and the agent turns down requests it can't support, like "add revenue numbers". The sample report is devreport writing about itself from numbers I measured: compile time per theme, build times across 24 test runs, and slide fill.
It's cheap to run. With DeepSeek v4.1 Flash on OpenRouter a deck costs about $0.04 to $0.10, and a revision costs under a cent. A local model through Ollama costs nothing.
Theme switching is fast because it never calls the model: a warm recompile takes 1.2 to 1.3 seconds, and themes you've already used are cached. You can comment on a single slide, and revisions run in the background while the deck stays on screen. The same pipeline runs on a Claude Code login or on any API key. All 18 tests pass in under a second.
What I learned
Keep the numbers away from the model. collect.js computes every CSV and the LaTeX only points at those files, so a wrong number would have to come from a bug in code I can test.
The data the model is given beats any rule in the prompt. The vanity metrics only went away when I stopped producing those charts.
Empty slides were a type-size problem. Banning hand-set font sizes and letting each theme own its sizes fixed most of it, and measuring fill with a script worked better than eyeballing it.
I had to test the sandbox before I could trust it. A plain Write permission could write to ../escape.txt, and Write(./**) stopped it. My own loop sends every path through one tested check.
I also learned to measure cost instead of guessing. Each model call re-sends the whole conversation so far, so a run's cost depends on how many calls it makes more than on how many slides it has. One 10-slide deck that needed 29 calls cost about three times as much as another that needed 13.
Server-sent event streams can drop without warning. A ping every 15 seconds, reconnecting without repeating steps, and reattaching after a page reload fixed it.
Weaker models fail in predictable ways, and each failure I saw turned into a guard rail in agent.js.
What's next
I want to link every claim to its evidence: the commit, line of code, log line or CSV row it came from. After that, reading AI coding-session transcripts for the "how we built it" section, exporting a Devpost write-up, and adding university LaTeX templates.




Log in or sign up for Devpost to join the conversation.