-
-
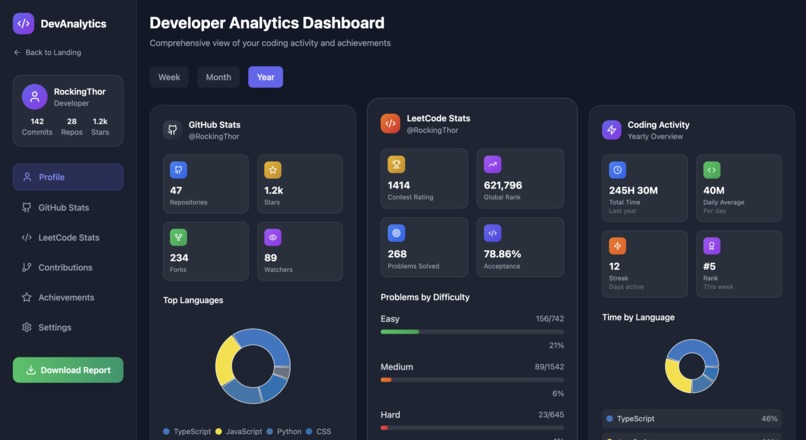
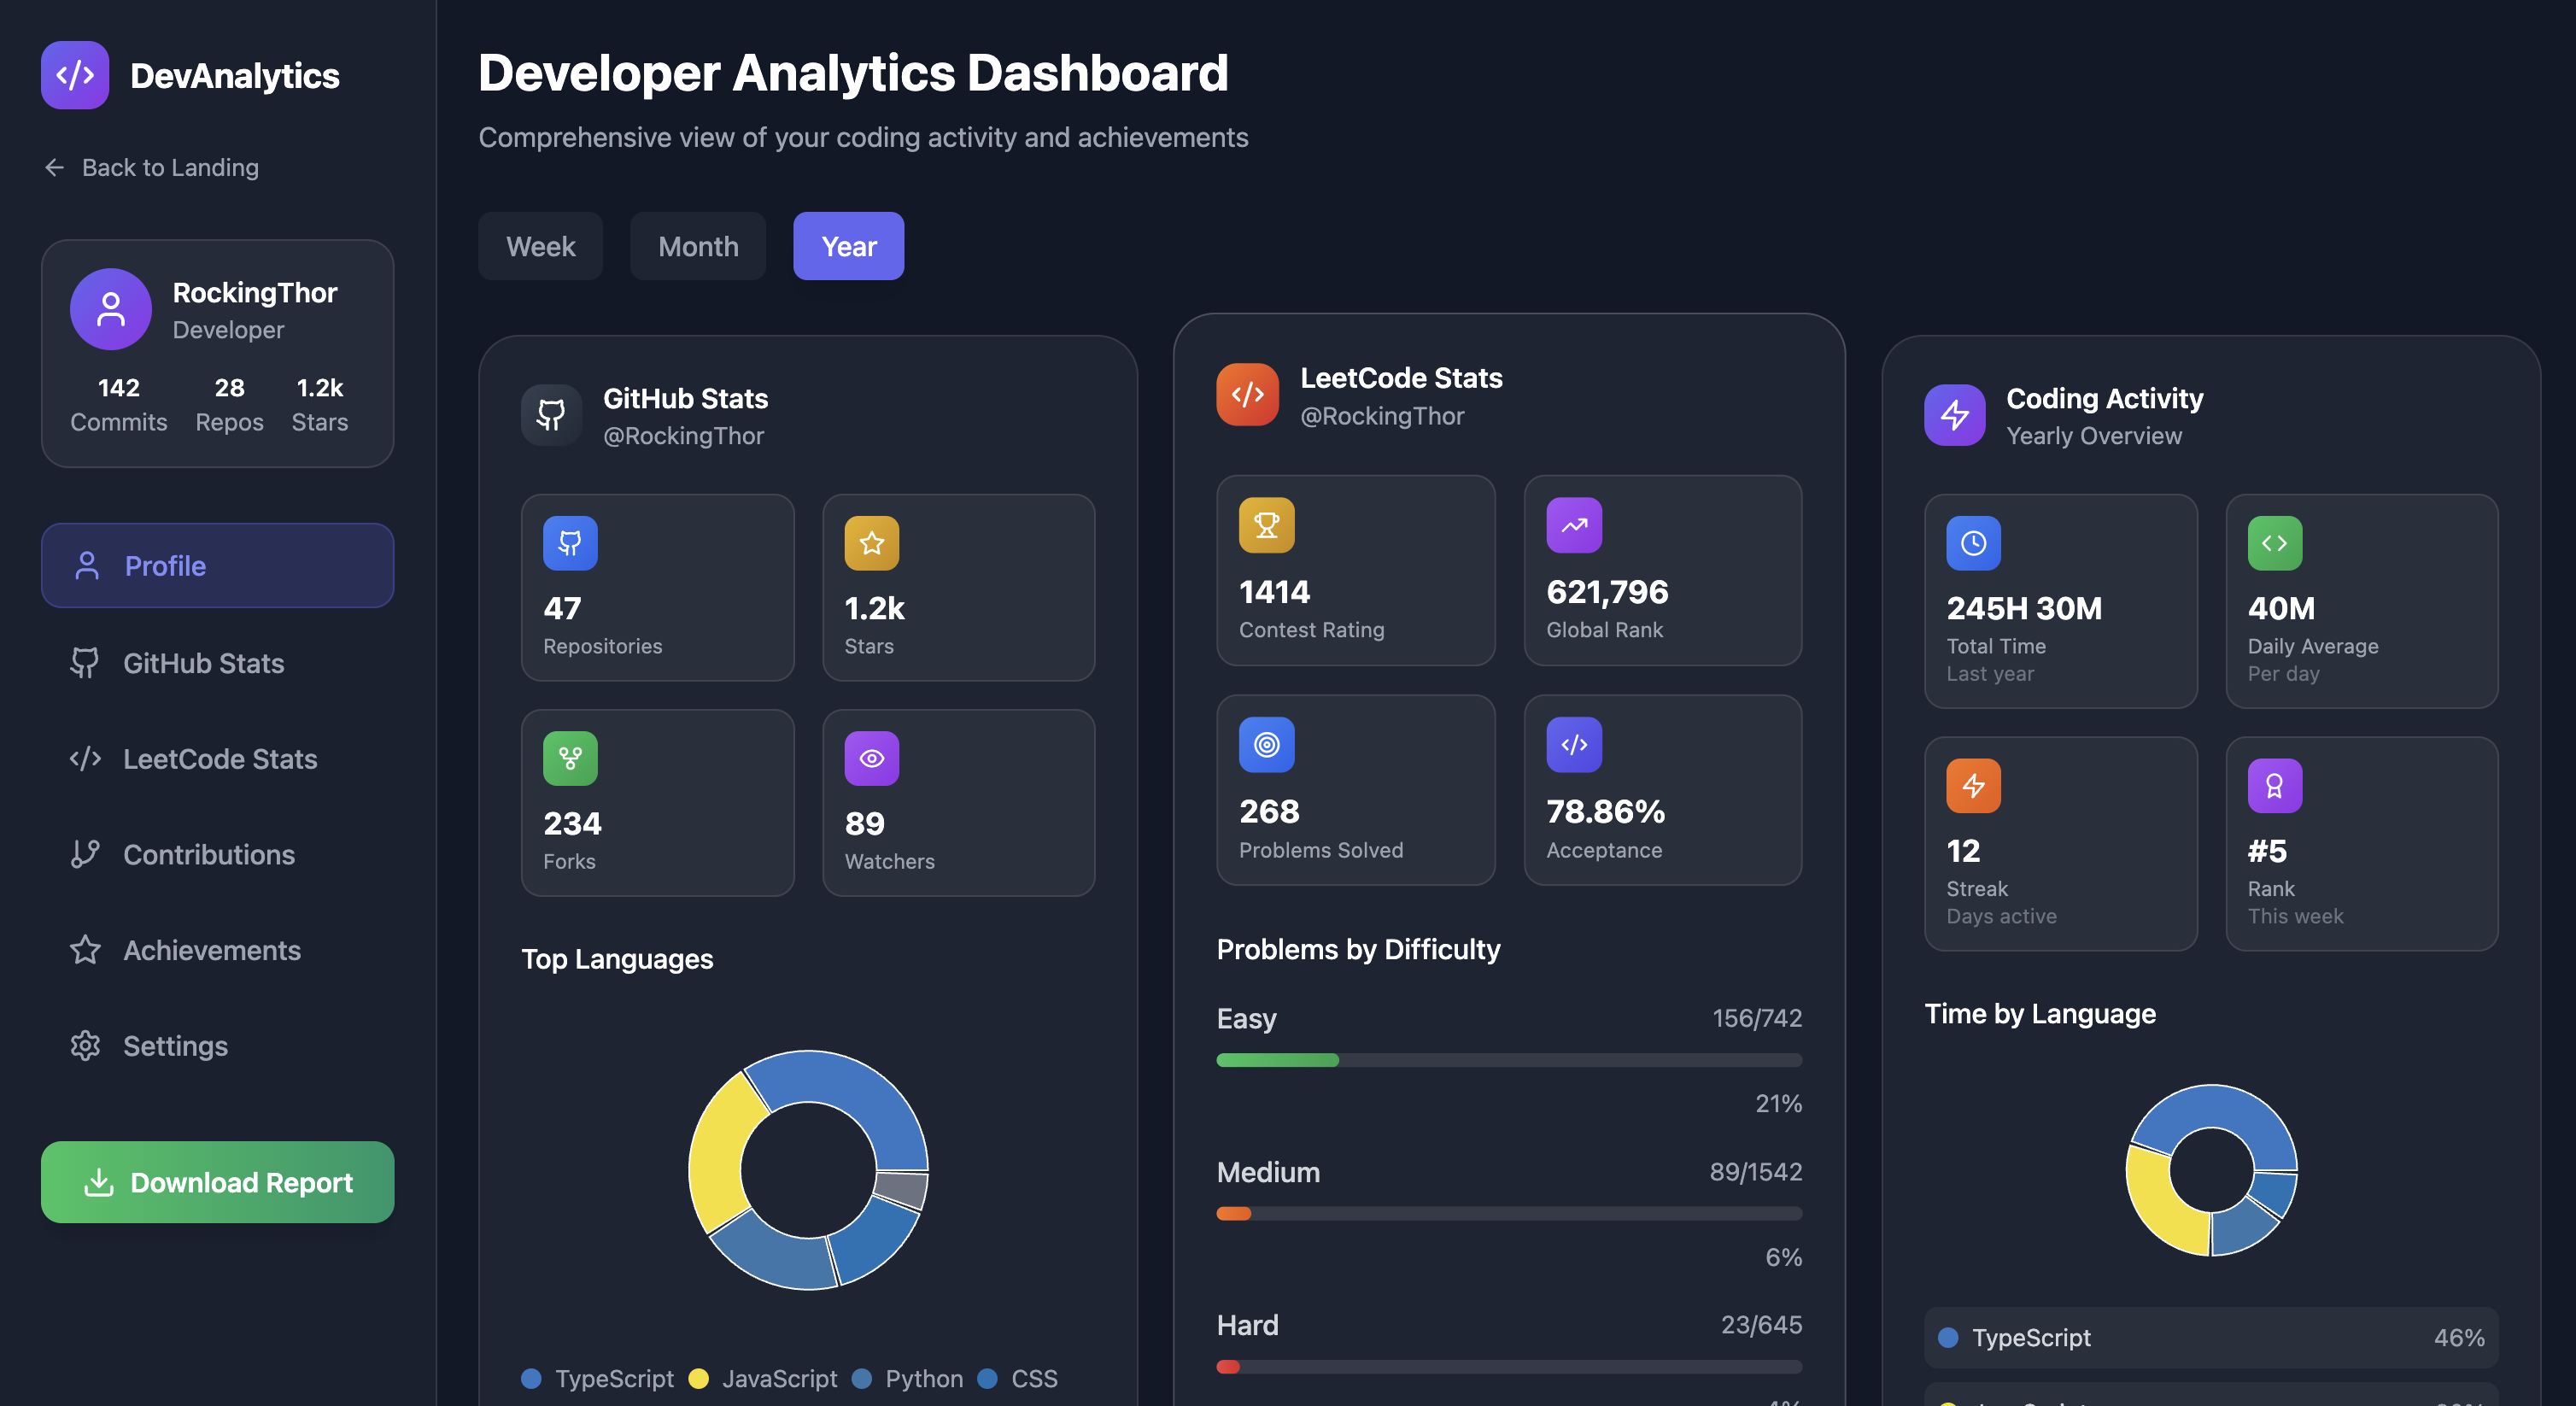
Dashboard view
🚀 About the Project
DevAnalytics is a dynamic developer analytics dashboard designed to beautifully visualize a coder’s journey across GitHub and LeetCode. It brings all essential metrics into one place — contribution graphs, problem-solving stats, contest history, and more — wrapped in a premium, modern UI.
🎯 Inspiration
As developers, we often scatter our progress across platforms like GitHub and LeetCode. I wanted a unified, elegant interface that not only tracks but celebrates this journey — with real-time data, sleek visuals, and interactive experiences. That sparked the idea for DevAnalytics.
🛠️ How It Was Built
- Frontend: React + Tailwind CSS with shadcn/ui components
- Animations: Framer Motion for smooth transitions and interactivity
- Data Fetching: GitHub and LeetCode APIs with error handling and real-time sync
- Charts: Recharts & custom D3 visualizations (heatmaps, donut charts, streak calendars)
- UI Design: Dark theme with glassmorphism, gradients, and micro-interactions
- Features: Downloadable reports, filtering, expandable views, and more
📚 What I Learned
- Efficient API handling and caching for external developer platforms
- Building polished UI/UX with accessibility and responsiveness in mind
- Integrating complex data visualizations smoothly into React
- Fine-tuning performance for a fast, premium dashboard experience
🧩 Challenges Faced
- Lack of official LeetCode API required workaround strategies
- Syncing real-time data with smooth animations without lag
- Designing a responsive yet dense dashboard layout for both desktop and mobile
- Implementing custom interactive charts with detailed tooltips and hover states
Built With
- react
- tailwind
- typescript
- vite

Log in or sign up for Devpost to join the conversation.