-
-
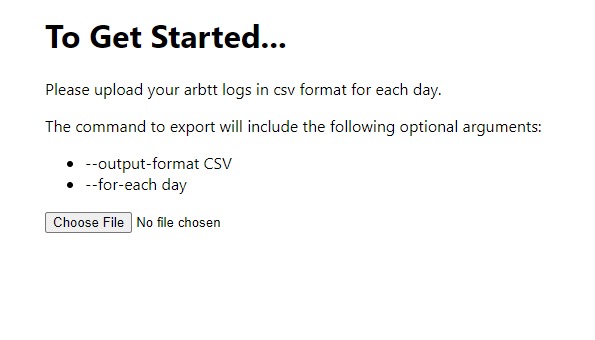
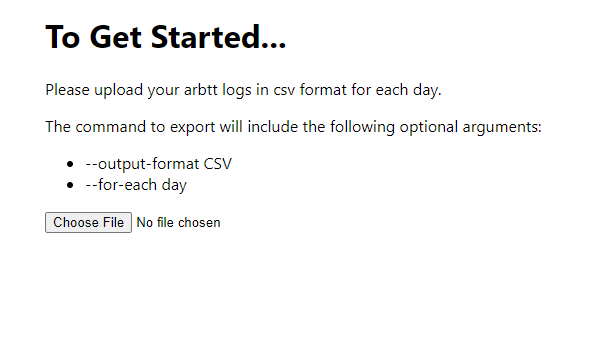
Get Started
-
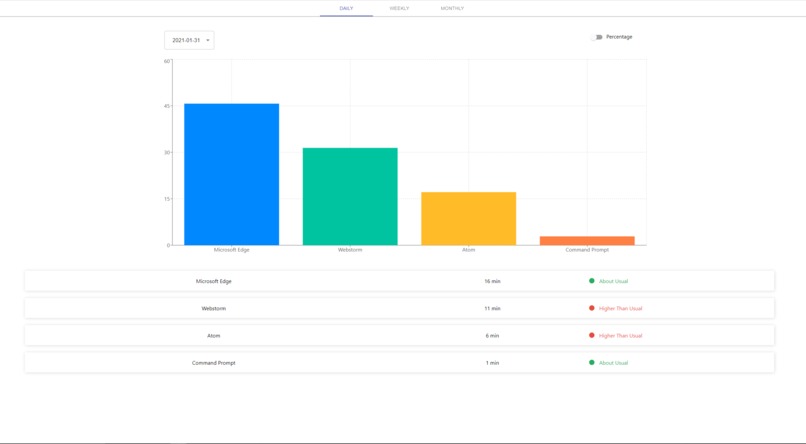
Daily View
-
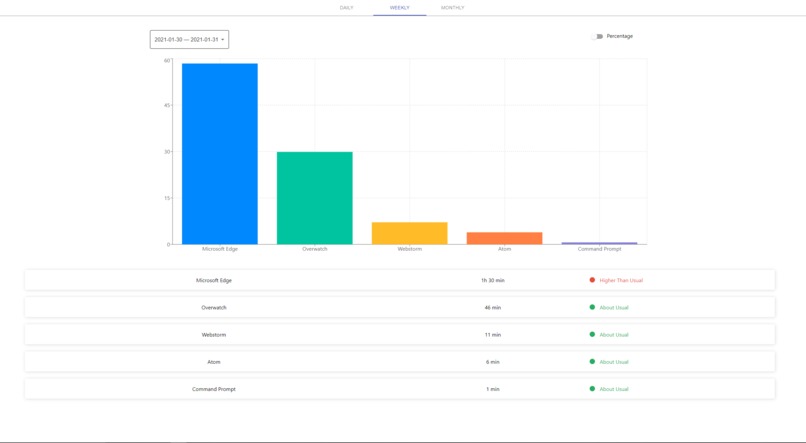
Weekly View
-
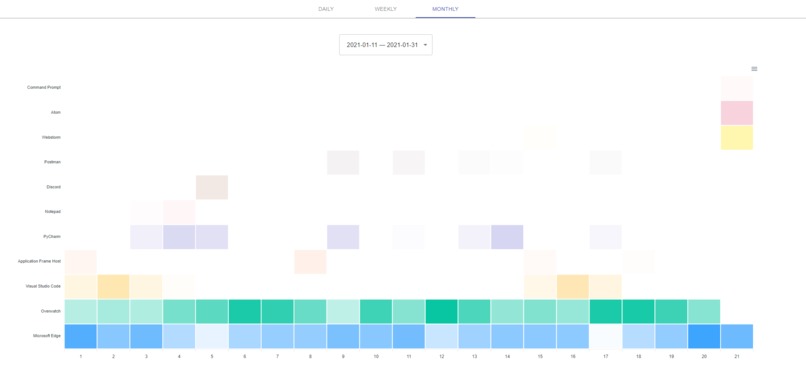
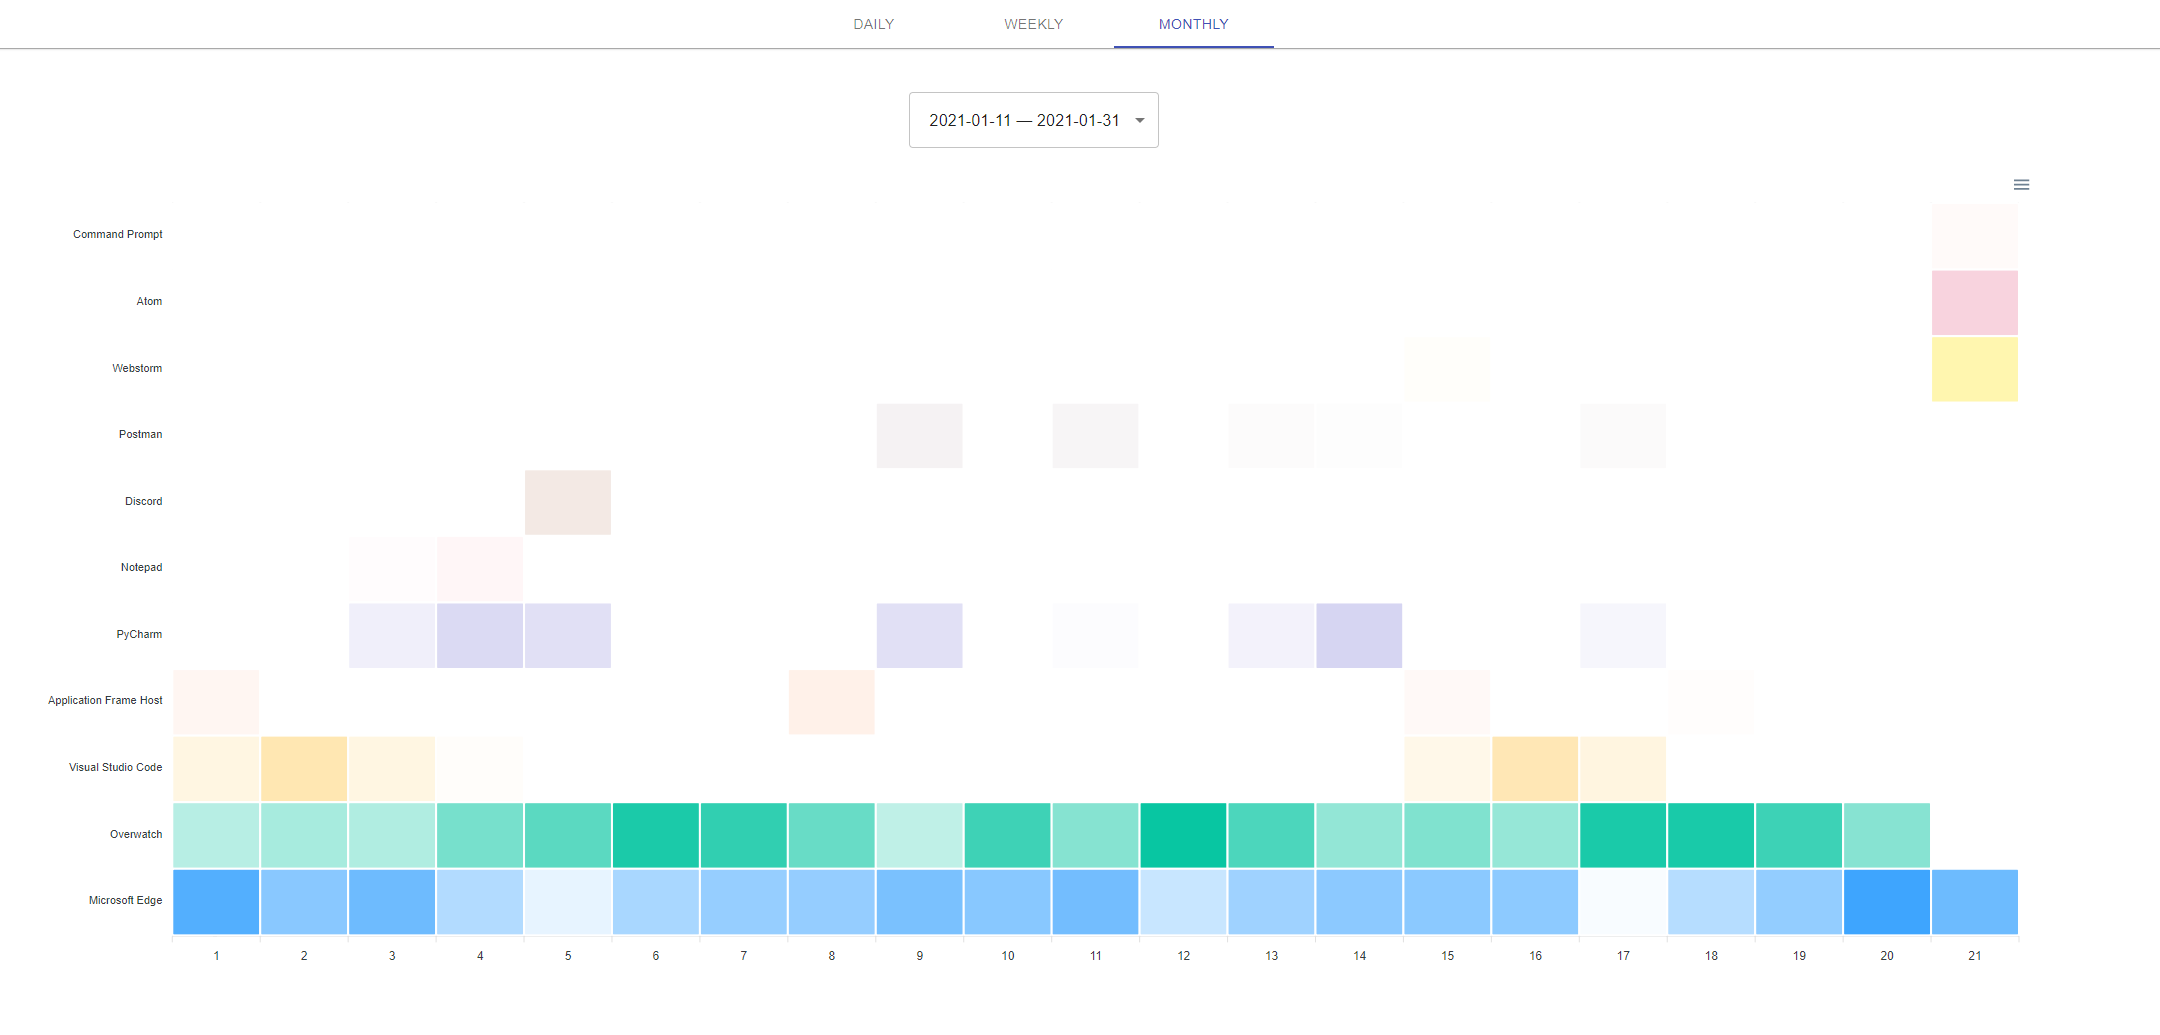
Monthly View


Inspiration
Ever wondered how you spend your time on your computer and how your productivity or gaming sessions look like? In this 24-hour hackathon, our team has built Dev Insights to quench our curiosity for this exact question!
What it does
Dev Insights is a time tracker viewer that allows you to view your desktop time usage in a typical day, week, and/or month. Before using Dev Insights, you'll need to start collecting some data first by setting up arbtt on your computer. Then once your data is ready, simply upload your data and Dev Insights will uncover some insightful data of how you spend your time. This can mean realizing and fixing your bad habits of procrastination, or spending too much/too little time on something and looking to reduce/increase it.
How we built it
This project was built using React, a few other libraries (e.g., Recharts, ApexCharts, Material UI) to make the front-end development process faster, and arbtt for data collection.
Challenges we ran into
The challenge that we ran into was definitely the time constraint. Our initial plan for the data visualization for Dev Insights was definitely more complex, integrating multiple charts, but due to the time constraint, we have to make do with less visualizations that is definitely still insightful.
Accomplishments that we're proud of
That we are able to built a decently good-looking time tracker view within 24 hours and discover some interesting data about how we spend our time.
What we learned
Using multiple chart libraries and manipulating arbtt data to fit them.
What's next for Dev Insights
More insightful visualizations that we weren't able to finish on time.
Built With
- apexcharts
- arbtt
- javascript
- material-ui
- react
- recharts

Log in or sign up for Devpost to join the conversation.